December Crash of 1899

123-Year Anniversary, Coming Up

It’s happened, before …

Even so, unless you knew it (and the exact date), finding information is difficult to near impossible.

A once free access to the New York Times article from December 19th, 1899, is now subscription based, link here.

Another link here, shows that December 19th, is not available for browsing.

Going to the site-map for that date, the crash is not at the top as one would expect.

It’s much farther down, buried in the list.

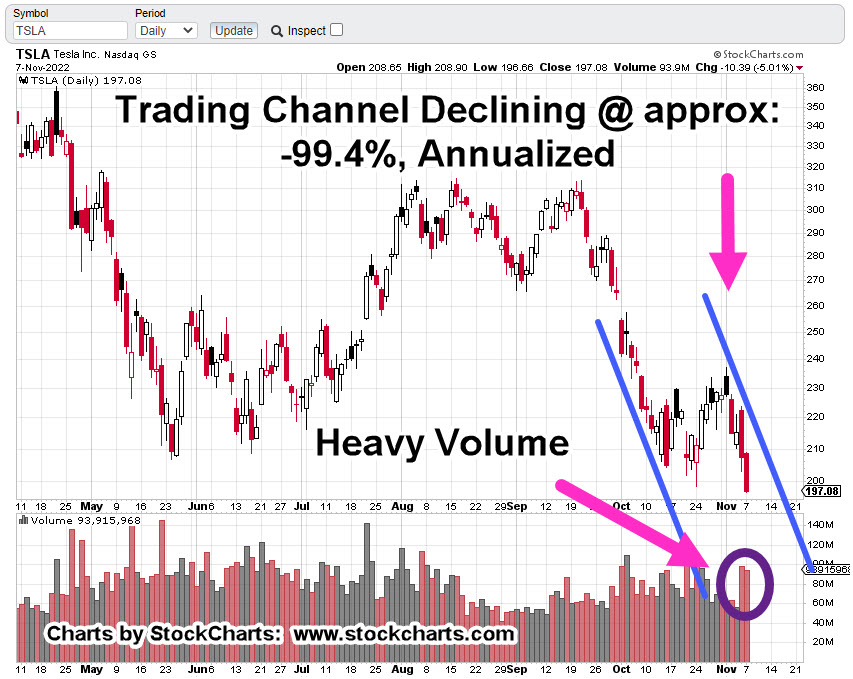
‘The worst day-panic, The Street has ever known’

Of course, in the NYT article, J.P. Morgan himself, is ‘credited’ with saving the market from further decline.

You have to laugh.

It’s just like an Arizona mid-term election. 🙂

Lastly, using the way-back machine, here’s an article from the Seattle Times, written in December 1999. It compares the situation (then) to a century earlier.

On Track For Another?

Obviously, that can’t be known until if/when, it happens.

However, we can look at the most watched market, the S&P, and see what it says.

S&P 500, SPY, Daily

We’re leaving in the moving averages to show, at least from the 200-Day perspective, the downtrend is still intact.

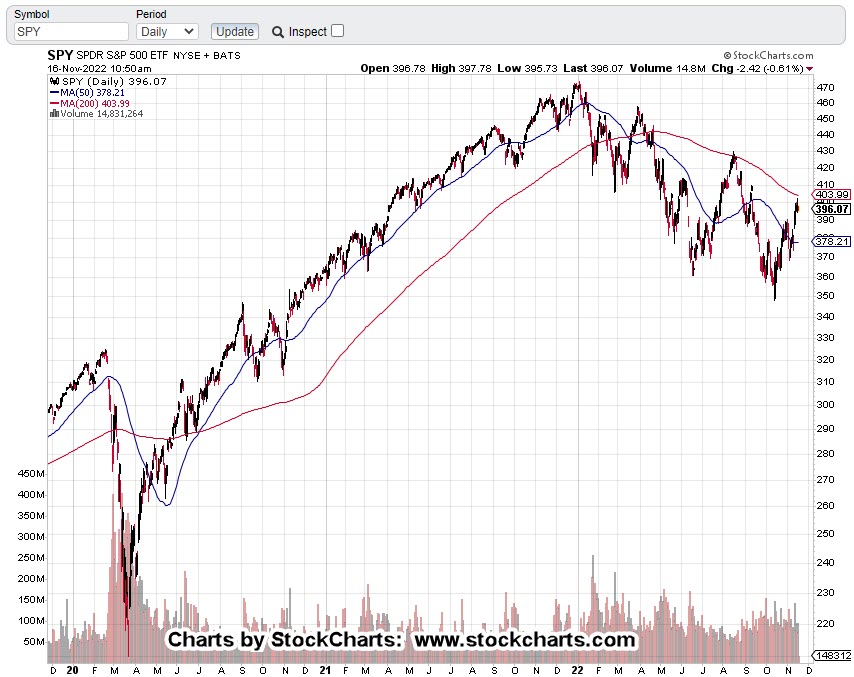
Other items to note:

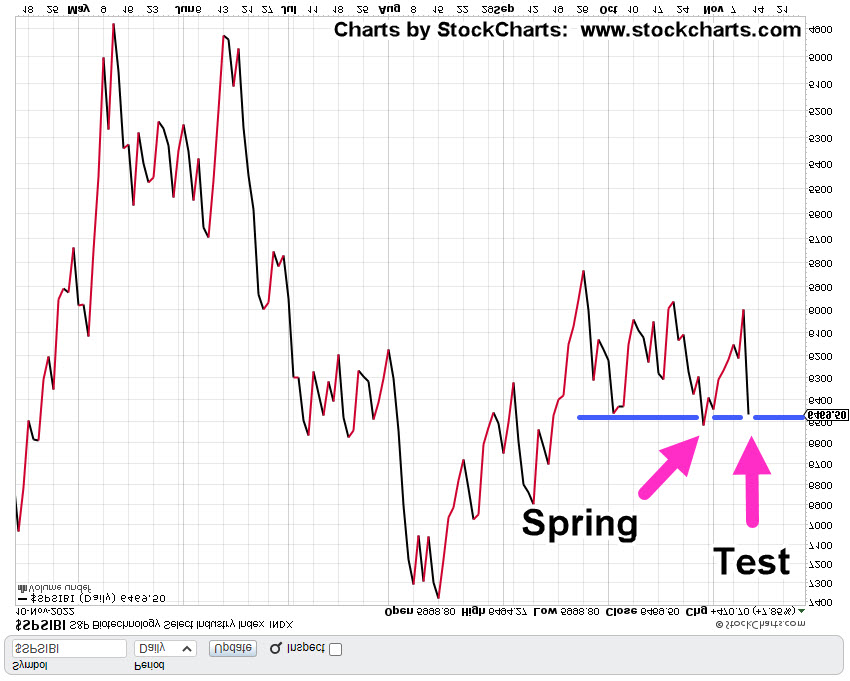
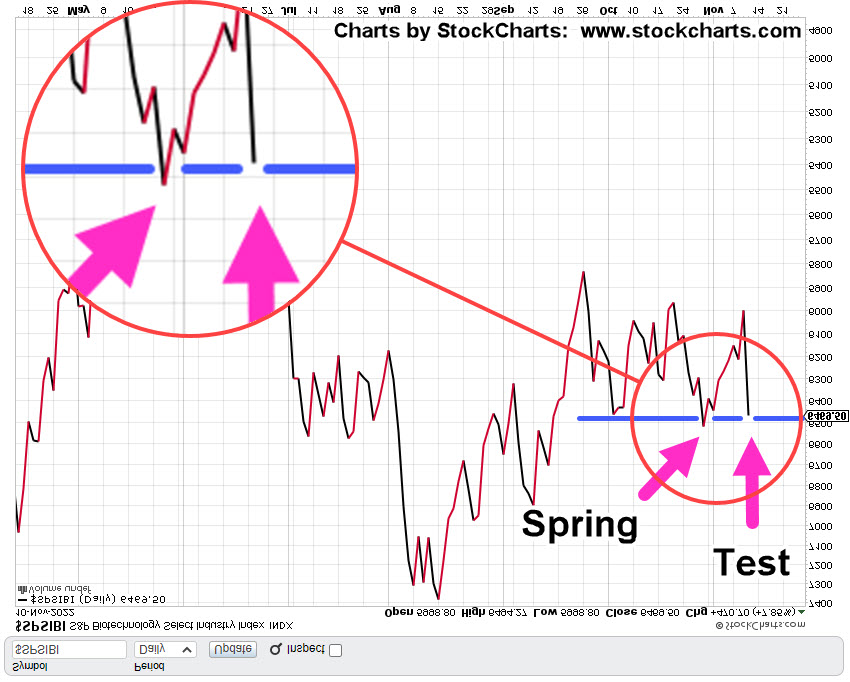
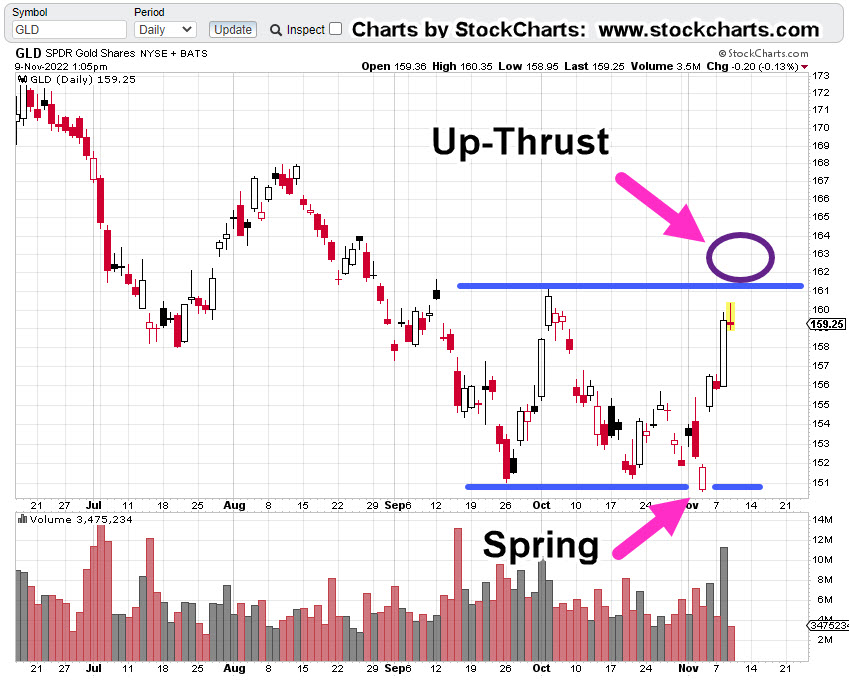
The market is still sub-dividing lower, lower highs, lower lows. Price action’s retraced to a Fibonacci 38% (shown below), and is also in Wyckoff up-thrust (reversal) position.

We’ll get closer-in with the details.

Moving averages have been removed for clarity.

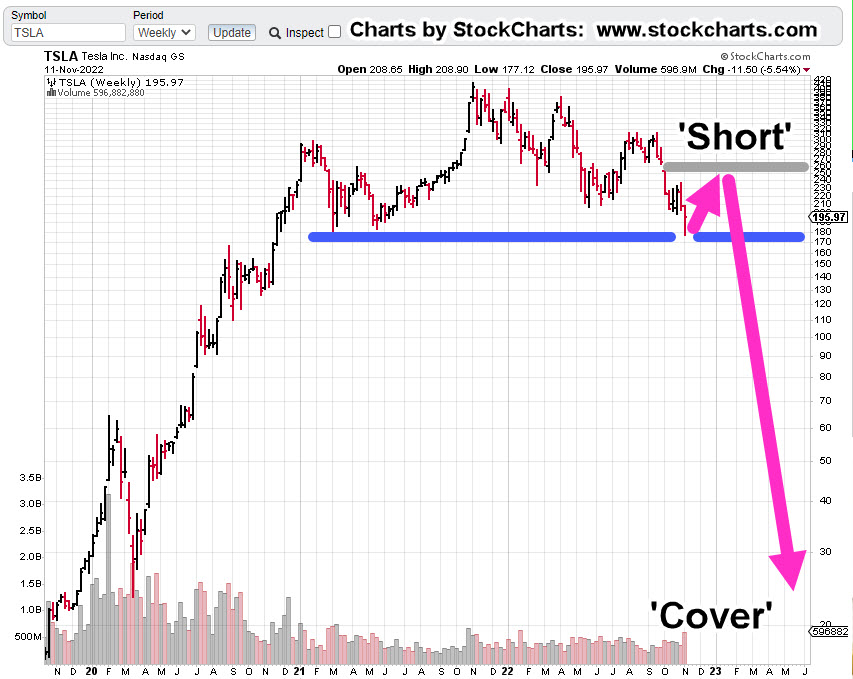
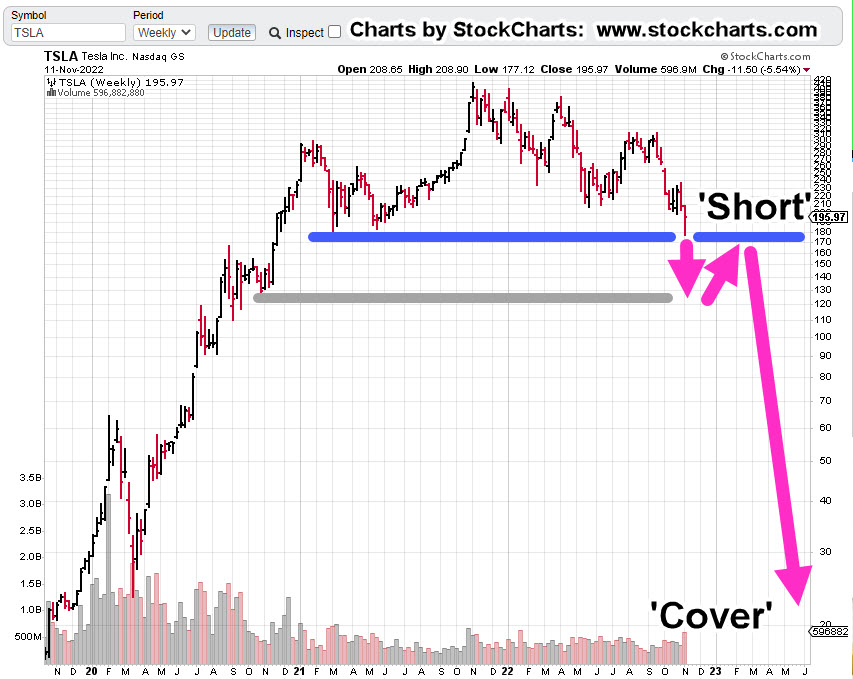
The blue line is the resistance and up-thrust area. Price action clearly above and apparently, hesitating.

Dashed grey line is the Fibonacci 38% retrace from all-time highs (1/4/22), to the most recent lows set on 10/13/22.

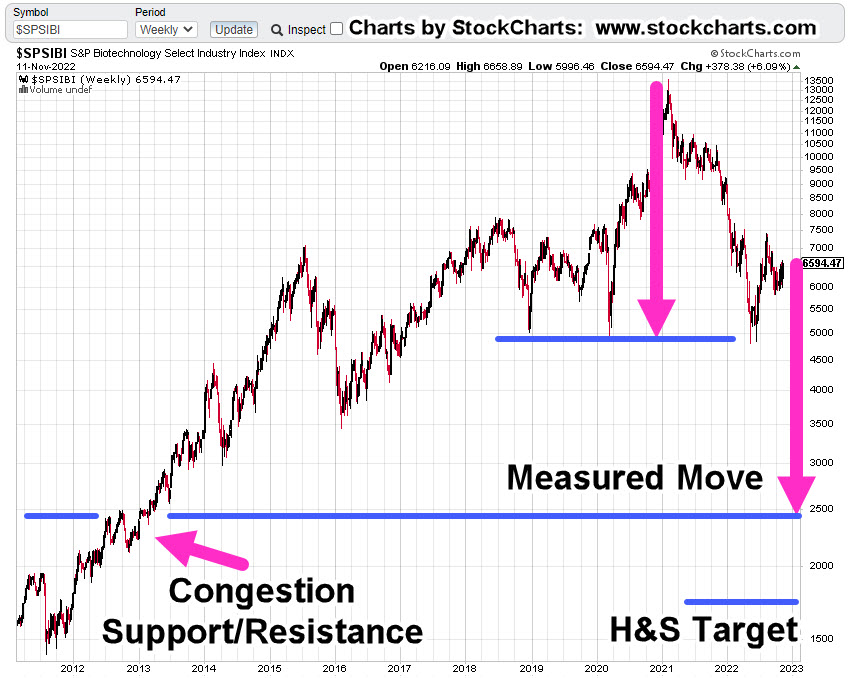
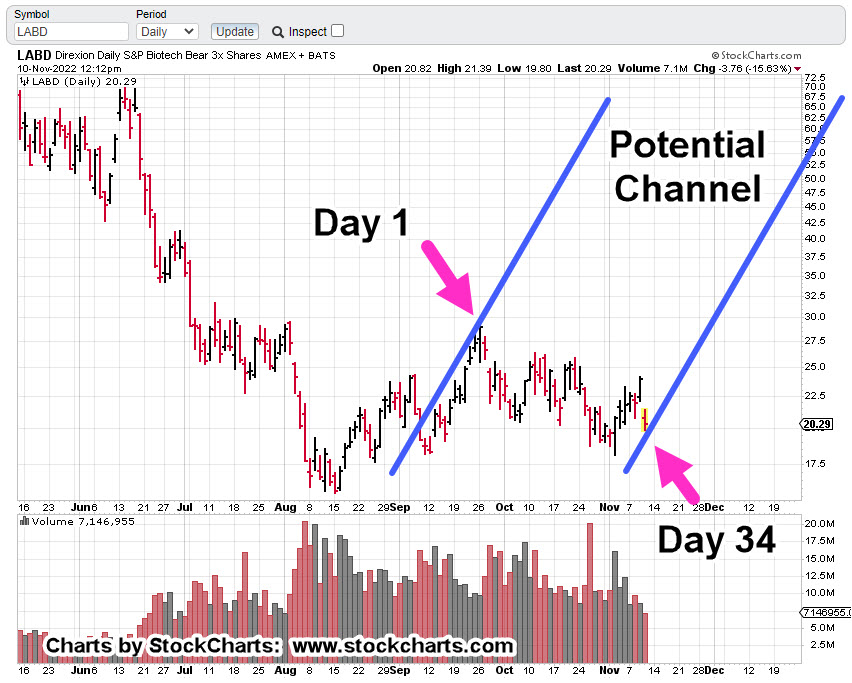
Zooming back out, is the scariest part of this chart.

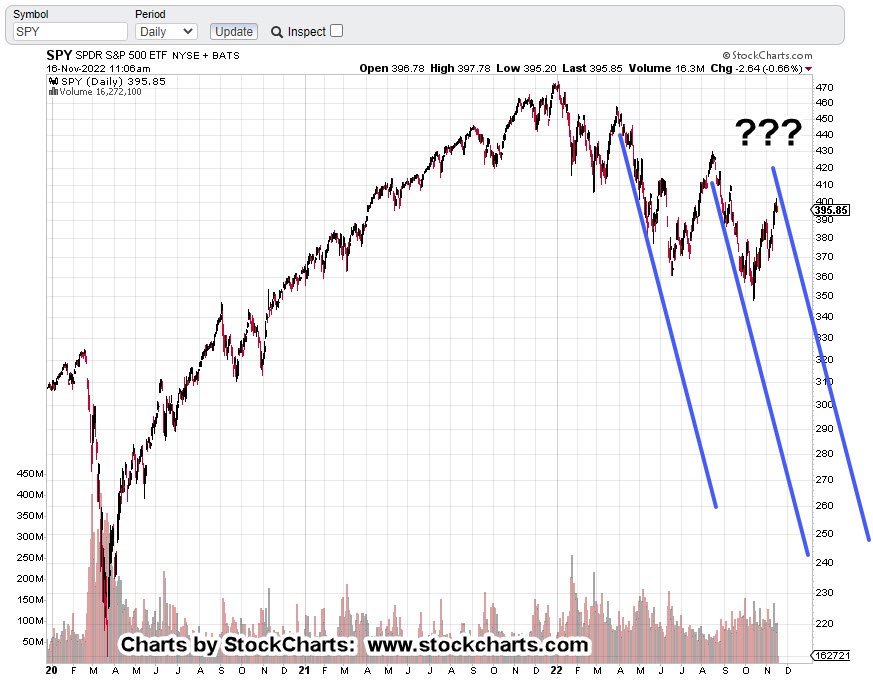
There’s no doubt; we’ve had at least two repeating trendlines. A third could make it a trading channel.

Summary

As of this post (11:28 a.m., EST), SPY has yet to post a new daily low (below SPY, 394.49). If or when it does, that’s just one more addition to the bearish scenario.

Positions: (courtesy only, not advice).

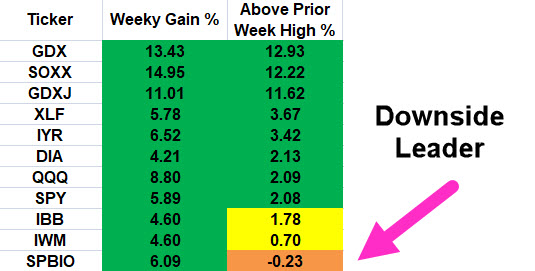
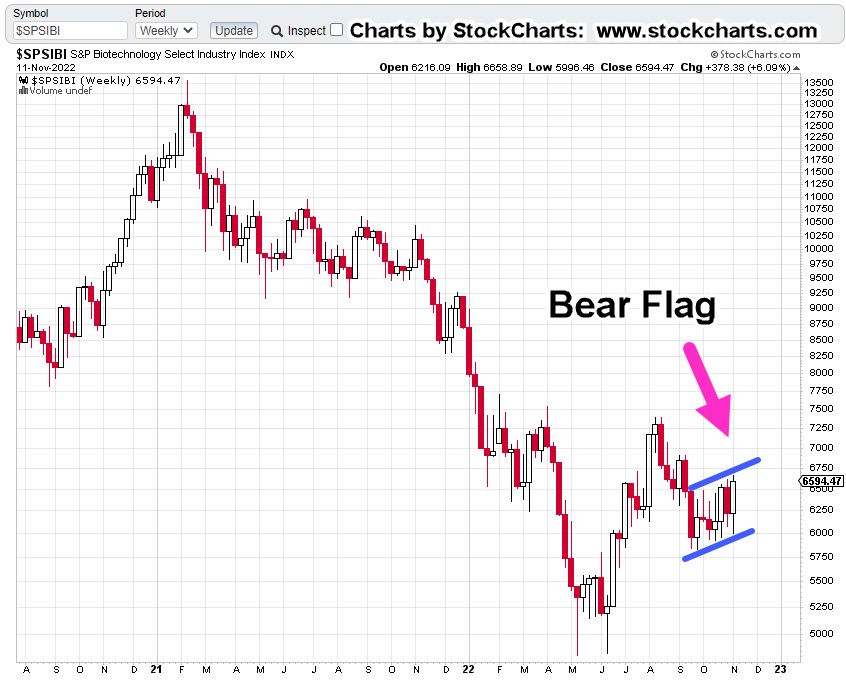
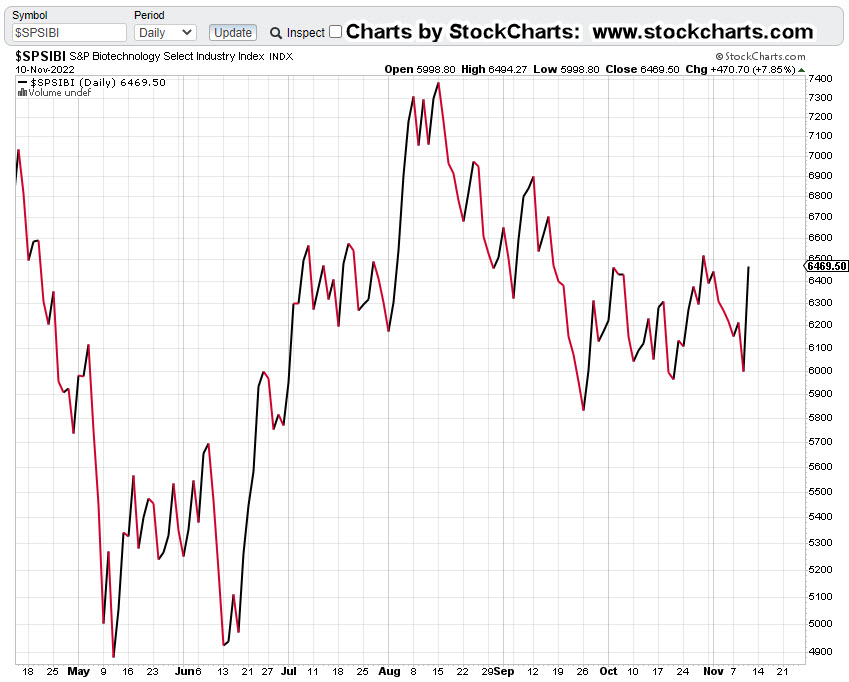
The focus is on biotech; uniquely positioned as the weakest of all the major indices (not advice, not a recommendation).

LABD-22-10:

Entry @ 18.1398, 17.565, 17.65, 18.1594***: Stop @ 16.29***

***, Indicates change

Stay Tuned

Charts by StockCharts

Note:  Posts on this site are for education purposes only.  They provide one firm’s insight on the markets.  Not investment advice.  See additional disclaimer here.

The Danger Point®, trade mark: No. 6,505,279

The Dominos Fall …

Cash Crunch, Layoffs & Bankruptcy

So, here we are.

Crypto FTX implodes, Amazon to lay-off 10,000, Health system(s) in cash crunch, solar farm Toucan Energy, goes bankrupt.

But wait, it gets better; Pfizer and Moderna, are going to investigate themselves.

All of this, just within the past few days.

At this point, it should be clear to all paying attention, we’re accelerating to the downside … at least in economic terms.

Market Disconnect

Yet, the markets appear to never-mind … going about their (manipulated) business as if nothing’s happening.

Walmart has even announced they are going to buy-back their own stock to the tune of $20-Billion.

Maybe, they’ll do it. Maybe, they won’t.

They fully admit (in the press release), the buy-back announcement, was to make sure the earnings report was ‘well received’.

The Next ‘Shoe’

Those of us ‘awake’, are collectively attempting to plan and position for the next shoe to drop.

We’ve got the usual suspects such as real estate and biotech; however, this link to The Burning Platform, could provide more potential catalysts.

Either way, disconnected market or not, one has the feeling it’s just a matter of time.

Life After The ‘Short Squeeze’

‘The shorts were carried out on stretchers’.

Well, yes and no.

As said in this update, the historic short-squeeze, while damaging to account P/L, was a huge public service.

This chart confirms the majority of short-positions have evaporated. Meaning, the potential fuel for relentless upside (from those shorts), is no longer there.

That fact is being mirrored in price action as we speak.

As covered above, two markets are hanging by a thread: biotech and real estate.

Both are bubbles on a world-wide scale, but biotech is the one that may affect all others.

Biotech SPBIO, Inverse LABD

As this post was being created, biotech leveraged inverse fund LABD, has just printed (as of 12:40 p.m., EST) outside-up; also known as a ‘key reversal’.

The daily chart is below.

LABD, Daily

To make it an official outside up, price action will need to close above yesterday’s close (LABD: 17.87).

We’ve already shown that SPBIO, price action has formed a huge bear flag lasting more than eight weeks.

Action from the past three days can be considered a Wyckoff up-thrust as well.

Now, we have a potential key reversal.

If so, this market may be in serious downside trouble.

Positions: (courtesy only, not advice).

Yesterday, JDST-22-05, was exited at 9.0341, with a loss of – 1.45%, so that focus (and capital) could be directed to biotech, SPBIO and inverse LABD (not advice, not a recommendation).

LABD-22-10:

Entry @ 18.1398, 17.565***, 17.65***: Stop @ 16.29***

***, Indicates change

Stay Tuned

Charts by StockCharts

Note:  Posts on this site are for education purposes only.  They provide one firm’s insight on the markets.  Not investment advice.  See additional disclaimer here.

The Danger Point®, trade mark: No. 6,505,279

Crypto Contagion …”Contained”

Where Have We Heard That, Before ?

Is the Genie out of the bottle?

For those who weren’t around for the last melt-down, here’s a brief refresher; links here and here … enjoy.

Of course, the amount of real damage and interconnecting links, are not yet fully known … data is still forthcoming.

However, the backpedaling has already started … ‘Let’s rebuild‘.

How about, ‘Let’s get real.’

As Michael Cowan has said: ‘This is like Lehman, but for Crypto’ … ‘Over $2-Trillion has been destroyed, just like that!’

We’re still in the destruction phase. Any ‘rebuilding’ whatever that means, is probably years down the road.

Those In The Know

Wyckoff said a century ago: ‘Somebody always knows something, and that ‘something’ shows up on the tape’.

This is where understanding price action is critical.

We in the Serfdom, won’t know the details until long after the big players have cashed out or have been bailed out.

Why would it be any different than last time?

However, their moves will show up on the tape. That will provide clues on how or where to take action (not advice, not a recommendation).

The Elephant

All of this is happening on top of there being an elephant.

For those who somehow still don’t know what’s going on, here’s just one report, among many.

Positions: (courtesy only, not advice).

It’s just after the open (9:40 a.m., EST) and both positions listed below, have opened higher.

LABD-22-10:

Entry @ 18.1398: Stop @ 16.83

JDST-22-05

Entry @ 9.1666: Stop @ 8.79

Note: Positions may be increased, decreased, entered, or exited at any time.

***, Indicates change

Stay Tuned

Charts by StockCharts

Note:  Posts on this site are for education purposes only.  They provide one firm’s insight on the markets.  Not investment advice.  See additional disclaimer here.

The Danger Point®, trade mark: No. 6,505,279

The Market Set-Up … This Week

What To Watch … Crypto Collapse, Biotech, Gold, Telsa

JPMorgan … says sell

Goldman … says buy.

Wyckoff says … Don’t listen to either.

In fact, Wyckoff’s stock market training course, first published in 1934, (still available), says that until you can ignore the financial press completely, ‘You will never be successful in the markets’.

Price action itself, properly interpreted, will tell you where to look for the opportunity.

The Ponzi Implosion, Cometh

The market is littered with Ponzi schemes. Some have already imploded, CVNA, HOOD, Crypto; some have not.

Concerning Crypto, here’s an excellent update from Michael Cowan. Buried in that update, at time stamp 4:58, looks like HOOD, may be in even more trouble.

Biotech is in a class of its own and was discussed in yesterday’s update.

For gold, we’re going to look at the Junior Miners GDXJ, and last week’s action.

Junior Miners GDXJ, Daily Close

The Junior’s are the weakest in the sector; therefore, that’s where we look for a short opportunity (not advice, not a recommendation).

To move higher, above resistance, normal market behavior, is to come back to the lower blue line (i.e., support) to gain enough energy to move higher for a breakout.

To move lower, normal market behavior, is to come down to the lower blue line as a test which subsequently fails; the move continues lower.

Either way, normal behavior at this juncture, is to move lower. We’ll see.

Now on to the chief cook and bottle washer … Tesla.

Tesla (TSLA), At The Edge

For starters, let’s recognize there’re a lot of moving parts; U.S. ‘parts’ and China ‘parts’.

If one’s going short, another task is to forecast under what conditions a short would have enough risk removed.

For that answer, oddly enough, we go to gold, GLD.

Gold GLD, Weekly: 2015 – 2017

GLD posted a massive upthrust above the blue line lasting over fourteen weeks before breaking decisively lower.

Then, it labored four weeks to come back up for a test.

After that, collapse; lower weekly closes for seven consecutive weeks.

In the chart above, the area identified as ‘Short’, has as much upside risk removed as possible, right at resistance.

Now on to Tesla.

Tesla TLSA, Weekly

Two scenarios are presented where risk may be reduced.

Chart 1

Chart 2

One of these may happen or neither of them.

Either way, for risk to be reduced, a short entry is needed to be at a known resistance level (not advice, not a recommendation).

Let’s move on to the current positioning.

Positions: (courtesy only, not advice).

One of three events will happen at the next session.

1: Both positions stopped out

2: One position stopped out

3: No positions stopped out

Each outcome will provide a data-point where to focus (or not) in the current environment.

LABD-22-10:

Entry @ 18.1398: Stop @ 16.83

JDST-22-05

Entry @ 9.1666: Stop @ 8.79

Note: Positions may be increased, decreased, entered, or exited at any time.

***, Indicates change

Stay Tuned

Charts by StockCharts

Note:  Posts on this site are for education purposes only.  They provide one firm’s insight on the markets.  Not investment advice.  See additional disclaimer here.

The Danger Point®, trade mark: No. 6,505,279

The Largest ‘Squeeze’, Ever

A Market Of Extremes

So, this is how it’s going to be.

The market itself is telling us it’s not going to be ‘well behaved’, possibly for years to come.

According to Goldman, link here, we’ve just had the largest short squeeze on record.

Friday, must have pushed it over the edge from the previously reported, ‘third largest‘.

The ‘Pontificators’

Everybody think’s they’ve got it figured out; We’re going to have stagflation, no wait, hyperinflation, no wait, inflation/deflation simultaneously, no wait, dollar collapse, no wait, gold to the moon, no wait, and on it goes.

What we really have, which is obvious to those ‘awake‘, is something that’s never happened before.

That ‘something‘ is here every day, multiple times a day.

Flash Crash, 2010

Every so often just as a reminder, this event is posted as an example; until that day, it never happened before either.

“Paper comes in, a big seller!!!”

 ‘Paper’ is essentially anyone (banks, hedge-funds, institutions, and/or retail) outside the pit.  Those in the pit are called ‘locals’.

Positioned At The Extreme

The largest short squeeze in history has actually performed a public service; the markets are at extremes.

With that, the short position in Junior Miners GDXJ, has already been discussed, link here.

We’re going to move on and talk about the elephant; more specifically, biotech SPBIO.

Biotech SPBIO

The table shows last week’s action when compared to the week prior. All major sectors had solid gains but it’s the right-most column that’s of interest.

The right-side column shows how far price action closed above the prior week’s high.

Once again, biotech shows overall weakness. It gets more interesting when looking at the weekly chart.

Biotech SPBIO, Weekly

It’s been three successive weeks of apparent up-thrust reversals that were negated each time.

Looking at the weekly below, what we have, is a huge bear flag that just so happens to be, Fibonacci 8-Weeks wide.

It’s possible, this congestion area is the mid-point of the overall move from the highs set during the week of February, 2021.

Compressing the chart and putting in a measured move target gives us the following.

If we have an actual Head & Shoulders top, that target is shown as well.

Either way, the downside potential is enormous; thus, requiring intense focus from a Wyckoff standpoint, i.e., during a bear market, identify the weakest sector for short opportunities (not advice, not a recommendation).

All of which brings us to positioning.

Positioning

On Friday, a discretionary exit was made from the entire LABD-22-09 position as (LABD) price action continued to decline with no end in sight.

Loss on the LABD-22-09, series was a drubbing of -12.2%

Then again, last week was the largest squeeze in history; taking that into account, the loss wasn’t -30% or -50%.

As the trading day progressed, LABD price action continued lower until low-and-behold, it reversed.

Once again, a position was entered (not advice, not a recommendation) but this time was different. Frist off, initial position size is smaller; about 60% smaller.

Secondly, the stop is an actual order that’s in the market (shown below).

Sounds obvious but we’re dealing with unprecedented times and market disruptions. Recall during the Flash-Crash of 2010, Kimberly Clark, or Colgate (if memory serves) went ‘no-bid’ and printed i.e., sold for 0.01.

That low print remained on the charts for years until it was ultimately removed.

If it can happen on the downside (i.e. when long), it can happen on the upside as well (when short).

Positions: (courtesy only, not advice).

LABD-22-10***:

Entry @ 18.1398***: Stop @ 16.83***

JDST-22-05***

Entry @ 9.1666***: Stop @ 8.79***

Note: Positions may be increased, decreased, entered, or exited at any time.

***, Indicates change

Stay Tuned

Charts by StockCharts

Note:  Posts on this site are for education purposes only.  They provide one firm’s insight on the markets.  Not investment advice.  See additional disclaimer here.

The Danger Point®, trade mark: No. 6,505,279

The Day After

Marginal New Highs

The day after the third largest short squeeze in market history, we have marginal new daily highs.

Gold was one of the markets that made news this week with it ‘leaving the station’. 🙂

Let’s take a look at gold (GLD) and how I used its message to position short (not advice, not a recommendation).

Gold (GLD) Daily

First, we’re going to re-print the original analysis below from November 4th.

And now, the result

We’re right at the edge. Any higher and it could be bona fide breakout.

The miners rallied in kind.

Senior Miners, GDX, is in an up-thrust of its own (not shown) along with the Juniors GDXJ; being a weaker sector it’s extended but not able to push as high as GDX.

Junior Miners GDXJ, Daily

Note the black line and arrow.

Seniors, GDX, was able to penetrate this area on its own chart but GDXJ, has not (so far).

This gives us an extra layer of resistance for a short position (not advice, not a recommendation).

We can add to that as noted, it was the third largest squeeze in history and today was slightly higher … so what else is there? Risk has (nearly) been squeezed out.

About an hour after the open, a short was opened using GDXJ leveraged inverse fund JDST; JDST-22-05.

Position details and stop locations are to be provided in the next update.

Stay Tuned

Charts by StockCharts

Note:  Posts on this site are for education purposes only.  They provide one firm’s insight on the markets.  Not investment advice.  See additional disclaimer here.

The Danger Point®, trade mark: No. 6,505,279

Short Squeeze … 3rd Largest, Ever

Is It Over?

ZeroHedge reports, the third largest ever.

So, is it over?

Starting tomorrow, we’re about to find out.

When looking at biotech sector (SPBIO) on a close basis, today’s action stopped just short of making a new closing high since the up-thrust (reversal) of October 28th.

Effectively, it’s a test of that reversal.

On to the analysis.

SPBIO, Daily Close

We’re going to put the chart below with no mark-up; then invert to show the potential trade set-up.

SPBIO, Daily Close, Inverted

Now, we’re inverted and marked to show penetration below support and then, today’s test.

The zoom gets closer-in.

The market is stretched, no doubt.

In a way, it’s a good thing. Either the test will hold and SPBIO, will decline from here (in earnest) or there’s something else going on and we’ll exit to look for another trade (not advice, not a recommendation).

Positions, Market Stance (courtesy only, not advice).

LABD-22-09:

As stated, in the prior update, LABD-22-09, position size was reduced during the session by about 10%.

Special Note:

This sector and leveraged inverse LABD are highly volatile. Character of the market can change at any time.

LABD may be exited without notice.

Entry @ 19.88, 19.71, 21.23, 21.65, 22.16, 22.75 Stop @ TBD***

Note: Positions may be increased, decreased, entered, or exited at any time.

***, Indicates change

Stay Tuned

Charts by StockCharts

Note:  Posts on this site are for education purposes only.  They provide one firm’s insight on the markets.  Not investment advice.  See additional disclaimer here.

The Danger Point®, trade mark: No. 6,505,279

The Biotech (Short) Test

Proverbial ‘Gut-Check’

It looks bad for being short biotech and maybe it is.

However, as we’ll see below, the leveraged inverse fund LABD, could be completing its reversal set-up.

While today’s thrust higher in the overall markets was not unexpected (shown here and here), one should take note of the violence.

As of this post, from yesterday’s low to today’s high, the Dow has moved over 1,000-pts.

It’s what happens next that’s important.

Weak shorts are probably terrified, have covered, now wondering what went wrong.

So, let’s take a look at the short position on biotech SPBIO, and see if it really is ‘wrong’ (not advice, not a recommendation).

SPBIO, Leveraged Inverse Fund LABD, Daily

What we can see (above) is that LABD, is following the Wyckoff Schematic near exact for a spring set-up.

It’s just that today’s move is especially sharp and so one would think the set-up has failed … not so fast.

Another reason to think we’re completing a test of the spring, is below. Today is Fibonacci Day 34, from the high (low on SPBIO), set on September 26th.

We also have a potential trading channel as well.

As this post is being created, LABD is hovering at its lows; currently (as of 1:30 p.m., EST) trading at 19.89

Summary

Yesterday was an important day but it was not obvious, and not (yet) directly related to the markets.

A report was released on ZeroHedge (link here) which essentially confirms what some of us in the proletariat have known for years … if not decades.

It’s now out in the mainstream.

How long before the ‘elephant’ makes its way there also?

If indeed we’re at a reversal test of biotech and if that test passes (SPBIO downside continues), the move has the potential to be historic.

Positions, Market Stance (courtesy only, not advice).

LABD-22-09:

Price action blew through the stop located at 20.21 and is now hovering at those levels. The LABD position is being maintained but will likely be reduced in size as we head into the close (not advice, not a recommendation).

Special Note:

This sector and leveraged inverse LABD are highly volatile. Character of the market can change at any time.

LABD may be exited without notice.

Entry @ 19.88, 19.71, 21.23, 21.65, 22.16, 22.75 Stop @ 20.21

Note: Positions may be increased, decreased, entered, or exited at any time.

***, Indicates change

Stay Tuned

Charts by StockCharts

Note:  Posts on this site are for education purposes only.  They provide one firm’s insight on the markets.  Not investment advice.  See additional disclaimer here.

The Danger Point®, trade mark: No. 6,505,279

Gold Leaves The Station … Again

How Many Times?

How many times does gold need to ‘leave the station‘, before it’s actually left?

That’s probably a better question to ask rather than freaking out every time there’s a blip higher.

Was the recent ‘blip’ tradeable? Yes.

Is the move sustainable to the upside … probably not but only price action will tell.

Did Wyckoff analysis give advance notice that gold (GLD), could move higher?

Yes, it did … link here and here.

That first link even shows how far GLD, is likely to go, which at this point, is just ticks away.

Gold GLD, Daily

We’ll start first with the original forecast.

And the result (as of 1:20 p.m., EST).

We can see price action nearing the up-thrust (reversal) location.

Note: Penetration to the upside above resistance, does not necessarily mean it’s a short opportunity.

Any opportunity will be determined by price action itself.

Summary

Wyckoff analysis not only can provide potentials for price movement; when that move happens, it can also be a stabilizing factor so that one is not caught up in the usual media hysteria.

Meanwhile, back at the ranch, biotech sector (SPBIO) is still on track (ever so slowly) for a potential sustained move to the downside (not advice, not a recommendation).

Positions, Market Stance (courtesy only, not advice).

LABD-22-09:

Special Note:

This sector and leveraged inverse LABD are highly volatile. Character of the market can change at any time.

LABD may be exited without notice.

Entry @ 19.88, 19.71, 21.23, 21.65, 22.16, 22.75*** Stop @ 20.21

Note: Positions may be increased, decreased, entered, or exited at any time.

***, Indicates change

Stay Tuned

Charts by StockCharts

Note:  Posts on this site are for education purposes only.  They provide one firm’s insight on the markets.  Not investment advice.  See additional disclaimer here.

The Danger Point®, trade mark: No. 6,505,279

‘No One In Control … ‘

Um, Yes There Is …

The latest from ZeroHedge is, ‘there’s no one in control.’

The latest from Wyckoff analysis is, ‘price action’s in control’, if you know where to look. 🙂

This week’s watch-list was laid out two days ago, here and so far, all topics discussed, are preforming as expected.

For this update (30-minutes before open) we’re going to focus on Tesla (TSLA).

Tesla, TSLA, Daily

There’s a lot going on.

We’re not in the ‘free-fall’ zone yet, but it’s getting close.

Downside volume has increased significantly.

The channel is being confirmed but we’re nearing support in the 188.00 – area (not shown).

Remember, when price action declines below known support levels, depending on the depth of penetration, we could be in Wyckoff spring position.

There could be an upside response to the break below current support located at approx. 198 – 200.

Summary

Q: Is TLSA, a short?

A: That’s at the trader’s discretion (not advice, not a recommendation).

My firm’s accounts do not have a position in TSLA … and if/when they do, it would likely be small.

It’s true the EV hysteria is a bubble. Supply chain collpase will make sure of that.

However, it does not even compare to the ‘elephant’, and we all know what that is.

Positions, Market Stance (courtesy only, not advice).

LABD-22-09:

Special Note:

This sector and leveraged inverse LABD are highly volatile. Character of the market can change at any time.

LABD may be exited without notice.

Entry @ 19.88, 19.71, 21.23, 21.65, 22.16*** Stop @ 20.21***

Note: Positions may be increased, decreased, entered, or exited at any time.

***, Indicates change

Stay Tuned

Charts by StockCharts

Note:  Posts on this site are for education purposes only.  They provide one firm’s insight on the markets.  Not investment advice.  See additional disclaimer here.

The Danger Point®, trade mark: No. 6,505,279