Basic Materials, Building Blocks

Infrastructure … Not Going To Happen

The infrastructure bill, right along with any kind of sustainable ‘recovery’ is just not in the charts.

Sure, the bill passed into ‘law’, if you can call it that; however, law and action are two different things.

We’ll get into more fundamentals behind why it’s not happening in tomorrow’s Random Notes … to be released later in the day.

One hint on why we’re not getting a major U.S. wide building program, there won’t be the manpower or supplies available … each for their own reasons.

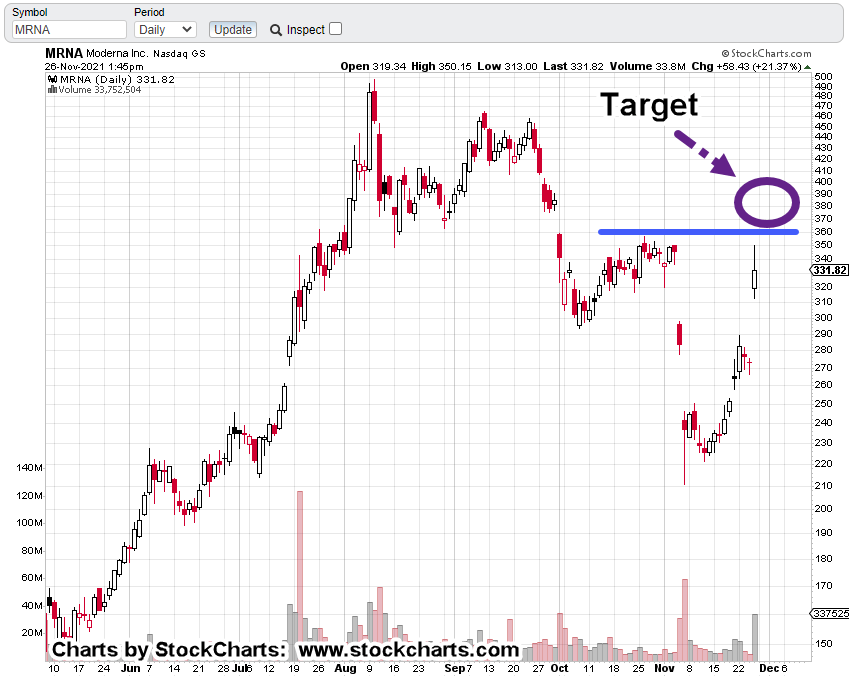
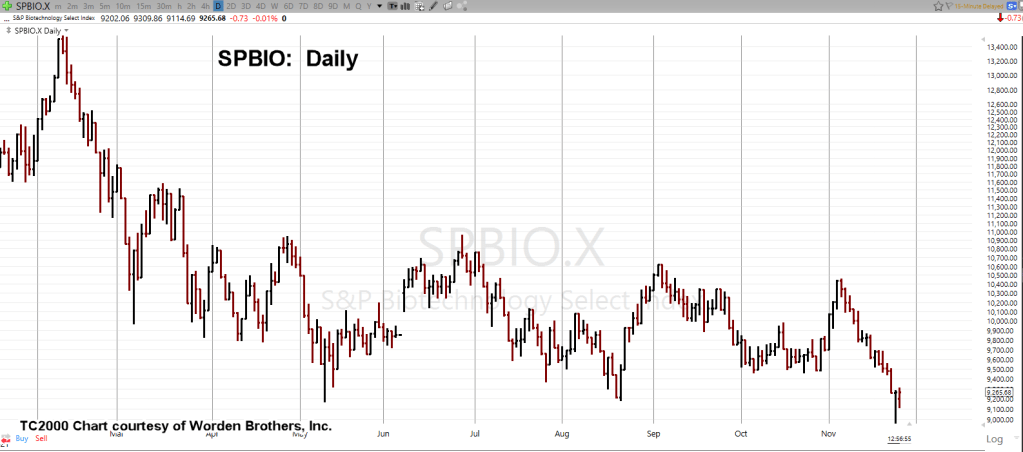
That brings us to the chart of the sector.

DJUSBM

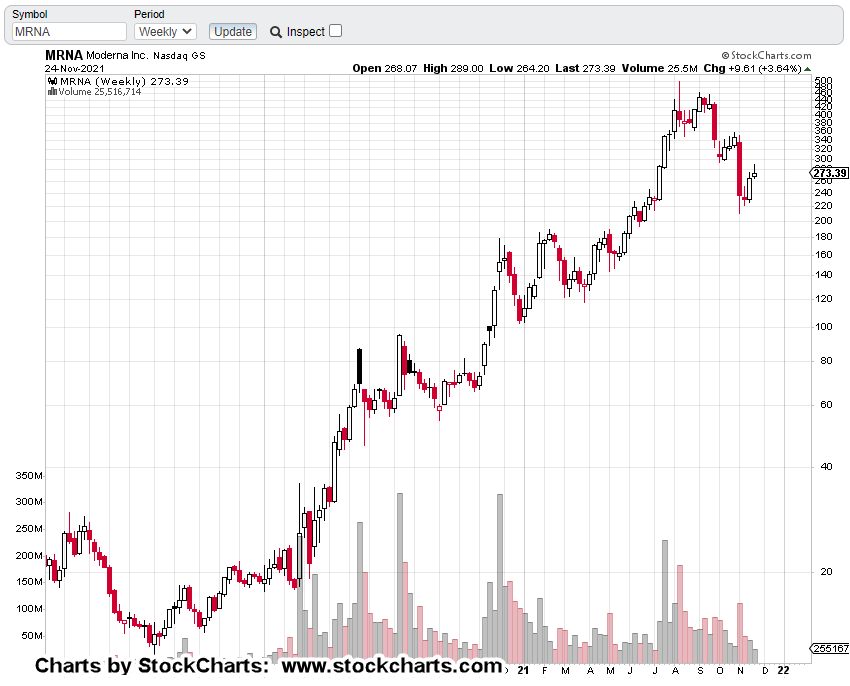
The weekly chart shows how it looks going all the way back to early 2008.

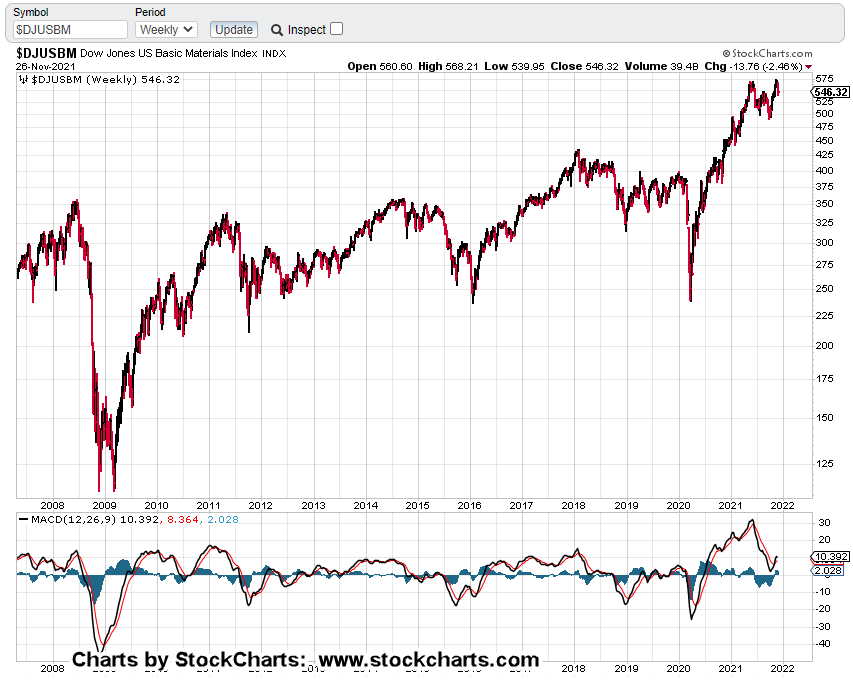
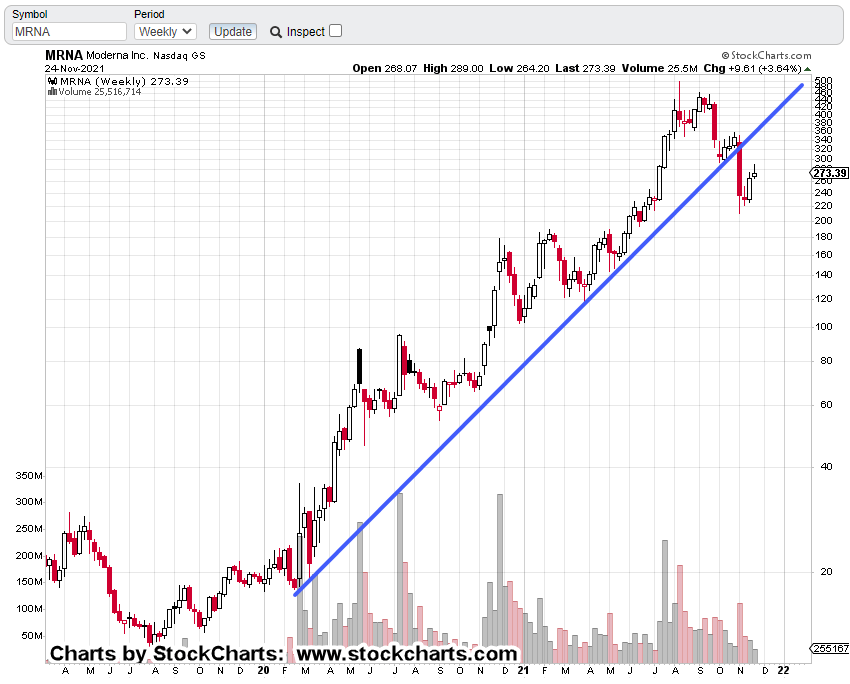
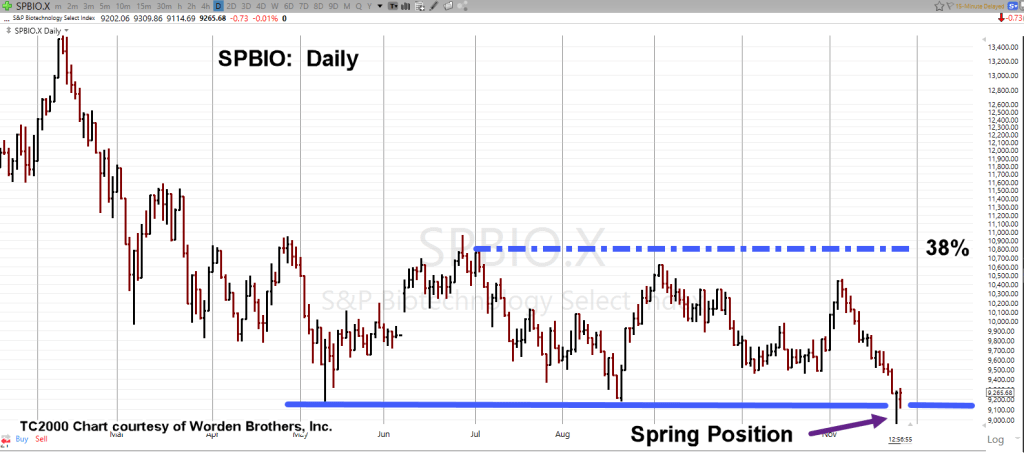
If you did not immediately pick up on the right side’s message, it’s highlighted below … a massive bearish MACD divergence.

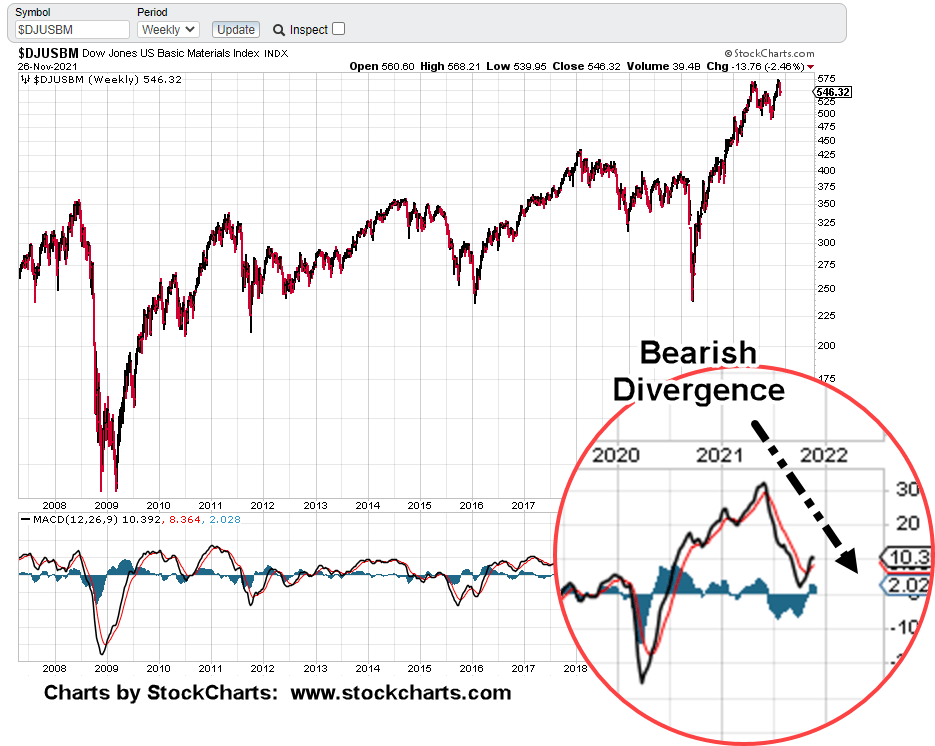
The divergence proposes that upside momentum for the sector is all but spent.

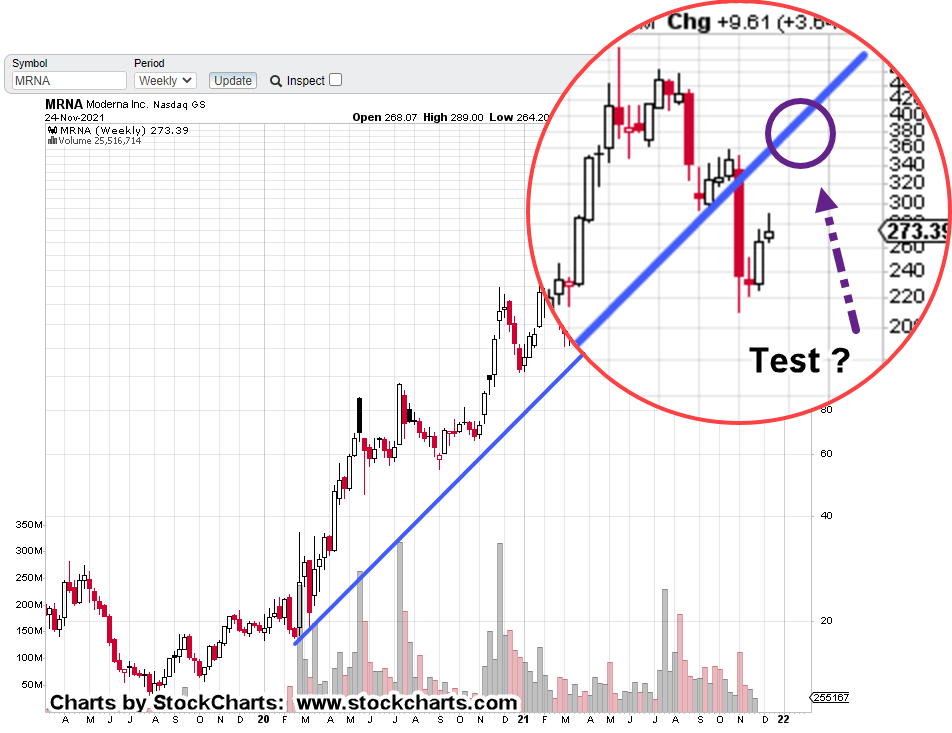
Let’s take a look at previous downside action and the current possibility.

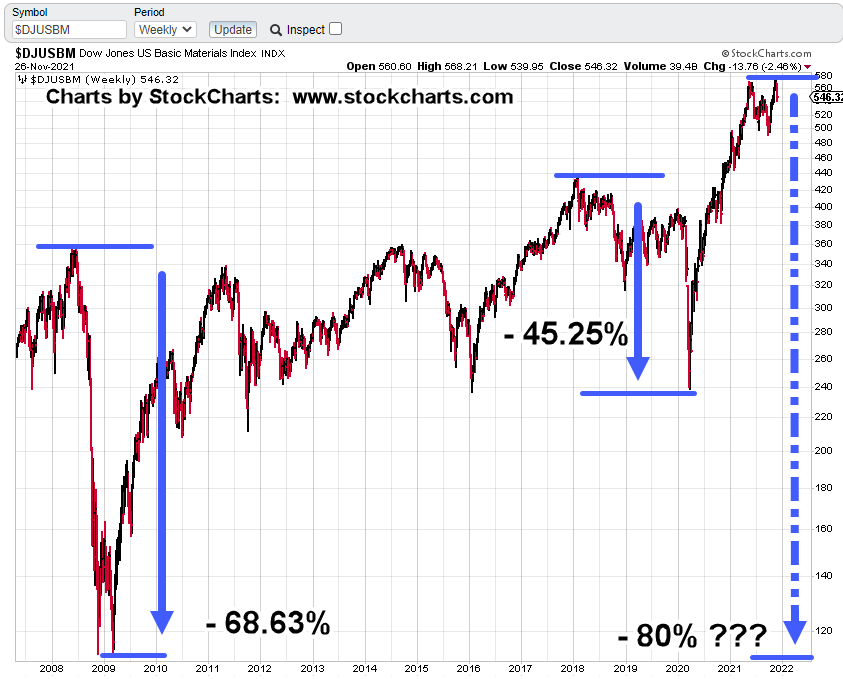
Anybody that’s awake will not argue the current situation’s worse than 2007 – 2008.

If that’s the case, and if the market’s still alive at the bottom, DJUSBM could get as low, or lower than 2008 – 2009, levels.

A decline over 80%, is not uncommon for a bear/depression market. The Dow Jones 30, from top-to-bottom, during the Great Depression was around – 84%.

Inverse Fund, SMN

SMN is -2X inverse the DJSUBM.

However, this fund is not like inverse ETFs; SDS, DXD, SOXS, QID, DUST, and so on.

Basic Materials is not ‘popular’. At least, not yet.

That means the fund is illiquid with larger spreads (bid/ask). In addition, it takes a good few minutes after each open for those spreads to calm down and narrow up.

It’s not for the inexperienced.

Summary:

As we’ll get into tomorrow, ‘normal’, is gone.

There’s not going to be ‘normal’ (a personal opinion) in the lifetimes of anyone reading these updates.

That doesn’t mean there are no opportunities.

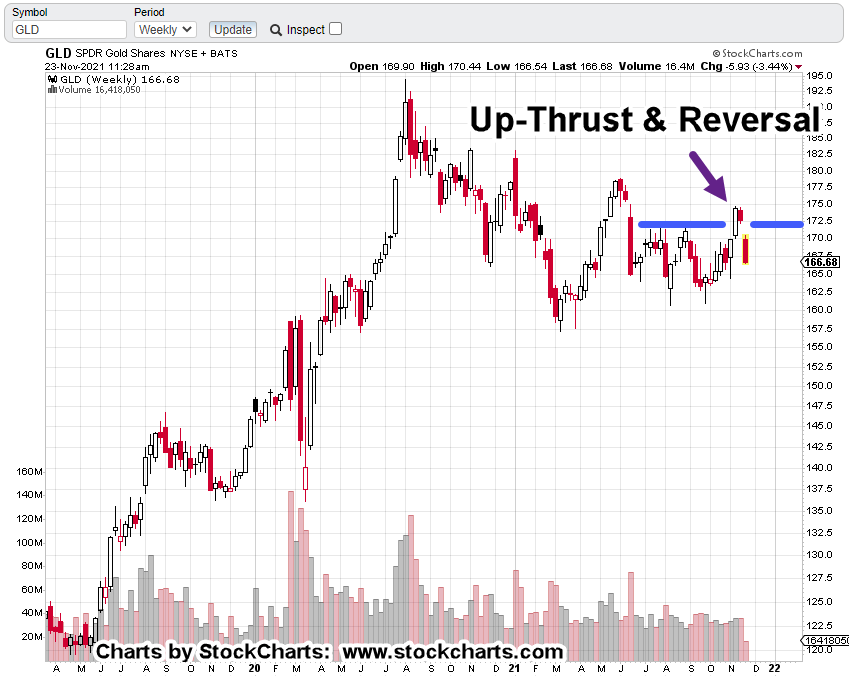
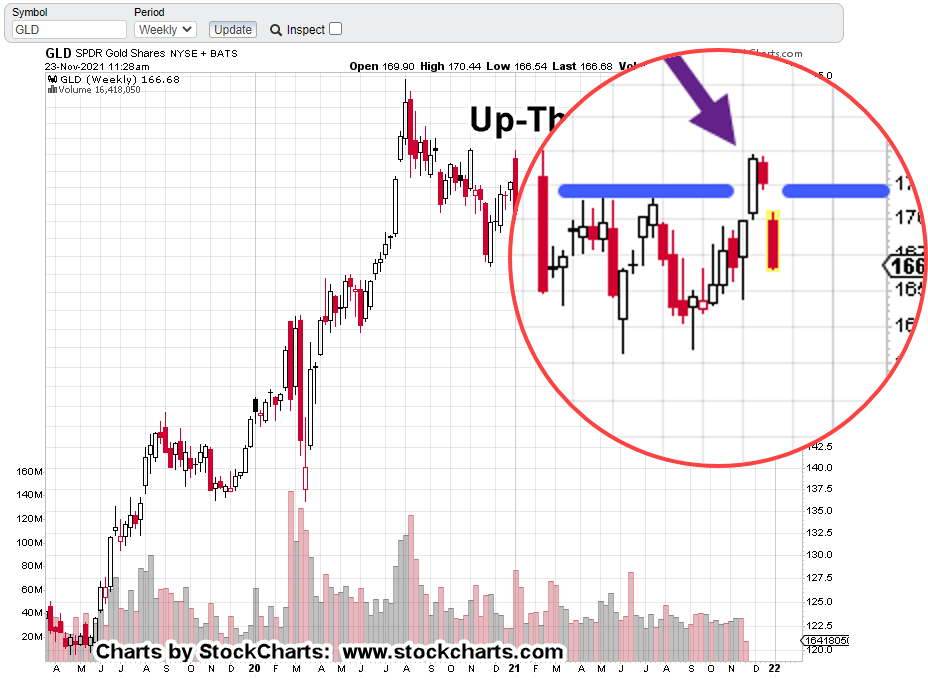
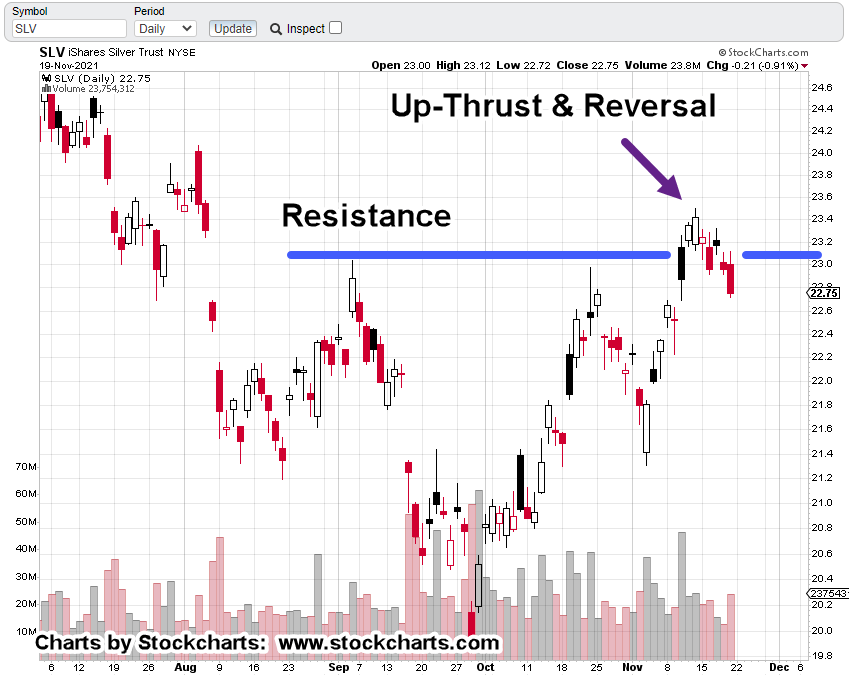
Basic Materials, DJUSBM, is about to, or already has (potentially) started its downside reversal.

Stay Tuned

Charts by StockCharts

Note:  Posts on this site are for education purposes only.  They provide one firm’s insight on the markets.  Not investment advice.  See additional disclaimer here.

The Danger Point®, trade mark: No. 6,505,279

… Cue The ‘Hype’

Right On Schedule … A New ‘Variant’

Seems like just yesterday, we were saying:

“There’s all kinds of nastiness in the guise of ‘new strains’ out there; likely to raise their heads before Christmas and probably after as well.”

Wait, … that really was, yesterday.

So, now we have the ‘Nu variant’.

Get it? A, new variant. 🙂

The ‘Epsilon’ variant (from the idiot in Brave New World) is probably being saved for last … because if anyone’s still believing the hype by that time, it won’t matter … they’ll be fully ‘boosted’.

That doesn’t mean the pros can’t make money off the herd … while there still is a herd.

Which brings us to today’s underside test action of MRNA.

Moderna (MRNA):

Well, that retrace was quick.

First, let’s show yesterday’s weekly chart.

And now, today’s

It’s true that price action is testing the underside.

However, if we go to the daily chart (below), we can see if price action can make it just a bit higher … to the 360 – 380 area, then we have an up-thrust (potential reversal) condition.

The chart looks similar to our gold (GLD) up-thrust target, linked here for reference.

Recall, for that set-up, it took two months for GLD, to penetrate resistance … and then go into a vicious reversal.

Stay Tuned

Charts by StockCharts

Note:  Posts on this site are for education purposes only.  They provide one firm’s insight on the markets.  Not investment advice.  See additional disclaimer here.

The Danger Point®, trade mark: No. 6,505,279

Tech Talk, Moderna (MRNA)

Underside Test

Even though scenes like this one, this one and this one, are now common, the mainstream still seems to be ‘mystified’ as to the cause.

With all that happening as we speak, Moderna (MRNA) is finding itself potentially rising to test the underside of its trend line break.

Moderna (MRNA):

Weekly un-marked chart

Marked up with trendline break

Zoom in, of potential underside test area.

Summary:

Markets like to test … it’s what they do.

Sometimes, as with the gold hysteria, there’s a story to go along with the action. All intended to herd the easily led into the wrong side of the trade.

So, it could be with MRNA.

There’s all kinds of nastiness in the guise of ‘new strains’ out there; likely to raise their heads before Christmas and probably after as well.

These events may coincide with the previous post about biotech possibly heading for retrace and up-thrust.

Stay Tuned

Charts by StockCharts

Note:  Posts on this site are for education purposes only.  They provide one firm’s insight on the markets.  Not investment advice.  See additional disclaimer here.

The Danger Point®, trade mark: No. 6,505,279

Biotech, At The Danger Point

In More Ways Than One

For now, we’ll discuss only the technical aspects.

We’ll leave the rest of the truth for mainstream news.

Discussed previously, the sector (SPBIO) was left with our assessment that it may reverse higher into a retrace; combined with an up-thrust/reversal.

That was then.

Biotech, SPBIO, Now:

Daily un-marked chart of SPBIO:

Below, a marked-up chart showing penetration and move off support (Spring Condition).

Included, is the 38% retrace level … location for potential test and reversal:

As with the on-going reversal in gold (GLD) and the miners, GDX, GDXJ, we’ll have to see how this plays out.

Unfortunately, as we head into what used to be the regular flu season, those who received ‘protection’, are going to find out they’re not protected at all.

Stay Tuned

Note:  Posts on this site are for education purposes only.  They provide one firm’s insight on the markets.  Not investment advice.  See additional disclaimer here.

The Danger Point®, trade mark: No. 6,505,279

The Future’s So Bright …

… I’ve Gotta Raise Rates !

That’s right. The economy’s so good, we’ve got to raise rates.

Well, almost.

First, there’s more aggressive tapering … then we raise rates … honest.

No, this isn’t an MTV video from the ’80s … it’s the Fed life.

The latest update from Steven Van Metre, has comments from the Fed that seem like they’re from another world, another time.

Evidently, the economy’s so strong … so good, that we might taper more aggressively and then … raise rates.

At this point, ‘what difference does it make?’

They’ve probably already cashed-out (like last time) and now stand on the sidelines.

Meanwhile back at the proletariat, we’re deciphering the market’s next moves … Fed press releasees notwithstanding.

Is Gold (GLD) The Black Swan ?

Frist off, there are several YouTuber’s that are providing an excellent service; letting us know the real state of the economy.

They are invaluable; thus, receiving their fair share of hate from those that don’t want to hear, see, or smell, ‘bad news’.

All of them willingly admit, they’re not experts when it comes to the markets … fair enough.

However, in Jerimiah Babe’s latest update, he may have unwittingly revealed a (or the) black swan.

Gold and the gold market.

JB’s offered the anecdote of attempting to purchase more gold at the dealer. For the first time ever, he was limited on the amount available.

From a market standpoint, the public, is all-in.

Even as we speak, gold (GLD) and the miners, GDX, GDXJ, are in a vicious downside reversal.

At this juncture, it looks like an upward test of resistance (discussed yesterday) is nowhere in the cards.

Price action for the most part, is straight down.

Which brings us to the charts.

GLD, Weekly Chart:

Marked up with resistance and the up-thrust reversal.

Zoomed area of the reversal

Personal Opinion:

Because the gold hype by the financial press was so incessant for so long (which by the way, has strangely ‘disappeared’), this reversal may be something that lasts much longer than anyone would expect (not advice, not a recommendation).

Downside Targets:

The weekly GLD chart below has a Fibonacci projection tool overlay.

A 161.8%, projection would take GLD down to 119 – 120.

Are the gold bulls prepared for an extended downside rout in the metals?

Summary:

Early morning food production.

It might not look like it’s connected to the markets but it is.

Market analysis presented on this site, helps steer actions needed to separate from (or reduce reliance on) the system.

Properly executed, trading is one avenue to provide income that’s necessary to eliminate the need for a corporate employer (not advice, not a recommendation).

Market analysis also helps identify what’s likely to come next.

But, I digress.

Getting back to the coop; four eggs a day … equates to over two dozen a week. Reliance on the grocery store (at least for eggs) has effectively been eliminated.

About a year’s worth of feed has been stockpiled.

Let’s put it a little differently; a year’s worth of feed has been ‘stacked’.

Personally, I like gold and silver as much as the next guy.

However, those in charge of this collapse have already stated, food will be used as the leverage weapon.

But hey, we shouldn’t have to worry about any of that, because, ‘The future’s so bright …’

Stay Tuned

Charts by StockCharts

Note:  Posts on this site are for education purposes only.  They provide one firm’s insight on the markets.  Not investment advice.  See additional disclaimer here.

The Danger Point®, trade mark: No. 6,505,279

Gold Bulls, Trapped !

Stunned … Unable To Move

It’s not supposed to be this way.

What about all the ‘money printing’ driving the dollar to extinction?

What about all those telling me $3,000/oz, in months, not years.

For today, it’s just not happening.

Adverse moves in gold (GLD) like we have right now, especially after months of incessant hype, puts those who bought into the narrative on the wrong side; stunned, unable to move.

There’s a small chance, this could be a shakeout before going higher. Anything can happen.

However, if we look at the chart of GLD, it’s a grim situation for the bulls.

Gold (GLD)

Daily chart, GLD:

This wasn’t just a one-day push above resistance and then reversal.

GLD, spent a Fibonacci 8-Days struggling to break out before this morning’s collapse.

Stunned bulls may think it’s a buying opportunity. If so, there’s likely to be some kind of underside test of resistance.

However, that’s not guaranteed. Moves like this tend to offer no relief and just grind their way lower.

Positioning:

At this juncture, we’ve got a nasty adverse move; putting the short position (DUST) well in the green (not advice, not a recommendation).

Any upward test of GLD, and the miners, GDX, GDXJ, is likely to reveal new support/resistance boundaries and possibly trend-lines.

If so, we’ll have something to monitor for a potential exit signal.

Stay Tuned

Charts by StockCharts

Note:  Posts on this site are for education purposes only.  They provide one firm’s insight on the markets.  Not investment advice.  See additional disclaimer here.

The Danger Point®, trade mark: No. 6,505,279

Random Notes

The Usual Suspects For the Week

No. 1

‘Imagine The Hysteria …’

The quote below, taken from the October 14th post:

“If GLD breaks the trend-line, getting back to the 170 – 171, level (up-thrust), imagine the hysteria.” 

Well, at Friday’s close, GLD is currently at 172.61 and reached an up-thrust high (thus far) of 174.67.

Now, a re-cap of the hysteria (most recent first):

Von Greyerz: Gold-O-Mania Is Coming!

Gold Breakout Imminent!

Gold shhh…

Gold Probes Multi-Month Highs

“$3000 In Months, Not Years”

Gold & The Dollar Soar

Gold & Crypto Surge

That’s just within the last eleven days.

All of the above, brings us to the next item.

No. 2

U.S. Inflation. Hardest Hit Categories

The linked article goes on to detail where prices have risen the most … well, almost.

This chart shows the financial press approved categories and respective price increases.

But wait, there’s a category left out.

What about ‘ammunition’. The price of that category is up (depending on source) anywhere from 300% – 1,000%.

You have to wonder why that’s not on the list.

Personal anecdote:

A trip to the local Wal-Mart just yesterday to get mealworms for the hens (local feed store mom & pop has been out for weeks) gave opportunity to go by the sporting goods and the ‘ammo counter’.

The counter’s thirty-foot rack, was stripped bare.

All of it gone except for a few boxes of Federal 22,target, and some 12-guage.

Later in the day, there’s a strange twist while searching for product using this site,

The comments (rating) section have people bragging about how their ammo, is older production.

It’s completely turned upside down. Back in the day, you wanted the freshest stuff available.

Now, because of difficulties finding parts, product and experienced employees that have not been jabbed, quality has apparently declined.

The inference is, if you can prove that your ammo was manufactured during 2019, or before let’s say, you might be able to charge a premium on the secondary market.

Paul Harrell has shown, linked here, that properly stored, ammo will still be viable after 50-years or more.

Which brings us to the next item.

No. 3

Shipbuilder, Backpedals

Turns out, this shipbuilder’s not quite ready to destroy its own business.

However, the damage has (likely) already been done.

Anyone with production experience knows the way to destroy product quality, is to have an on-again, off-again, and then back on-again, production line.

It does not matter the product.

If production can’t be sustained, uninterrupted, for periods at a time, there really is no quality. Too many variables have been introduced.

This is where we are with all product. It may be part of the reason retail sales have spiked.

Get the good stuff now.

Stay Tuned

Note:  Posts on this site are for education purposes only.  They provide one firm’s insight on the markets.  Not investment advice.  See additional disclaimer here.

The Danger Point®, trade mark: No. 6,505,279

Silver: Leading The Way, Lower

Already Below Resistance

While gold (GLD) is just above its resistance breakout, silver’s not waiting around.

It’s already below its breakout; apparently leading to the downside.

Using ‘boots on the ground’ type reporting from sources like Jerimiah Babe and Dan (I Allegedly), the financial collapse is accelerating.

The metals look like they’re not exempt from financial conditions (deflation); they’re at the cusp of reversal.

Silver (SLV) Daily Chart:

The next chart zooms in on the reversal area.

It’s clear; SLV is now below resistance … a bearish indication.

At some point and if you live long enough (and have a working brain) you realize it’s all about manipulation.

Everything is manipulated.

Separating from that trap is akin to mental bravery; setting you apart from the mindless herd and at times, in opposition to that herd.

Silver (SLV) is down a whopping -53% from its high set over a decade ago in April of 2011. How can we be in inflation or hyperinflation?

That’s to come … maybe.

Right now, silver’s giving us a signal; lower prices ahead.

Stay Tuned

Charts by StockCharts

Note:  Posts on this site are for education purposes only.  They provide one firm’s insight on the markets.  Not investment advice.  See additional disclaimer here.

The Danger Point®, trade mark: No. 6,505,279

… And, More Gold Bulls …

Nascent GDX Reversal, Gathering Steam

Packed in like sardines, the gold bulls just keep on coming.

Once again, the latest from ZeroHedge:

Von Greyerz: Gold-O-Mania Is Coming!

The author is “convinced” gold is going to end the year higher than it is now.

Well, it could.

Does that mean the miners are going to end higher?

Gold Miners, GDX:

A marked up chart of leveraged inverse fund DUST (-2X GDX), is below.

Chart is on the 4-Hour scale:

We can see a potential trend.

When that area is expanded with contact points (below), it becomes even more convincing.

The actual metal, gold, may indeed rise over the coming months.

However, today, GLD is retracing to support. What happens now, is the key.

Bounce and continue (higher), or bounce and fail.

Positioning:

The short position via DUST (not advice, not a recommendation) was opened at the danger point when the direction of price action was unknown.

From the post on November 10th:

“As of this morning, we’re already positioned short this sector via DUST (not advice, not a recommendation).”

DUST has since moved higher (GDX, lower) and the trade is well in the green.

That means one can watch the battle take place at support for GLD, GDX and resistance for DUST from a (somewhat relaxed) position of profit.

Summary:

The final outcome of this short-trade is of course, unknown.

However, one of the objectives of these posts is to document the level of research and preparation involved for a ‘position’ trade.

Going short has been two months in the making.

From the initial ‘GLD Target‘ post to now, we’ve seen manipulation of GLD, GDX price action; making it look like a breakout was imminent.

That action was coupled with non-stop financial press herding of the easily influenced to the bull side.

How can it not be coordinated? Remember this post?

So, it looks like the bull trap has been set.

This trade could still fall apart for some unknown reason.

If it looks like the bulls are somehow re-gaining control, it will show up in the price action and we’ll exit accordingly (not advice, not a recommendation).

Stay Tuned

Note:  Posts on this site are for education purposes only.  They provide one firm’s insight on the markets.  Not investment advice.  See additional disclaimer here.

The Danger Point®, trade mark: No. 6,505,279

Gold Bulls Continue On

Even As The Miners Reverse

After attempting to breakout higher over the past six trading sessions, the miners are posting signs of a nascent reversal.

Even so, the bull calls continue.

The latest round includes two more articles from ZeroHedge:

Gold Breakout Imminent !

The first part describes some technical details that are all true … after that, well, you decide.

Turns out, gold is going to skyrocket because of Russia !

I suppose, anything can happen.

We get fundamentals and anecdotal data as the reasoning for a Russia driven up-side breakout.

The problem with fundamentals is, they don’t work.

They never have worked.

Wyckoff discovered this a century ago when he said (from his autobiography) that ‘stocks move based on a power of their own. That power, has nothing to do with fundamentals.’

Trading genius Ed Seykota repeated that truth during his interview for ‘Market Wizards’.

He called them ‘funny mentals’ and went on to say he nearly, if not always lost money using them.

Gold shhh …

This article’s so good that I have to pay to read it.

From reading the shaded area, we can infer a similar (bullish) discussion to the first link above.

Sorry, not interested.

Summary

This time really could be different. Gold could launch into a sustained upward breakout.

However, the charts (GDX, GDXJ) at this juncture, are saying ‘not yet’.

Maintaining short (not advice, not a recommendation) via DUST … which is now in the green.

Stay Tuned

Note:  Posts on this site are for education purposes only.  They provide one firm’s insight on the markets.  Not investment advice.  See additional disclaimer here.

The Danger Point®, trade mark: No. 6,505,279