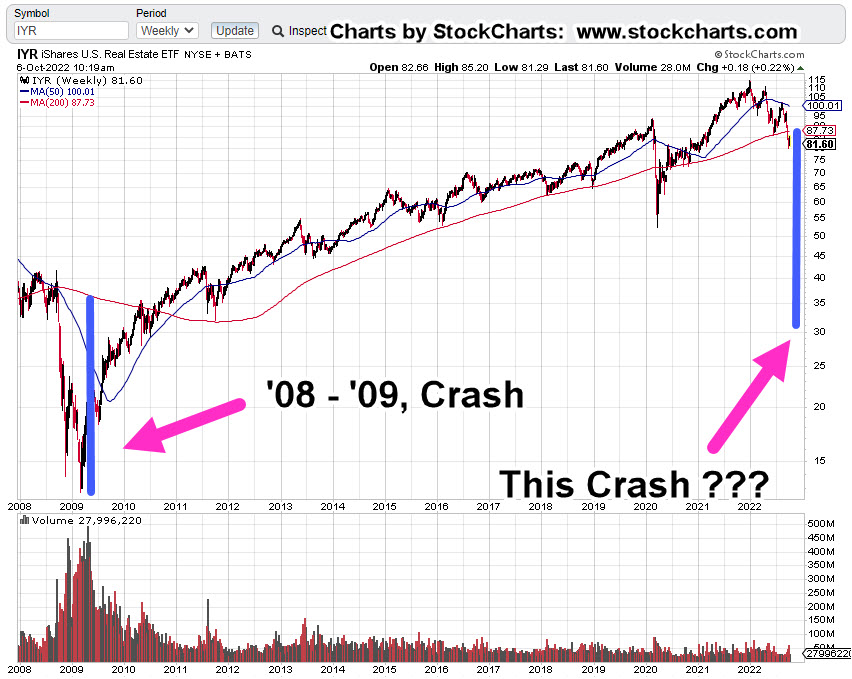
The last time we had a major (sustained) economic melt-down, was 2007 – 2008.
The market (S&P) bottomed on March 9th, 2009, posting a low at 666.79.
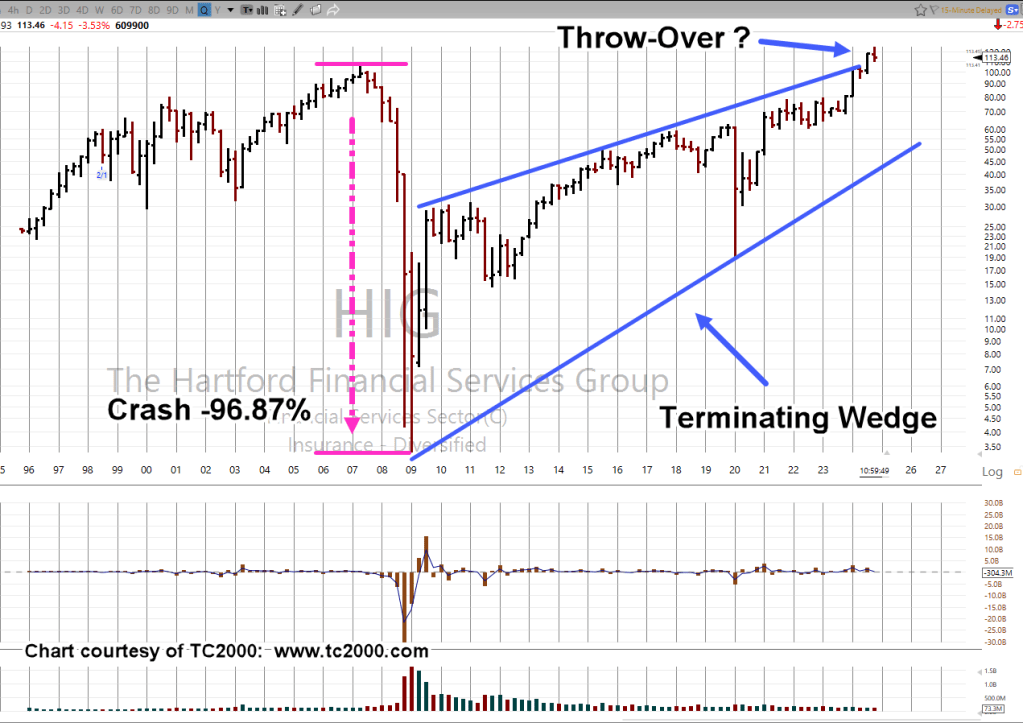
During that collapse, Hartford Financial was one of the hardest hit.
It imploded, crashed, by -96.87%.
It’s important to note, HIG bottomed at 3.33, during the week-ending, 3/6/09; you can’t make this stuff up. 🙂
So, let’s take a look at what HIG, is doing now and if it’s at risk, yet again (not advice, not a recommendation).
We’re looking at the long-term, the Quarterly Chart
Hartford Financial, HIG, Quarterly
With just a few weeks left in the Quarter, HIG is positing a reversal.
From a classical analysis standpoint, a reversal back into the wedge (and then upside test) would be a potential sell-signal (not advice, not a recommendation).
Note: Posts on this site are for education purposes only. They provide one firm’s insight on the markets. Not investment advice. See additional disclaimer here.
Everybody seems to talk about the crash of ’87, as if it suddenly appeared out of nowhere, October 19, 1987.
Digging deeper, the crash started months earlier, at the market peak on August 25th.
One may consider today, Monday, August 26th, the 37th anniversary of that top; when by chance, we’re at another all-time high.
By now, most of us are tired of The Gong Show style prognostications:
‘Crash this’ and ‘crash that’, ‘the dollar’s going to collapse’ and there’s that! 🙂
At this point, none of those things have happened … yet.
In fact, the ‘collapse’ may actually be of a different sort this time around; posed by Uneducated Economist, link here (time stamp: 2:04).
Real & Separated
We may indeed get an ’87 or ’07, type of collapse, eventually.
Or, it may be that sectors wipe-out individually.
However, as UE points out (above, link), the ‘crash’ this time is hidden. It’s the separation of wealth from the ever more have-nots, to the haves, and have-more.
The (Biggest) Bubble
As the Dow Jones is making an historic high, possibly the biggest bubble of all time, the A.I. bubble, led by NVDA, and the SOX Index (SOXX, tracking ETF), peaked out on July 11th (not advice, not a recommendation)
When we last left the SOXX, with this update, link here, it had this to say (emphasis added):
“If we just saw a test of resistance (solid black line), then there’s only one (or a variation of one) right answer at the next session.”
“That is, SOXX, price action (by the close) to be either net sideways or down (not advice, not a recommendation).”
Well, ladies and gentlemen, that’s exactly what happened.
The SOXX, posted a new daily low, closing down -5.86-pts., or -2.51%.
Note: Posts on this site are for education purposes only. They provide one firm’s insight on the markets. Not investment advice. See additional disclaimer here.
Having been through the crash of ’87, ’98, ’01, ’08, and now, the feeling is similar.
Each time the vehicle (stock) is different but also the same, at the same time.
In case anyone wants to review, here’s the definition of ‘bag holder‘.
Is Now, The Time?
Previous analysis and potential top identification for NVDA, has been premature.
With that in mind, presented below are two charts.
One has the Fibonacci count from the October ’22 lows; the other, shows a trading channel overlay.
The inference is, we’re close to some kind of ‘event’ whether it be sideways congestion or reversal (not advice, not a recommendation).
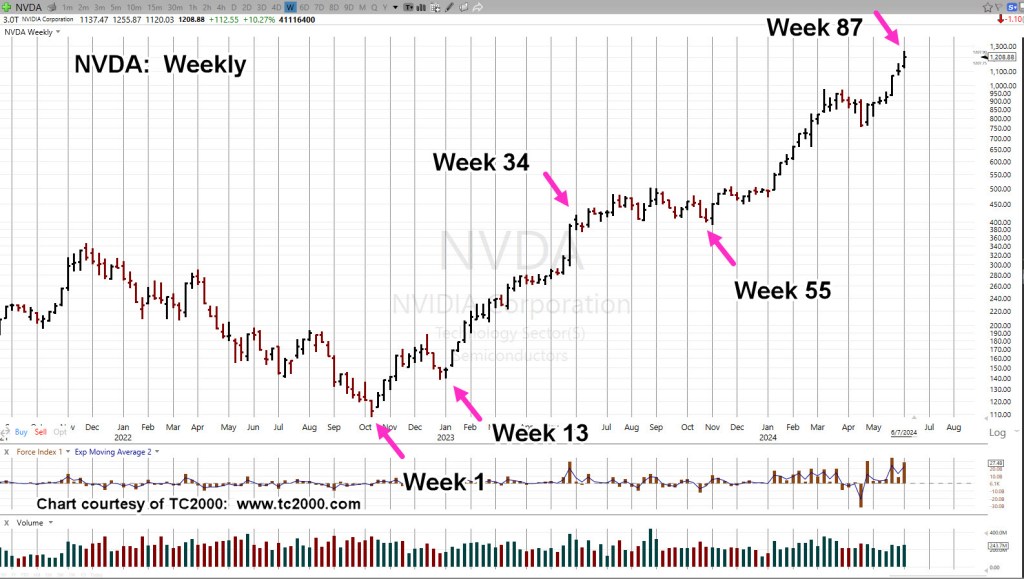
Nvidia NVDA, Weekly
It appears, since the October ’22 lows, NVDA is being influenced by a Fibonacci sequence.
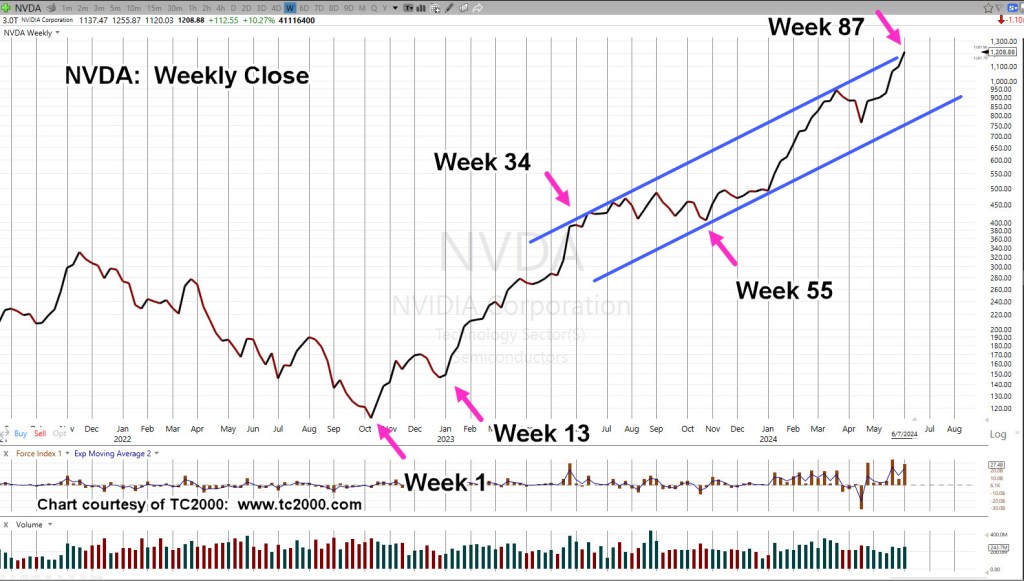
The ”close’ chart has the same Fibonacci count as well as the current trading channel.
Next week is ‘Week 88’, stock-split (10 to 1), as well as the Fed meeting.
Week 88, is within the margin of error for a precise Fibonacci count, Week 89.
With NVDA, at the top of its trading range, one needs to be on the lookout for some type of Fed/Stock-Split ‘overshoot’ or other indicator of potential upside limit (not advice, not a recommendation).
Note: Posts on this site are for education purposes only. They provide one firm’s insight on the markets. Not investment advice. See additional disclaimer here.
This time, instead of, The subprime crisis is contained”, we have, ‘The banking crisis is over’.
Back then, as the market crashed into ’09, and then forced (manipulated) higher into 2010 and later, you intuitively knew the next time, there’s no saving it (not advice, not a recommendation).
So, here we are … at the ‘next time’.
However, this time around, it’s different … very different.
Coming out nearly every day, is the massive driver to the downside: Biotech. The updated list on that sector is provided at the end of this post.
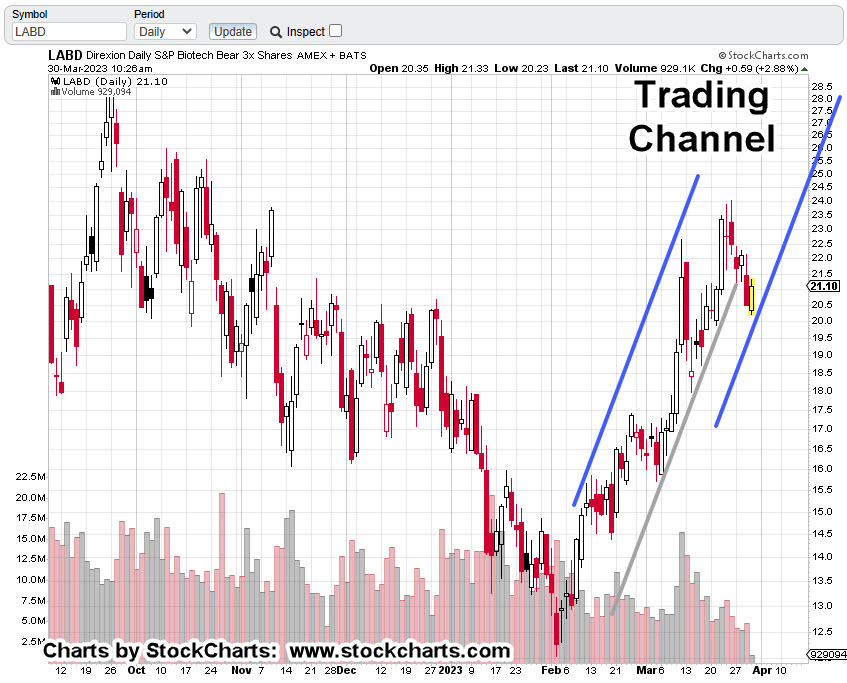
For this update, we’re looking at the technical condition and more specifically, biotech leveraged inverse fund LABD.
Biotech Leveraged Inverse LABD, Daily
We’re early in the session (11:03, a.m., EST) and we can see a reversal (if it holds) developing.
Today, is also Fibonacci Day 5, from the high set last Friday, the 24th.
Since today may be a pivot to the upside (biotech index lower), a potential continuation channel line is drawn in the chart below.
As mentioned in the last update, a retrace was probable and hence taking profits with a partial exit.
During the past four trading days, that position has been re-established at lower prices (not advice, not a recommendation).
Insurmountable Fundamentals.
At some point unknown to us, the fundamentals will come into play.
The conditions are insurmountable … they can’t be ignored.
Said many times, this is the driving factor for the market(s) on a go-forward basis (not advice, not a recommendation).
Latest on The Biotech List
We’re going to start first with an article that surmises, the blow-up has already happened. That article is here. The report starts off with profanity; be advised.
Then, the biotech list; growing without bound:
Risk Of Cardiac Death Tripled For Young Women Following AstraZeneca COVID-19 Vaccination: Study
Bombshell Vax Analysis Finds $147 Billion In Economic Damage, Tens Of Millions Injured Or Disabled
CDC Found COVID-19 Vaccine Safety Signals Months Earlier Than Previously Known, Files Show
Three Years To Slow The Spread: COVID Hysteria & The Creation Of A Never-Ending Crisis
Biden Signs Bill To Declassify COVID Origins Intel
“I Couldn’t Remain Silent”: Physician Assistant Fired For Reporting COVID-19 Vaccine Adverse Events To VAERS
A Haunting Anniversary – ’15 Days To Slow The Spread’
Note: Posts on this site are for education purposes only. They provide one firm’s insight on the markets. Not investment advice. See additional disclaimer here.
Note: Posts on this site are for education purposes only. They provide one firm’s insight on the markets. Not investment advice. See additional disclaimer here.
Note: Posts on this site are for education purposes only. They provide one firm’s insight on the markets. Not investment advice. See additional disclaimer here.
Note: Posts on this site are for education purposes only. They provide one firm’s insight on the markets. Not investment advice. See additional disclaimer here.
Note: Posts on this site are for education purposes only. They provide one firm’s insight on the markets. Not investment advice. See additional disclaimer here.
Note: Posts on this site are for education purposes only. They provide one firm’s insight on the markets. Not investment advice. See additional disclaimer here.
Note: Posts on this site are for education purposes only. They provide one firm’s insight on the markets. Not investment advice. See additional disclaimer here.