Biotech is not behaving as expected; LABD-22-08, has been exited completely with an overall profit of about +8.5%.
We all know that real estate is in the largest bubble in U.S. history … and that’s not hyperbole.
With today’s upward bias in the market and IYR, not responding in kind (remaining weak), a position has been opened in leveraged inverse, DRV @ 74.53 (not advice, not a recommendation).
Price action in IYR, could still pressure somewhat higher into the close; thus, DRV would decline but the anticipation is if so, not by much.
Trade is labeled as DRV-22-05; stop is TBD, to be provided after the close.
Note: Posts on this site are for education purposes only. They provide one firm’s insight on the markets. Not investment advice. See additional disclaimer here.
It’s best to let the reader sort out what it all means, arriving at one’s own conclusions.
Of course, the obvious problem, the ‘elephant’ is not addressed directly.
However, VAERS is quoted in The Epoch Times article, thus giving it legitimacy.
Leading The Downside
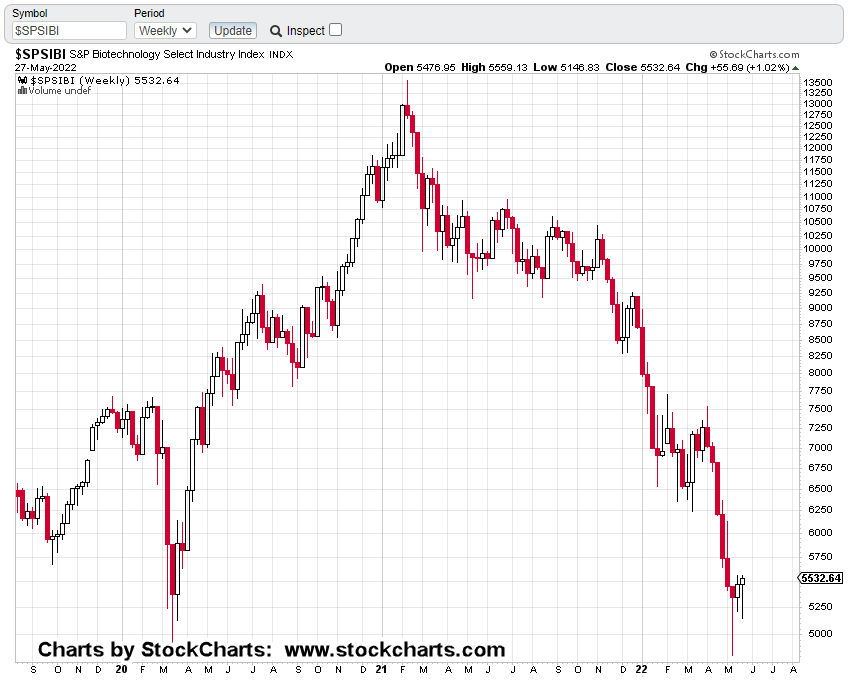
For some time, this site’s highlighted, biotech (SPBIO), as unique to all other indices save GDX, and GDXJ.
That is, it’s down the most since the bear market started.
As of today’s close, it’s down over – 54%, from all-time highs while the S&P is down only – 23.7%.
As documented over several years, the sector’s unique; it’s at risk (more than other indices) to implosion.
With today’s close, it looks like we’re at a critical juncture.
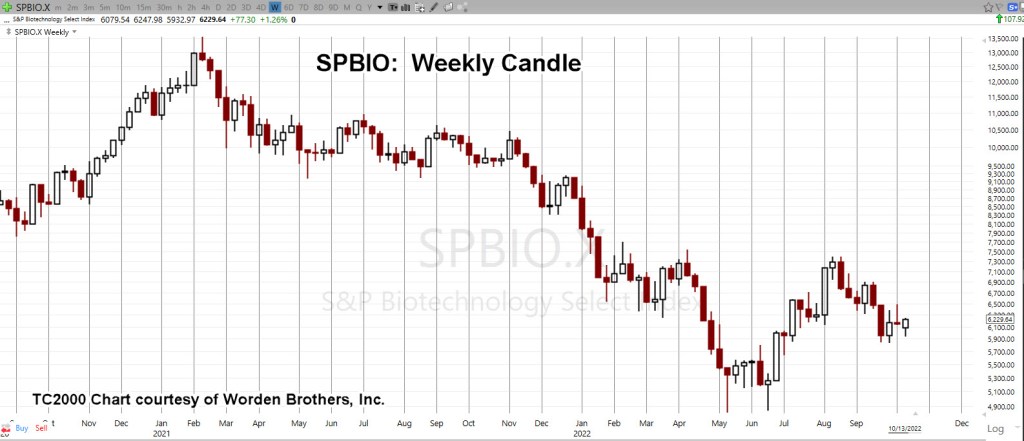
Biotech SPBIO, Weekly
The unmarked weekly chart
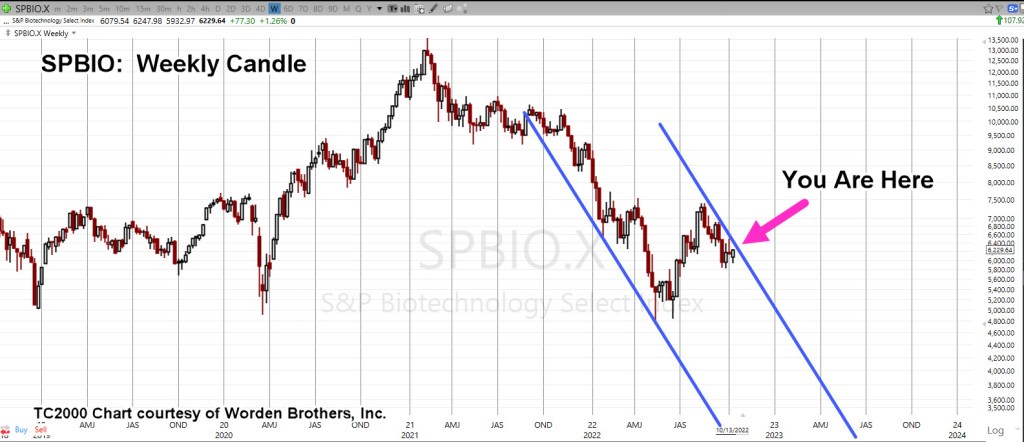
Compressed, with added trendlines.
It’s an obvious trading channel of immense size … but so is nearly everything else concerning these markets. We’re operating at unprecedented scale in unprecedented times.
But wait, there’s more.
The trading channel has Fibonacci time correlation(s).
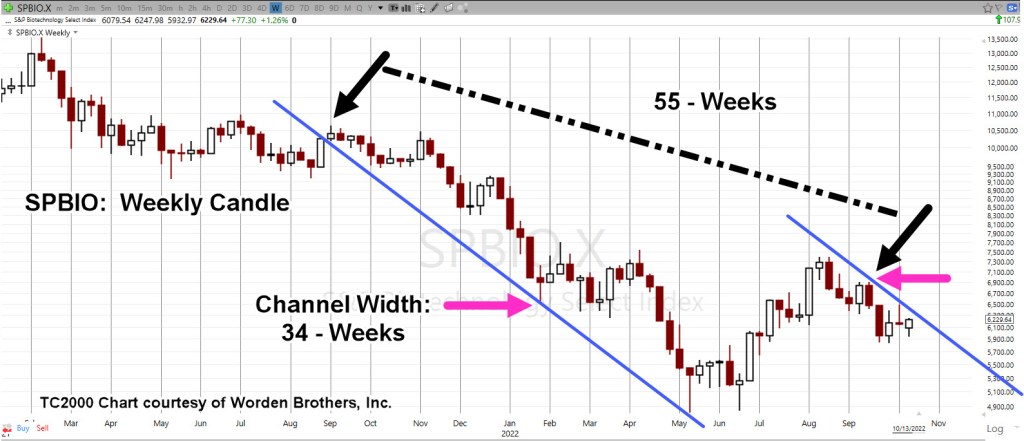
We’ll expand the weekly chart for more clarity.
From channel entry, week ending 9/3/21, to the right-most contact point (week ending 9/16/22), is Fibonacci 55-Weeks.
Channel width measured from week ending 1/28/22, to the same contact-point, week ending 9/16/22, is a Fibonacci 34-Weeks.
We’re at The Danger Point®
Positions & Current Stance (courtesy only, not advice).
The following is the positioning of my firm’s main (largest) account.
DRV-22-04:
Entry @ 66.463, Stop @ 63.98
Discretionary exit (today) @ 75.96***
Trade Closed
LABD-22-08:
Entry @ 25.1278, 24.735, 26.025***, 22.99***, Stop is Open (to be set at next session)
***, Indicates change
Note: Positions may be increased, decreased, entered, or exited at any time.
Note: Posts on this site are for education purposes only. They provide one firm’s insight on the markets. Not investment advice. See additional disclaimer here.
Well-calculated stops, (mostly) take care of trade implosion. So, where’s the exit?
The answer is there’s no set answer.
We’ll explain that by using the current plan for DRV-22-04 (not advice, not a recommendation).
Questions
First question to determine an exit in this case, is to ask:
“What are the media pundits, and/or ‘experts’ talking about right now?”
Well, that’s easy.
Just like the ‘silver squeeze’ idea that won’t go away (even as SLV continues downward), the ‘Fed pivot‘ is another delusion that keeps holding on.
As parts of the market (like IYR) continue their free-fall, all eyes are on the next Fed meeting; waiting for them to pivot and ‘save us’.
Right around November 1st, or 2nd, seems like it can’t help but be some kind of emotional cathartic set-up.
Unless stopped out ahead of time, the plan, is to plan an exit within that window.
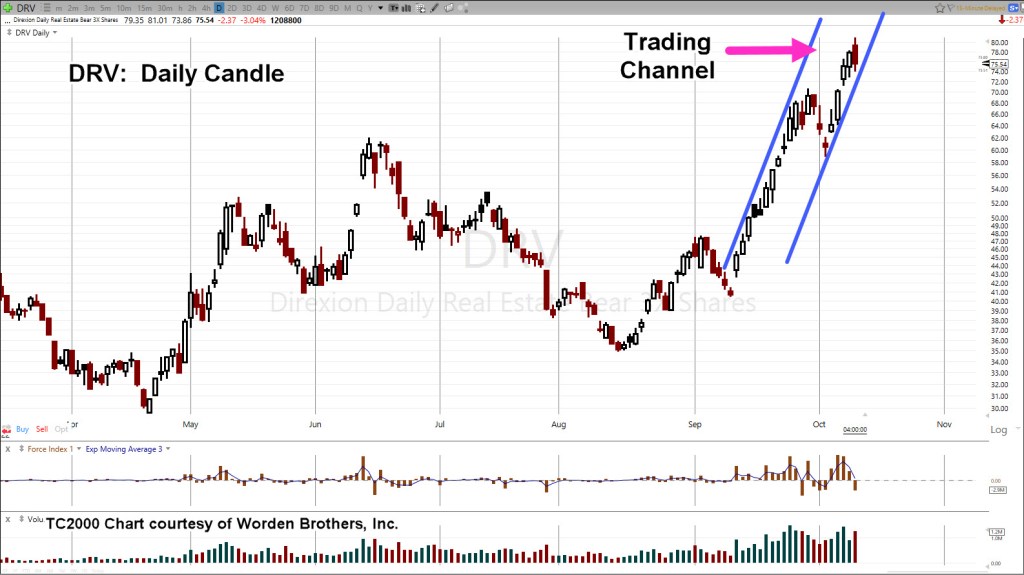
Let’s go to the IYR, 3X Leveraged Inverse fund DRV.
IYR, 3X Inverse, DRV, Daily
At the end of today’s session DRV has posted a downside reversal candle.
The next session will be important.
We either have follow-through to the downside, thus validating the reversal (and exit of the position) or we have some variation of an inside day or new daily high.
If the trading channel remains valid, the compressed chart below shows a potential exit range: DRV 140 – 200.
During the next session(s), if DRV, posts a new daily high (unless stopped), the DRV-22-04, stop will be moved to this session’s low @ 73.86
Positions & Current Stance (courtesy only, not advice).
The following is the positioning of my firm’s main (largest) account.
DRV-22-04:
Entry @ 66.463, Stop @ 63.98
ZSL-22-01:
Entry @ 28.08, Stop @ 28.53:
Discretionary exit (today) @ 31.5513***
Trade Closed
LABD-22-08***:
Entry @ 25.1278 (yesterday) and 24.735 (today), Stop @ 22.59
***, Indicates change
Note: Positions may be increased, decreased, entered, or exited at any time.
Note: Posts on this site are for education purposes only. They provide one firm’s insight on the markets. Not investment advice. See additional disclaimer here.
Note: Posts on this site are for education purposes only. They provide one firm’s insight on the markets. Not investment advice. See additional disclaimer here.
Note: Posts on this site are for education purposes only. They provide one firm’s insight on the markets. Not investment advice. See additional disclaimer here.
Note: Posts on this site are for education purposes only. They provide one firm’s insight on the markets. Not investment advice. See additional disclaimer here.
That’s the assessment from agents in the field on the imminent real estate implosion.
Interest rates have risen dramatically, applications have evaporated, properties not moving as before, prices are dropping, lenders deploying the last resort; Adjustable-Rate Mortgages (ARM).
When the ARMs, show up in force, it’s over.
Technical & Fundamental
Over the past several days, the real estate situation has been assessed from both a technical (chart) perspective as well as the fundamentals.
The bottom line (below), is so long, it may have to be covered in several posts.
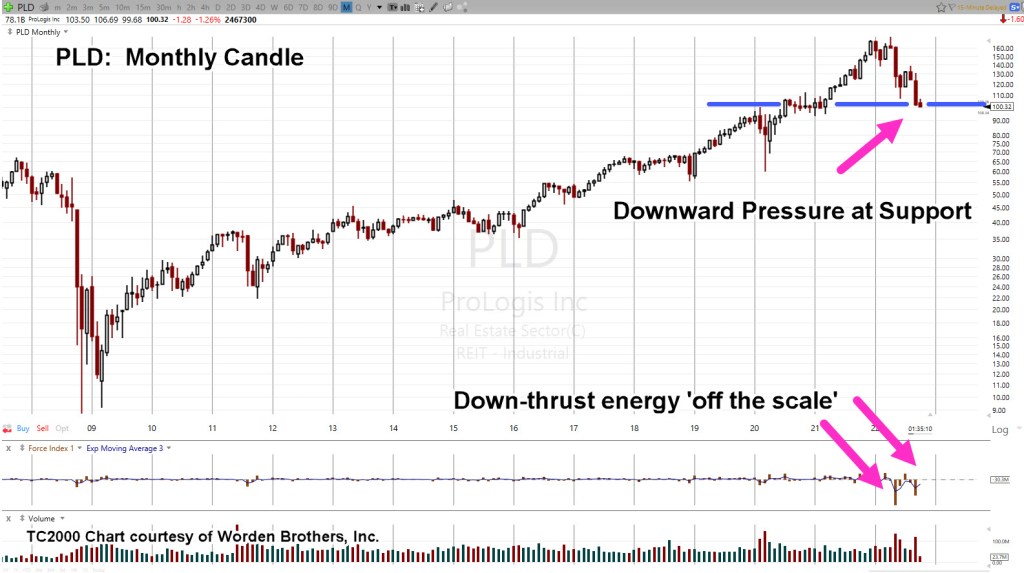
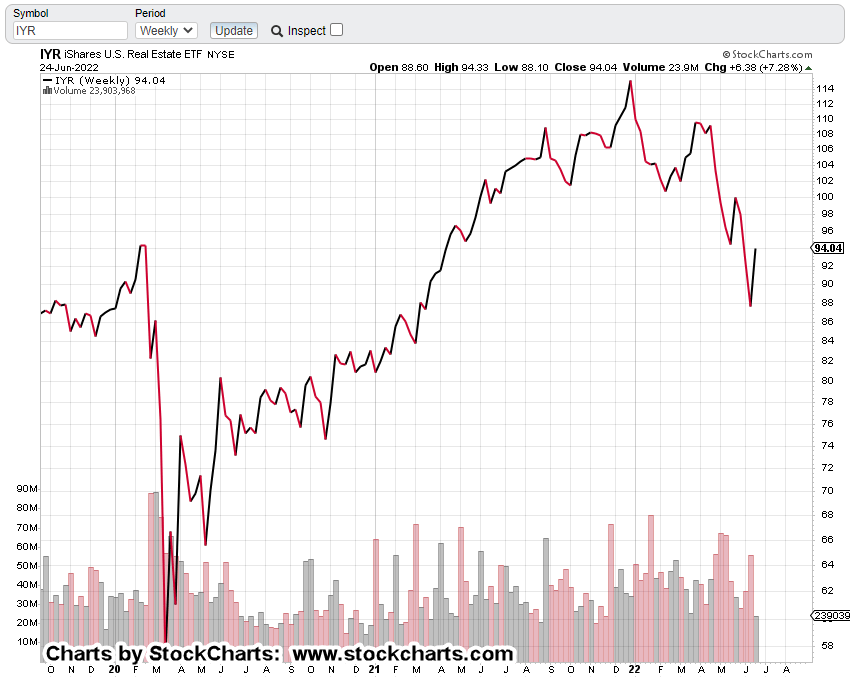
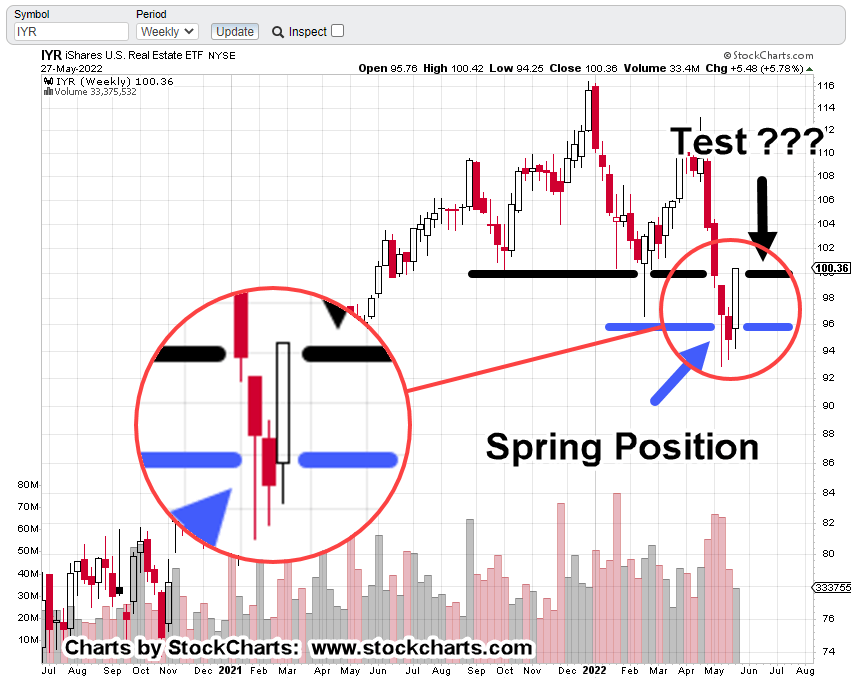
On a weekly and daily close basis, IYR has contacted underside resistance.
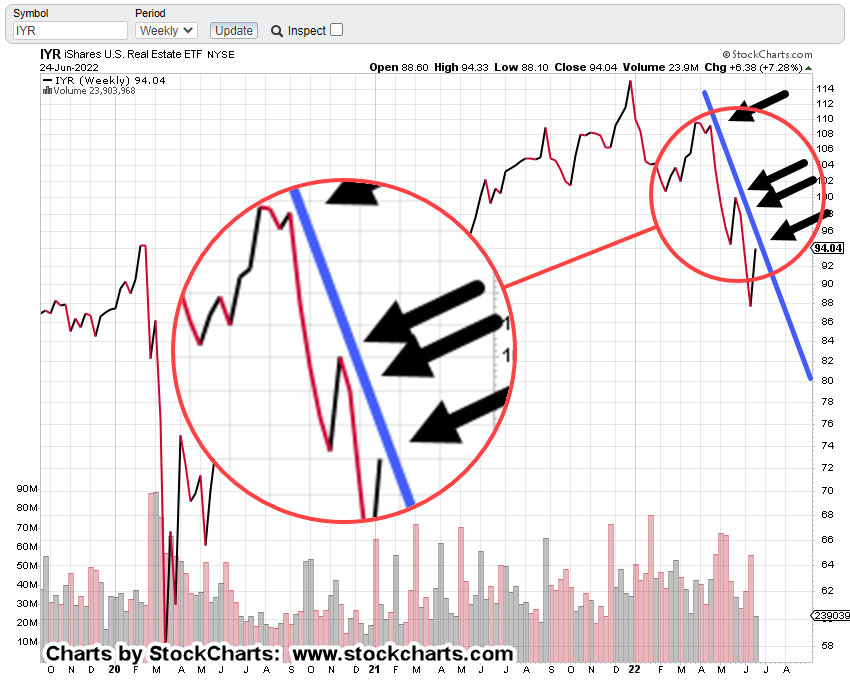
On a weekly and daily close basis, IYR has contacted the right side of a downward trading channel.
Multiple gap-fills at IYR, 91 and 94. Volume declines over – 22.5%, on the second gap-fill.
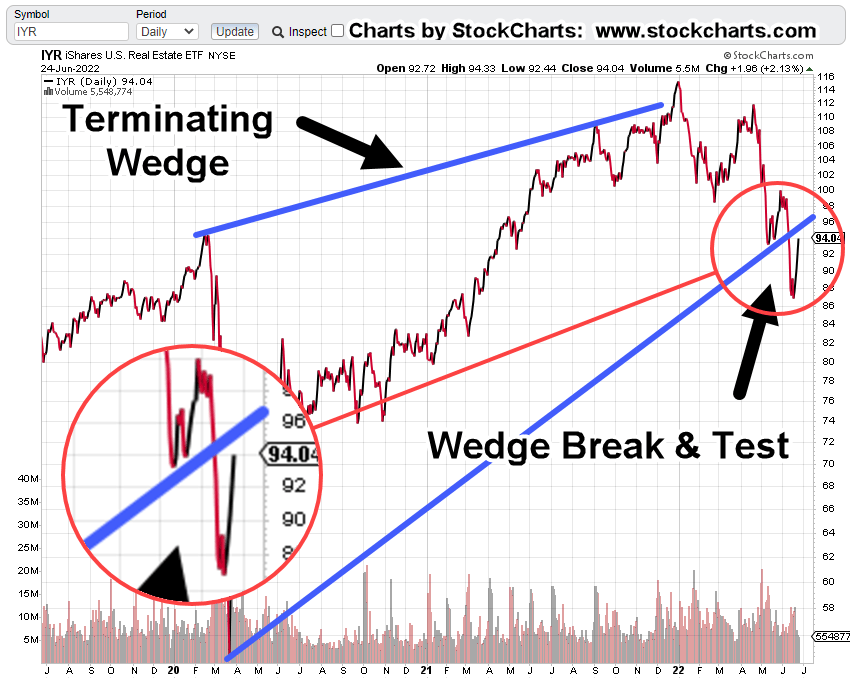
Multiple rising wedge breaks on multiple time-frames signal a potential drop of – 41.5%, from current levels.
Trading volume contracting (as price is rising) on multiple time frames, indicates potential lack of trader commitment to higher prices.
Financial press gets in the game (with several reports), saying ‘now is the time to buy’.
As highlighted above, once the Adjustable Rates dominate, the top is in.
This top may be far worse than ’07 – ’08, as debt levels are much higher, consumer is tapped-out and there is a massive ‘elephant’.
That elephant is now going mainstream with the resultant effect of unprecedented population decline/disablement.
So, let’s get started.
Real Estate IYR, Weekly Close
Un-marked chart.
Test of underside resistance
Zoom of underside contact.
Right side trendline.
Zoom of contact points.
Trading Channel
Wedge Break: Daily Chart
Zoom of break and test
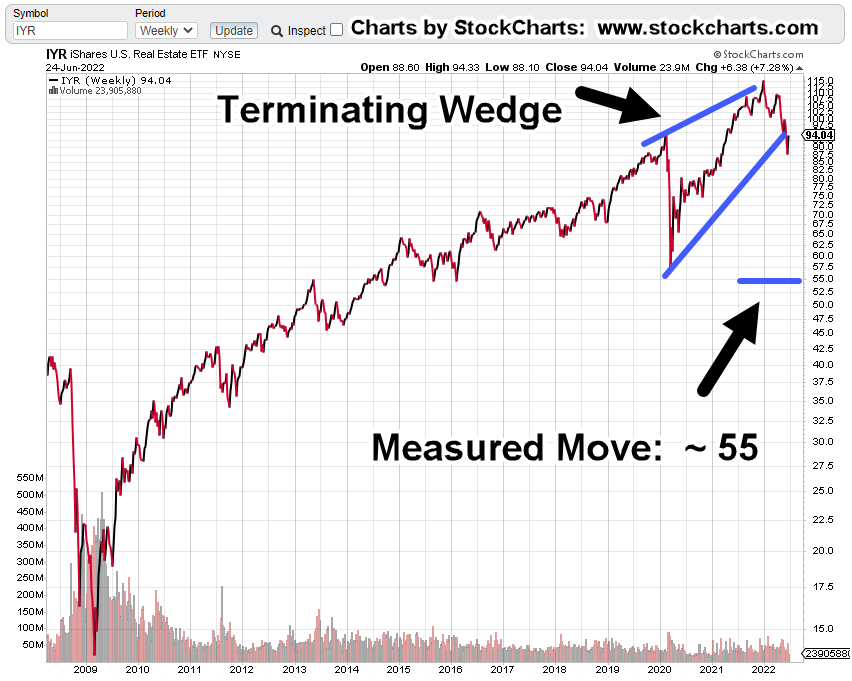
Wedge Break: Weekly Chart
Note:
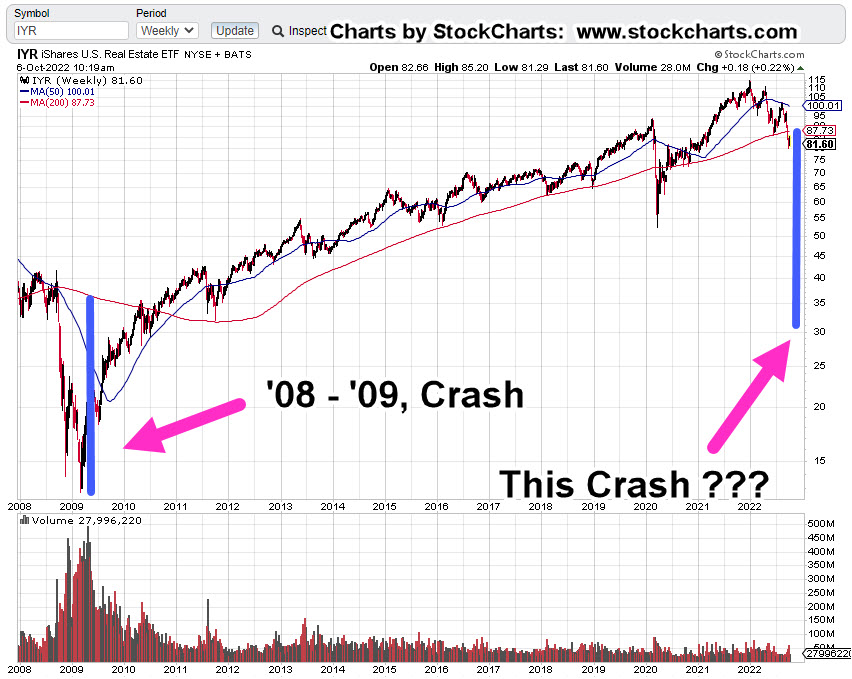
A measured move to 55-area, gets IYR, back to 2020 lows. That’s a reasonable expectation for an initial leg down.
If we use Prechter’s assessment concerning bubbles (manias), price action eventually retraces every bit (sometimes more) of the entire bubble move.
That puts the ultimate destination of IYR, somewhere in the vicinity of 14.0, or lower, representing a decline of – 88%.
It was going to be $3,000/oz., in months, not years.
Gold-O-Mania was coming. You could even sign up and pay money to read the group-think of the imminent launch.
Well, obviously at this point, $3,000/oz., is nowhere in sight.
Gold (GLD) is even lower now than it was then. On top of that, the ‘changing of hands’ assessment has not been negated; prices continue to grind lower.
Having the financial press cheerlead at the exact wrong time, is an (almost) necessary component to identify a lasting reversal.
As we can see here and here, the financial media’s position is, we’re heading higher. There is ‘real buying’ (whatever that is) for the first time in weeks.
However, from the chart evidence presented above (and we didn’t even get to ‘gap-fills’, ‘multiple wedges’, ‘contracting volume’ … maybe later), it’s hard to present that price action will somehow move significantly higher.
Price action behavior above, appears to point to an immediate or very near-term downside reversal.
Summary
Lastly, we have this from Activist Post: Real estate housing crash in progress.
Be careful. If you read the article, can you see the ruse?
It’s been discussed before on this site. That is, the real purpose of the Fed.
Note: Posts on this site are for education purposes only. They provide one firm’s insight on the markets. Not investment advice. See additional disclaimer here.
As we speak, economic activity is shutting down … fast.
Amazon shipments cancelled, gas stations going dry, banks halt lending, real estate sales collapse.
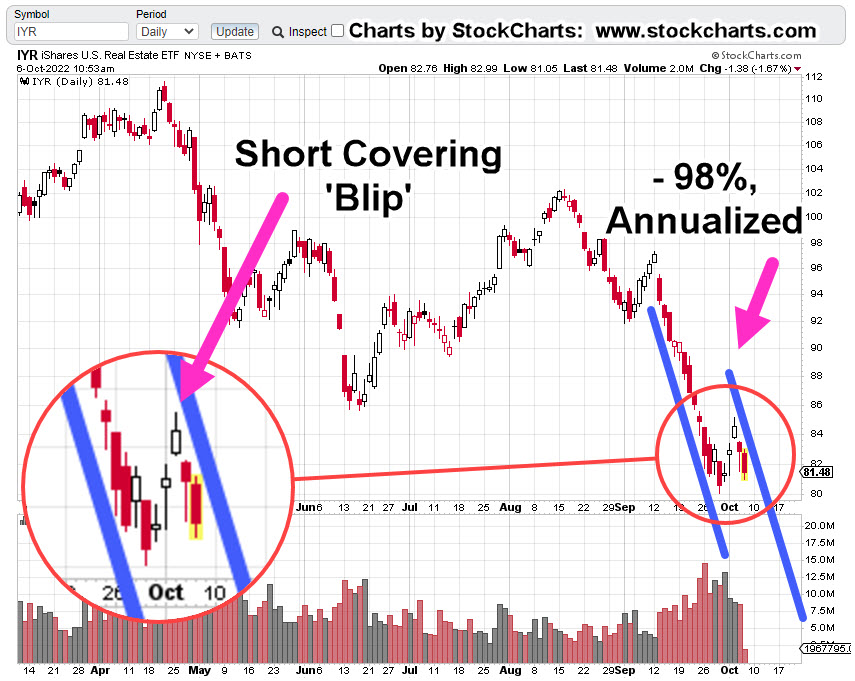
Meanwhile, the market’s in a short-squeeze.
What happens next?
We’ll discuss real estate and biotech farther down but first the data sources.
Dan from i-Allegedly reports here, he still has a couple of rubes (my word) that think the market just bottomed out.
Good luck with that.
As we’ll show below, the real estate bear market (IYR) rebound, was identified ahead of time.
Next, we have Red Hurricane describing one semi-trailer load after another being cancelled. He hauls for Amazon.
Shipping activity’s contracting, seemingly, by the minute.
Lastly, this link where the D-word, ‘Depression’ is used within the first one-minute, twenty seconds.
Bottom-out in the stock market? Probably not.
So, let’s take a look at real estate IYR, and see where it might go next.
Real Estate IYR, Weekly Chart
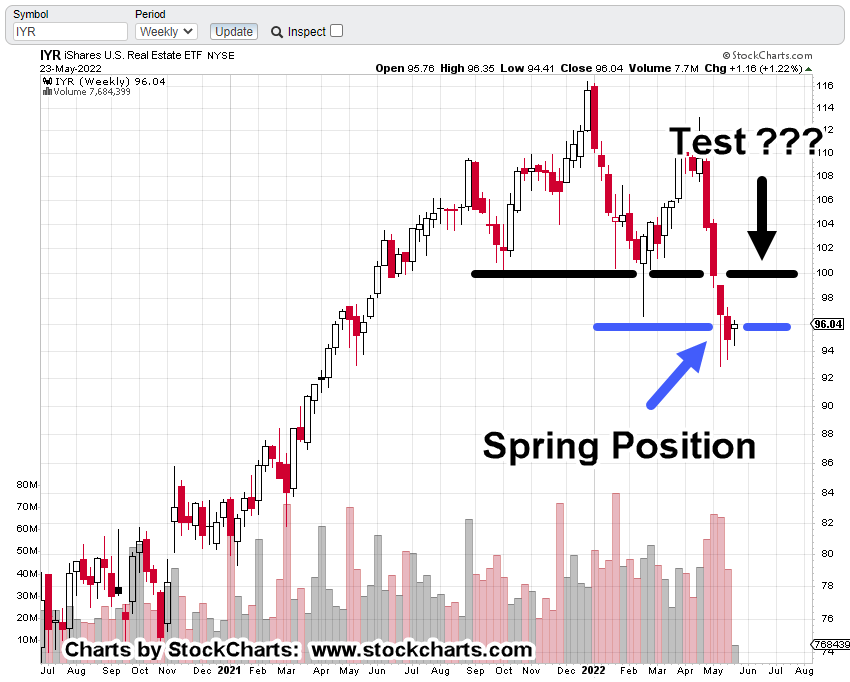
The last update (link, here) showed potential to rise into a test of resistance. That’s exactly what happened.
Back then:
And now:
With zoom
Obviously, the upward test happened much quicker than anticipated … but it was anticipated … no surprise.
Real estate got itself into Wyckoff spring position; so, a rebound (test) is normal market behavior … short-squeeze or not.
If it was a squeeze and if it’s over, we can expect an immediate drop in price action. We’ll analyze that as it plays-out in the coming week.
Now, on to biotech, SPBIO
Biotech SPBIO ($SPSIBI), Weekly
Some housekeeping first.
Obviously last week, with being short, more downside action was anticipated resulting in upside for LABD.
On Friday, that did not happen. Biotech was part of the squeeze as well.
The short position via LABD, identified as LABD-22-02, was reduced but not exited completely (not advice, not a recommendation).
At present this is where we are.
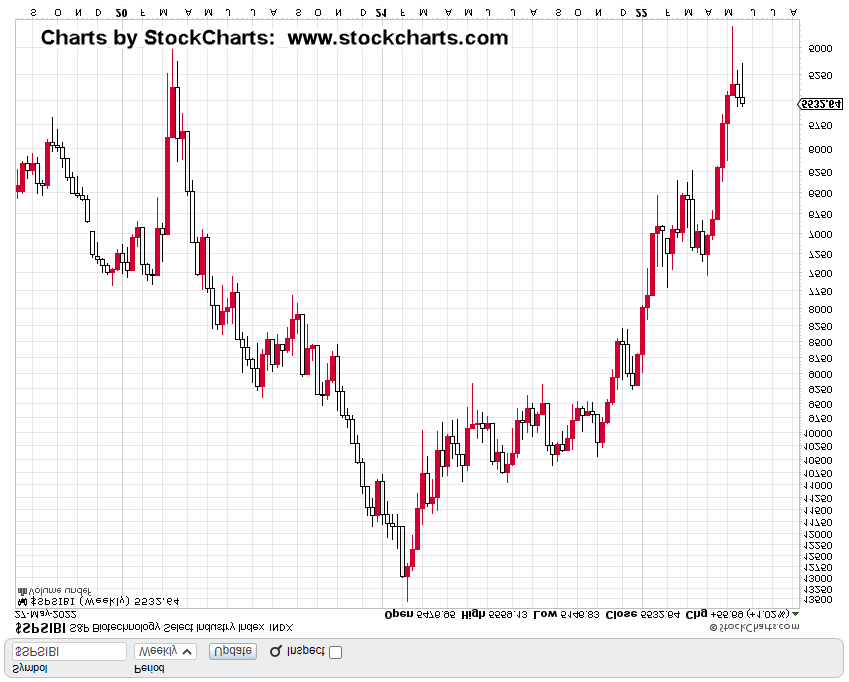
First, we’ll start by inverting the chart to mimic the action of 3X inverse, LABD.
Next, we’ll zoom-in and highlight the ‘squeeze’.
Doesn’t look like much when viewed that way does, it?
Next, we’re going to zoom-in, on the zoom
In spite of all the squeeze chaos on Friday, price action could not post a new weekly low (high on the non-inverted).
We’ll see this Tuesday, if that’s important or not.
This post is getting long but let’s end with the rule of alternation. The same chart is marked up below.
If this rule is still in-effect, we’re at a juncture where one can expect a ‘simple’ alternation.
We’ve already had complex action on the prior congestion; so, we can expect current action to be simple in character.
That means, price action’s not likely to stick around at these levels whether it’s going up or down.
Based on the above analysis, the expectation for Tuesday’s open is a gap lower for SPBIO and higher for LABD.
If that does not happen, something else is at work … we’ll report on that as necessary.
Summary
Has the market bottomed out? Not likely.
Those who are at this late stage, still arguing with Jerimiah Babe and Dan (and Patera), that the market’s rebounding, everything’s fine, are in a state of delusion.
The mindless herd following spending with ever newer cars, moving up to the McMansion, opulent vacations, posting it all on Facebook is most decidedly, gone.
It’s finished. It’s Done.
The problem is, as J.B. notes above (time stamp 7:15 and 8:30), those still living that life don’t seem to know it’s over.
For the leaders, the tiny minority and those reading this post, who are, or who have been preparing for years, it means potential huge (life changing) opportunities.
That is, as long as the markets, the banks and other infrastructure stay open; not guaranteed in any way.
Note: Posts on this site are for education purposes only. They provide one firm’s insight on the markets. Not investment advice. See additional disclaimer here.
It’s possible, because price action is always the final arbiter.
Before the rest of the report, some housekeeping.
Real Estate IYR, has broken the down trend lines previously discussed.
A discretionary (not stop related) exit was performed on all positions at approximately DRV 46.45.
Trade DRV-22-02, is officially closed.
If the market turns around and looks like IYR is about to resume its downtrend, the DRV position could be re-established (not advice, not a recommendation).
As it stands, profit on the entire DRV-22-02, was in the vicinity of +19.2%.
That’s not too bad, considering the rest of the population is losing their shirts as reported here.
There were 25 DRV, transactions during the trade.
Where to Now?
Real estate can resume the downtrend, or it can test the underside of support, now resistance (shown below).
Under ‘normal’ market conditions, a test is typical behavior.
However, we’re in a financial collapse so anything is possible.
Real Estate IYR, Weekly
The chart above paints a familiar picture.
The overall trend is down. However, that does not mean price can’t go higher.
In fact, as we all know, the sharpest rallies occur in the middle of bear markets.
Whether we get one now, is unknown. Typical market behavior is to come back to the resistance area (black axis line) for a test.
Summary
From personal standpoint, I’ll take the near 20% gain (not advice, not a recommendation) and stand on the sidelines for a more definitive set-up.
Note: Posts on this site are for education purposes only. They provide one firm’s insight on the markets. Not investment advice. See additional disclaimer here.
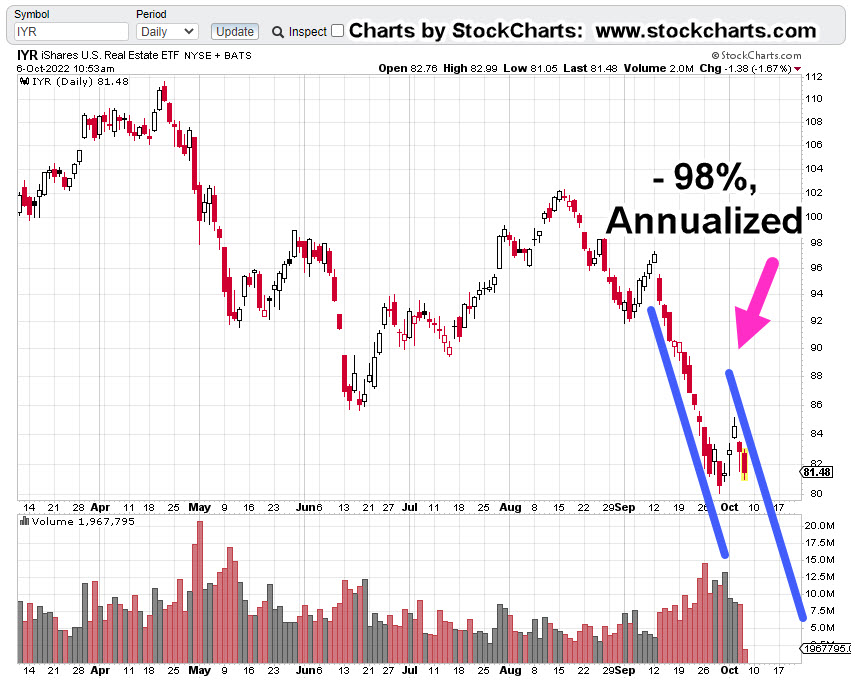
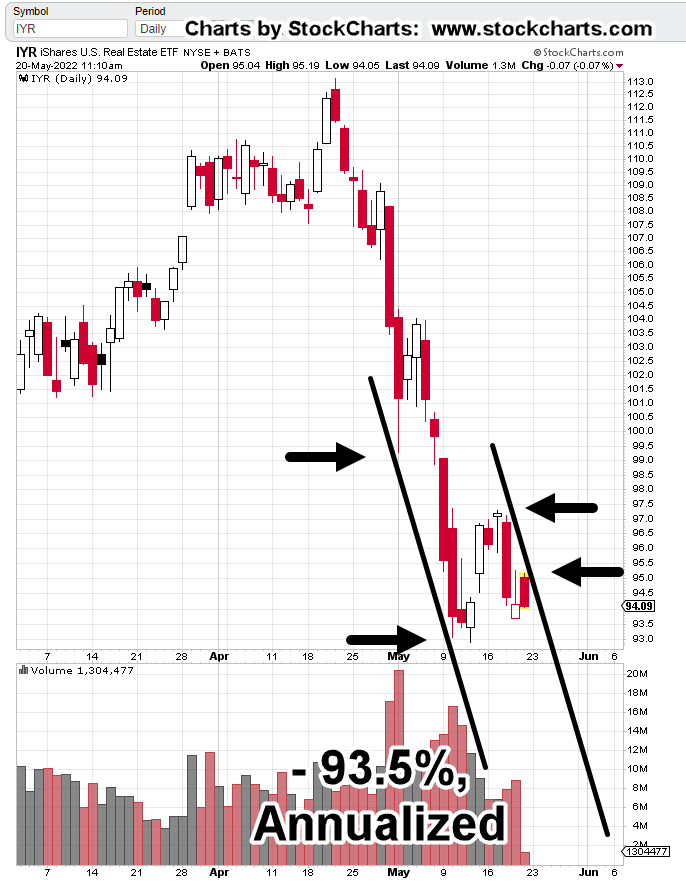
Does it really matter if IYR’s channel is at -99%, or -93.5%?
The sector’s going down fast; that’s the important part.
Unless there’s some kind of decisive, high-volume break to the upside, we’ve got IYR in a confirmed trading channel, declining at approximately – 93.5%, on an annualized basis.
The morning gap open in IYR, was higher as expected; sated in the pre-market report.
However, instead of reaching the 100%, ‘a-b-c’ target, where wave ‘a’ would be equal to wave ‘c’ (a common occurrence), the gap higher only reached a 61.8% target: indicating significant weakness.
The daily chart, has the situation as of 11:30 a.m., EST
Real Estate IYR, Daily
One thing that’s not happened yet … there is no new daily low for IYR.
It has not posted below yesterday’s low of 93.70.
That’s about the only factor that remains as potential upside for the sector.
If yesterday’s low is penetrated, then it weights probability significantly to the downside (not advice, not a recommendation).
Note: Posts on this site are for education purposes only. They provide one firm’s insight on the markets. Not investment advice. See additional disclaimer here.