Note: Posts on this site are for education purposes only. They provide one firm’s insight on the markets. Not investment advice. See additional disclaimer here.
Unfortunately, the (mad scientist) graphic at left, is not too far removed from what’s really going on in biotech.
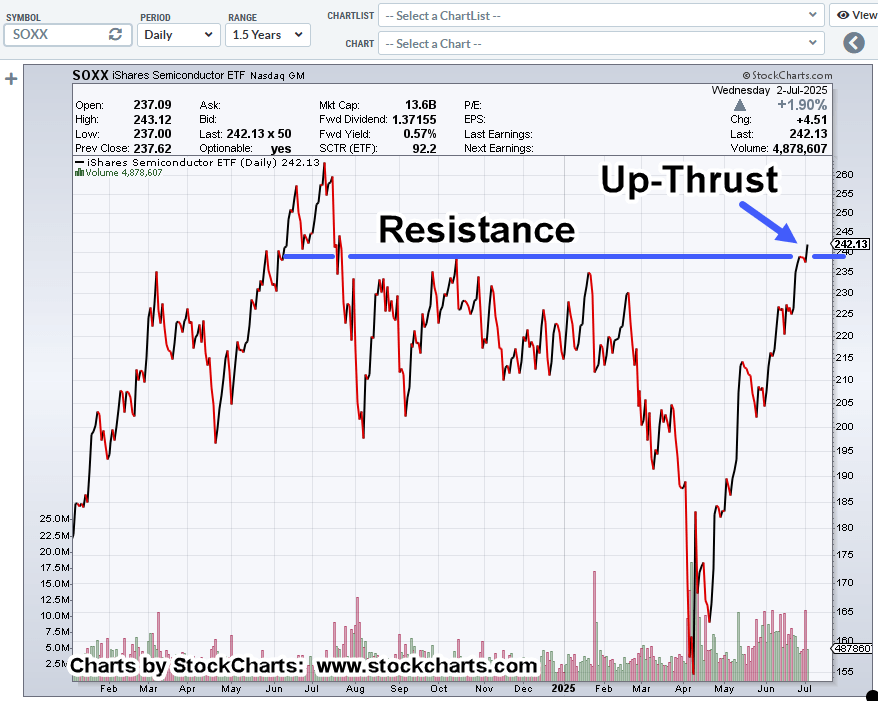
While the S&P, Nasdaq Qs, Gold Miners, Semiconductors, Financials, The HOOD, ORCL, and others, continue to make all-time highs, conspicuously absent is biotech, XBI and IBB.
Now, it appears that quietly, in the background, XBI is reversing to the downside.
Biotech XBI, Daily Close
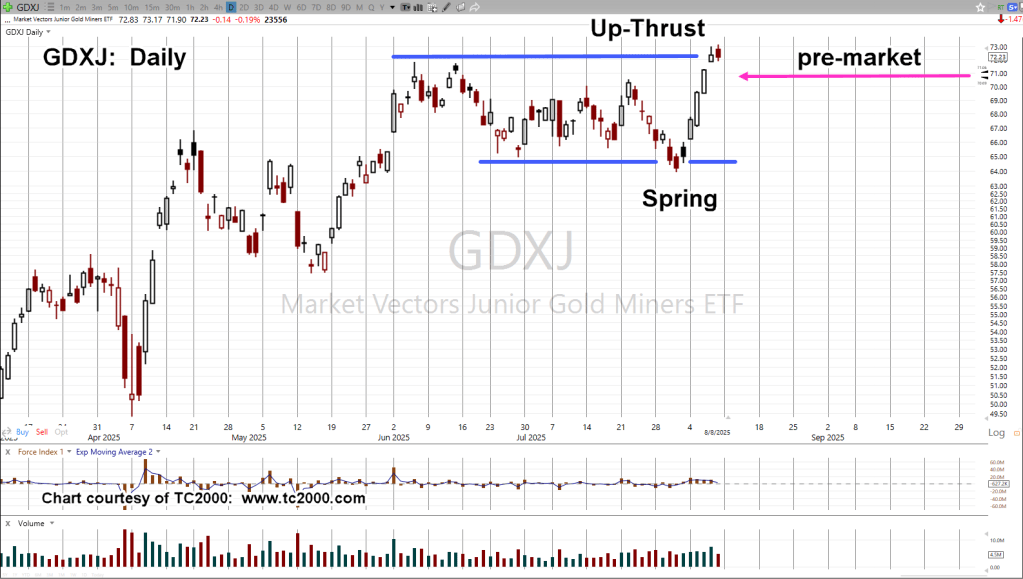
The up-thrust is there, but is a weak penetration of resistance.
Even so, on the ‘test’, volume contracted by -49.24%, when compared to volume on the upside penetration.
Until proven otherwise, this set-up appears to (currently) be the best short opportunity.
With that said, all other short positions have been closed to focus on biotech.
Leveraged inverse fund LABD is being used at this juncture: Trade LABD-25-10, with stop at the session low (not advice, not a reocmmendiaton).
Note: Posts on this site are for education purposes only. They provide one firm’s insight on the markets. Not investment advice. See additional disclaimer here.
Pre-market action (8:34 a.m., EST) shows a lower open.
If we open lower, the short entry objective, is to wait for action to move higher in an attempt to close the (potential) gap (not advice, not a recommendation).
Note: Posts on this site are for education purposes only. They provide one firm’s insight on the markets. Not investment advice. See additional disclaimer here.
Similar to yesterday’s update, showing a wedge pattern for CRWD, we have another (long term) wedge pattern in Agnico Eagle Mines (AEM).
Focusing on ‘strategy’, when market patterns show up, especially in the longer timeframes, we’ll take notice.
Before getting to the chart, here’s a compilation of Richie Naso quotes and insights that have been reviewed over the past week. It’s always good to hear thoughts from a renowned trader.
Note: Posts on this site are for education purposes only. They provide one firm’s insight on the markets. Not investment advice. See additional disclaimer here.
Note: Posts on this site are for education purposes only. They provide one firm’s insight on the markets. Not investment advice. See additional disclaimer here.
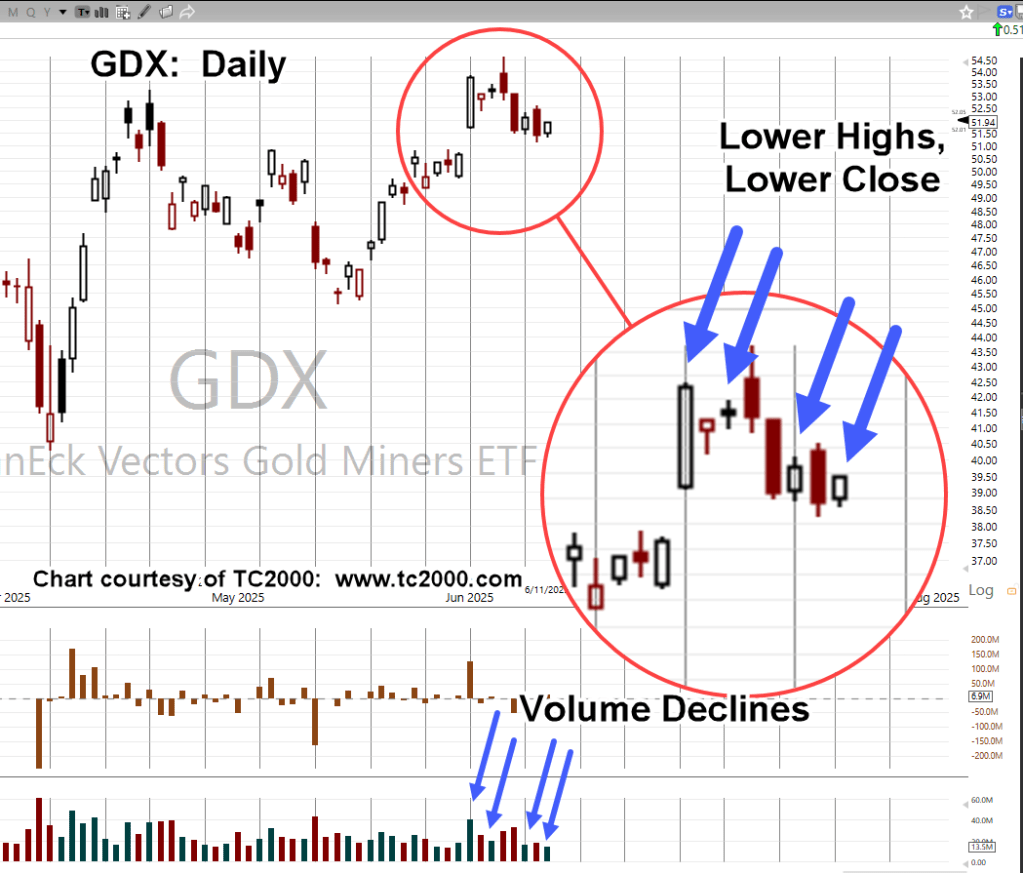
When looking at the price action of Senior Miners, GDX, you get the sense, ‘it had to be this way’.
That is, the only way to get up enough energy to close the gap shown below, was to have two successive (lower) ‘spring’ attempts.
Senior Miners, GDX, Daily
Yesterday’s action closed the gap.
What comes next is unknown, but we do have a ‘line in the sand’; that is, if miners (and gold) are to continue on a potential ‘hyperinflation breakout’, then, GDX must post a new daily high above yesterday’s 53.04, at some point.
Either way, Hard Stop of DUST-25-05, at 23.69 (not advice, not a recommendation).
Now, on to CrowdStrike.
CrowdStrike, CRWD, Daily
Yesterday’s action was ‘outside-down’.
We’re right at resistance, that will become support if CRWD, is able to rally from here.
If not, and CRWD posts (consistently) below resistance, then we’re at the top edge of a rising wedge pattern that’s been forming since July, of last year.
Note: Posts on this site are for education purposes only. They provide one firm’s insight on the markets. Not investment advice. See additional disclaimer here.
Note: Posts on this site are for education purposes only. They provide one firm’s insight on the markets. Not investment advice. See additional disclaimer here.
Note: Posts on this site are for education purposes only. They provide one firm’s insight on the markets. Not investment advice. See additional disclaimer here.
Silver’s in the long (decades long) awaited breakout to hyperinflationary heaven, or …
Door No. 2
Silver has met its Fibonacci target, ready for reversal, sideways action, or …
Door No. 3
None of the above.
Then, what about the Miners?
It looks like they (GDX) have already decided.
No sooner had Friday’s update been released, they appear to have reversed (not advice, not a recommendation).
Obviously, there’s a lot going on in the markets and it’s happening fast. We’ve already been told what’s (likely to be) coming.
Back to silver, SLV.
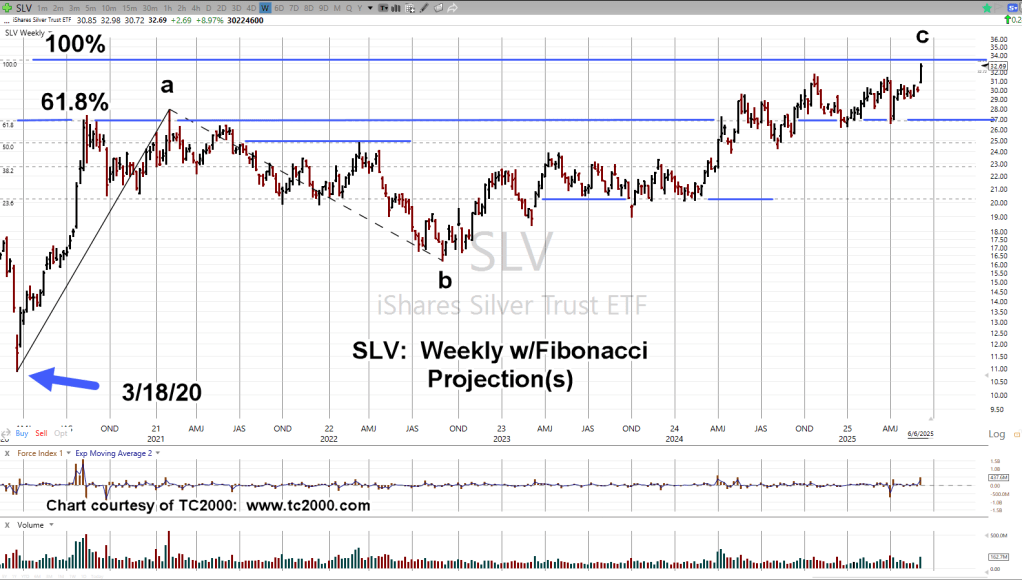
Silver SLV, Weekly
The chart shows what looks to be a corrective a-b-c (against the trend) move that’s lasted several years.
Note the ‘alternation’ of the moves.
Wave ‘a’ was dynamic, straight up. Next wave higher, wave ‘c’, is choppy and overlapping.
Moving in closer, we have the following.
The chart itself, says we’re back to the volume ‘spikes’ that typically occur (for SLV) at, or near, the end of a move (not advice, not a recommendation).
To add intrigue, note the massive downward thrust of Force Index during the ‘Tariff’ uproar.
Note: Posts on this site are for education purposes only. They provide one firm’s insight on the markets. Not investment advice. See additional disclaimer here.
Note: Posts on this site are for education purposes only. They provide one firm’s insight on the markets. Not investment advice. See additional disclaimer here.