Note: Posts on this site are for education purposes only. They provide one firm’s insight on the markets. Not investment advice. See additional disclaimer here.
First, it was Monday’s pre-market spike on (so-called) news of on-going ‘negotiations‘, which the other side says, didn’t happen.
Then, today, just after the close we have another spike on reports of a ceasefire.
While we’re at it, let’s add this into the mix, link here.
That last datapoint and maybe more like it to come, could be the real problem on a go-forward basis (not advice, not a recommendation).
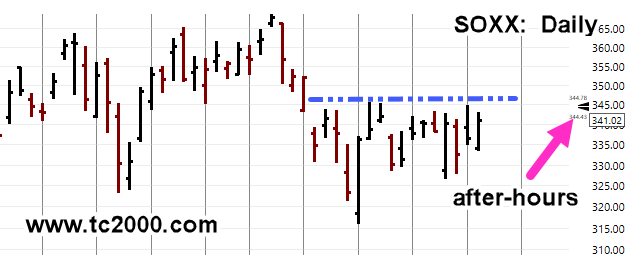
With all that said, the ‘spikes’ are helping to inch the SOXX higher. Tomorrow is Day 21, from all-time highs.
Semiconductors SOXX, Daily
We’re posting a segment of price action to show after-hours trading is higher, very near the blue resistance line.
A significant print above that line at the next session, would put the SOXX in up-thrust (potential reversal) position (not advice, not a recommendation).
Note: Posts on this site are for education purposes only. They provide one firm’s insight on the markets. Not investment advice. See additional disclaimer here.
Note: Posts on this site are for education purposes only. They provide one firm’s insight on the markets. Not investment advice. See additional disclaimer here.
Note: Posts on this site are for education purposes only. They provide one firm’s insight on the markets. Not investment advice. See additional disclaimer here.
CORN had been moving steadily higher for nearly two years.
Using Wyckoff and Fibonacci, the (potential) top and retrace was identified one week before it actually happened.
The last update on CORN, with chart analysis was here.
Fast forward to this post; commodities pivoted, and appear to be moving higher in relative unison.
So, what happens now?
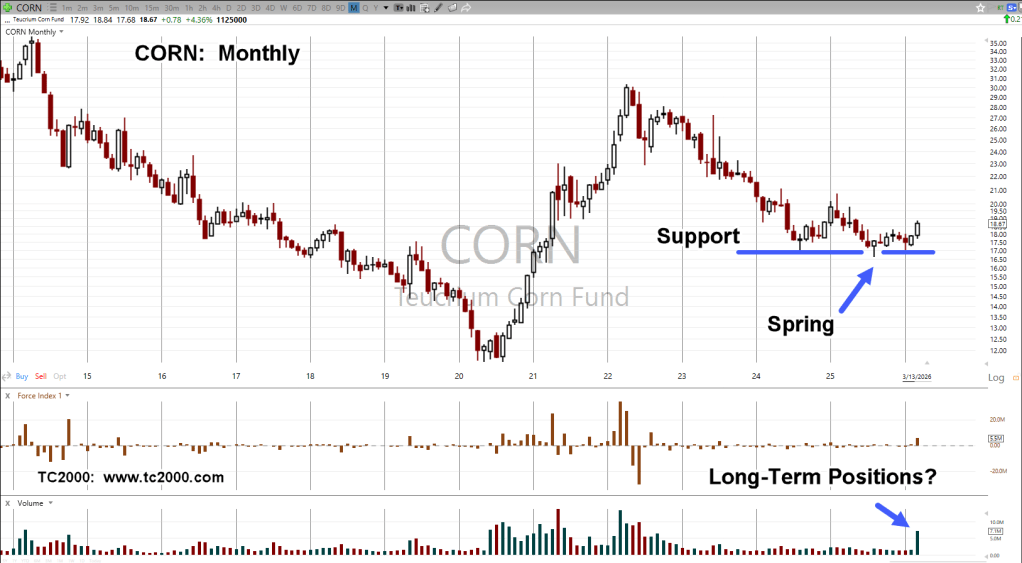
Teucrim Fund, CORN, Monthly
The ‘magenta’ arrow shows the location of the April post.
Moving on to the right-side, CORN held below support for seven months before pivoting higher.
If the labeling is correct, we have what looks to be a Wyckoff ‘spring’ set-up (not advice, not a recommendation).
That amount of time below support seems a bit of a stretch for labeling it as a ‘spring’.
Has that ever happened before?
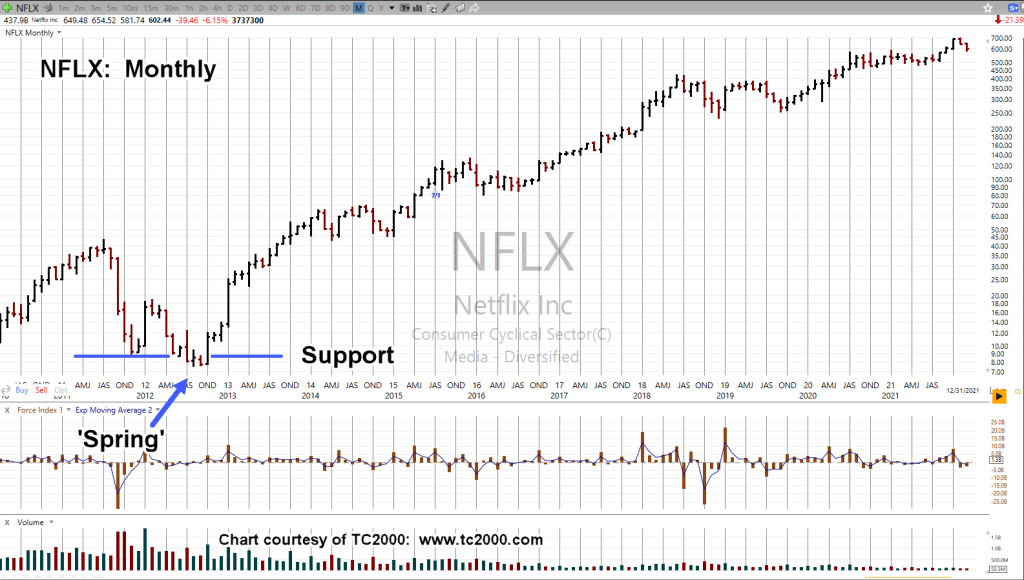
Case in point, Netflix
Netflix NFLX, Monthly
Depending on how it’s measured, back in 2012, NFLX, printed below support three-to-five months, before moving higher … in a big way.
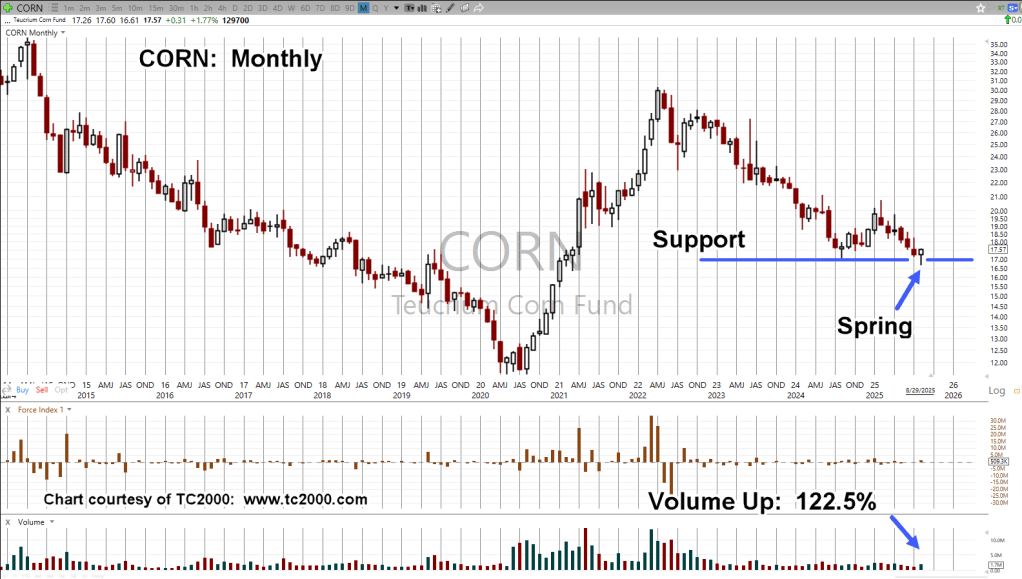
With the chart of CORN, it’s unknown if we’ll get a ‘test’ of the breakout (purple oval).
At this point, there’s so much uncertainty in the financial markets as well as commodities, one needs to at least consider the possibility of a ‘test’.
Note: Posts on this site are for education purposes only. They provide one firm’s insight on the markets. Not investment advice. See additional disclaimer here.
Let’s go all the way back (nearly four years ago) to this post, and the following:
“Think of the irony. The ‘stackers’ (and maybe the rest of us), having to exchange actual money, gold and silver, for worthless fiat just so they/we can buy food to stay alive.”
Fast forward to now and this link, time stamp: 6:35.
How close is that to the post from way back when?
Strategy, First
The About section presents the priorities of this site.
Strategy, Tactics, Focus; with three market masters, that were masters of each.
The insight, years ago, was that we’re in a situation not unlike that of Genesis 41. It’s the food supply first, then gold and silver (not advice, not a recommendation).
With updates like this just out, it’s becoming clear, food is the focus (not advice, not a recommendation).
Silver Update
The last update on silver (SLV) was back in early October, link here.
Silver’s down over -16%, since then.
It’s even worse for the bulls, including the Rod Stweart reference:
Note: Posts on this site are for education purposes only. They provide one firm’s insight on the markets. Not investment advice. See additional disclaimer here.
Since Wyckoff analysis doesn’t care about the press, we’ll use it to discern the (potential) truth.
Let’s see how it did in the recent past. The Nat-Gas (UNG) low, was identified to-the-day,link here.
From that post, was this:
“Downward thrust in Nat-Gas UNG, appears to be exhausting itself after a 20-month, bear market.Risk is never zero, but currently appears to be at a low … “
So, it was. Afterwards, UNG bounced near, but never touched that low.
Twelve trading days later (Fibonacci 13 days, from low), it reversed decisively to the upside.
The Same, But Not
On the medium, to long-term, CORN action is the same as biotech (XBI), but opposite.
Instead of an up-thrust two-years in the making, we may have a spring set-up, taking just as long if not longer.
Note: Posts on this site are for education purposes only. They provide one firm’s insight on the markets. Not investment advice. See additional disclaimer here.
It’s been a while since rounding up The Usual Suspects.
However, like last time, the stupidity, misdirection, misinformation, outright falsehoods, overall grift and schtick, has got to the point where an update is needed.
We’ll start off by repeating No. 1 from the prior ‘suspects’ as it encompasses the whole genre of ‘non-thought’ by the public and financial press alike; readers of this post excepted, of course. 🙂
No 1. There (still) is no Fed Pivot. Seriously, have rates really, actually been lowered? Everyone has a huge case of ‘normalcy bias’. i.e., what the Fed did last time will happen this time.
The 40-year bond bull market from the ’80s, ended in 2020. We’re in a different paradigm now.
We’ll add in this updated post, James Grant, of Grant’s Interest Rate Observer.
He second’s the motion: The 40-year bond bull market, is over. Period.
Note: Posts on this site are for education purposes only. They provide one firm’s insight on the markets. Not investment advice. See additional disclaimer here.
If there’s one market attracting huge numbers of grifters, carpetbaggers, peddlers, and all-around crazies, it’s precious metals.
I’ve been hearing from this crowd, ‘the government’s going to collapse, the dollar’s going to collapse’, since the early 1980s.
As said many times before, I like precious metals as much as the next guy.
However, from a strategy standpoint, with each passing day, we see it’s the food supply (here, and here) that comes first (not advice, not a recommendation).
What’s currently taking place is so much more complicated (in my opinion) than just ‘stacking’.
Let’s not forget the flood of ‘fake’ or ‘diluted‘ precious metals and other chicanery; like having your coin-shop bank account closed for no apparent reason.
Well, we have to keep the loonies on the path which brings us to our case in point, Newmont Mining, NEM.
Newmont, Good News is Bad News
Gold price has moved higher over the past four to five months and expectedly, that’s been noted in Newmont’s latest Quarterly release, link here.
NEM, stock price at ‘nine-month highs’, what’s not to like?
It’s when we look at the chart, we see a different story.
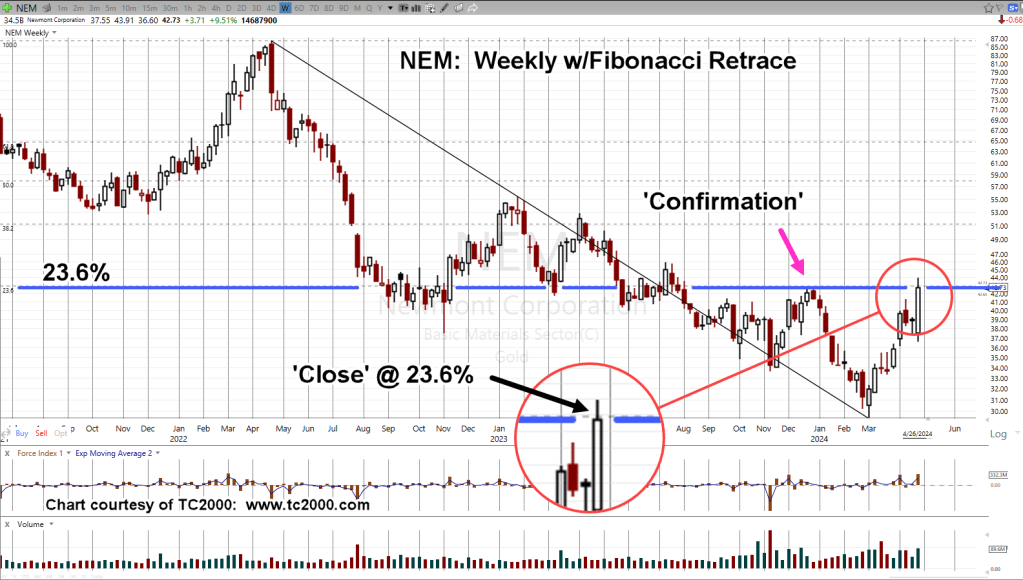
Newmont Mining, NEM, Weekly
After all the ‘good news’, NEM has only retraced an anemic 23.6%, of its overall downside move.
Note the close on Friday was right at the 23.6% level, giving it even more significance.
This level has also become an ‘axis line’ as exhibited by price action going back to August of 2022.
By The Numbers
When looking through the major sectors, retrace (and reversal) from 23.6%, is becoming more frequent.
Two other indices posting and reversing from that level (measured from recent highs), are biotech XBI, and real estate, IYR.
NEM, What’s Next?
Thursday, 4/25, was a wide bar with heavy volume.
We’ve stopped at the retrace, which is also resistance, confirmed by price action in late December. ’23.
A reasonable expectation is NEM, retraces, testing the wide bar and volume before continuing to the downside or moving back higher to a breakout (not advice, not a recommendation).
Note: Posts on this site are for education purposes only. They provide one firm’s insight on the markets. Not investment advice. See additional disclaimer here.
“What we’re looking for here, is some kind of Jimmy Carter type stunt where corn exports are halted in the name of ‘national security’ or some such thing.”
Corn Tracking Fund CORN, Weekly
Two Fibonacci projections are overlaid on the chart.
First, a simple retrace starting near ‘Derecho’ lows, to highs set during the week of April 29th, 2022.
Second, a counter-trend projection from those highs to the intermediate lows set during week of May 19th, 2023 and highs of June 23rd, week, the same year.
CORN has retraced 61.8%, which is also the 1:1 counter-trend projection. In addition, it’s the measured move from the wedge break.
The market has effectively confirmed the support area.
Oil Goes Negative … And Corn?
Remember that ‘anything can happen’. Oil futures made history by going negative.
We’re in a new construct, a new paradigm, our strategy should match accordingly.
Everyone has their own perspective and plan for the markets; fair enough.
From here, CORN could continue to new, all-time highs.
However, for my accounts, I’ll wait until such time it appears the downside risk is removed as much as possible.
One potential area for that ‘removal’ is the 76.4%, retrace in the vicinity of CORN @ 16 (not advice, not a recommendation).
Note: Posts on this site are for education purposes only. They provide one firm’s insight on the markets. Not investment advice. See additional disclaimer here.