The graphic at left, is a segment of biotech tracking ETF, XBI.
Note how it exhibits a repeating pattern of spring-to-up-thrust (S & U).
Today is also Fibonacci ‘Day 5’, from the ‘S’ labeled low.
As seen with gold GLD, slightly higher, not correcting immediately, anything can happen.
However, with XBI, we’re in a multi-year downtrend that may be finishing its countertrend move, ready to up-thrust and reverse lower (not advice, not a recommendation).
Note: Posts on this site are for education purposes only. They provide one firm’s insight on the markets. Not investment advice. See additional disclaimer here.
Note: Posts on this site are for education purposes only. They provide one firm’s insight on the markets. Not investment advice. See additional disclaimer here.
Unfortunately, the (mad scientist) graphic at left, is not too far removed from what’s really going on in biotech.
While the S&P, Nasdaq Qs, Gold Miners, Semiconductors, Financials, The HOOD, ORCL, and others, continue to make all-time highs, conspicuously absent is biotech, XBI and IBB.
Now, it appears that quietly, in the background, XBI is reversing to the downside.
Biotech XBI, Daily Close
The up-thrust is there, but is a weak penetration of resistance.
Even so, on the ‘test’, volume contracted by -49.24%, when compared to volume on the upside penetration.
Until proven otherwise, this set-up appears to (currently) be the best short opportunity.
With that said, all other short positions have been closed to focus on biotech.
Leveraged inverse fund LABD is being used at this juncture: Trade LABD-25-10, with stop at the session low (not advice, not a reocmmendiaton).
Note: Posts on this site are for education purposes only. They provide one firm’s insight on the markets. Not investment advice. See additional disclaimer here.
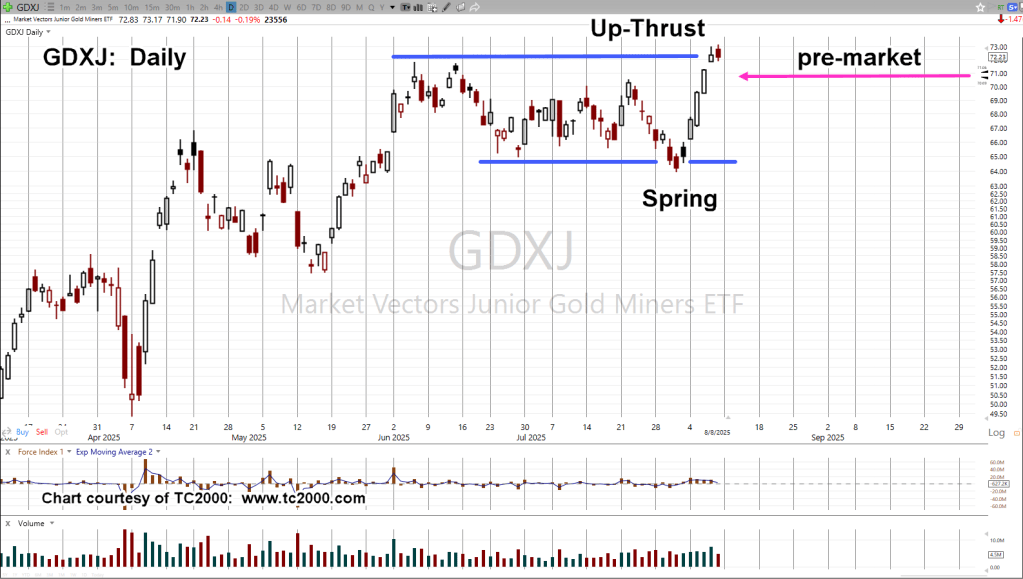
When looking at the chart of Junior Miners, GDXJ, it’s possible we could be in the midst of a massive terminating wedge ‘throw-over’ (not advice, not a recommendation).
We’re about an hour before the close; GDXJ, price action is beginning to retreat off its session highs.
Junior Miners, GDXJ, Weekly
Upward thrust (Force) is dissipating.
If action enters back into the wedge pattern, it’s typically viewed as a sell, or sell short signal (not advice, not a recommendation).
Note: Posts on this site are for education purposes only. They provide one firm’s insight on the markets. Not investment advice. See additional disclaimer here.
Gold, silver, and the S&P are essentially unchanged (as of 6:44 p.m., EST).
Although it appears to be a quiet weekend, we should at least take note of the terminating wedge pattern in the S&P.
The S&P is probably the most computer controlled, most manipulated, most algorithmed (if that’s a word) market in the world.
From a personal standpoint, I do not trade it and have not for over 15-years.
There are better ways to engage and not volunteer oneself to get whacked every day by a mass of computer algorithms (not advice, not a recommendation).
With that said, we’ll look at it anyway. 🙂
S&P 500, SPY, Daily (segment)
We’re oscillating into a wedge pattern. A wedge typically occurs at the end of a move, whether it be up or down.
With the Nvidia earnings release out of the way, the tone of the overall market may have changed.
Note: Posts on this site are for education purposes only. They provide one firm’s insight on the markets. Not investment advice. See additional disclaimer here.
Pre-market action (8:34 a.m., EST) shows a lower open.
If we open lower, the short entry objective, is to wait for action to move higher in an attempt to close the (potential) gap (not advice, not a recommendation).
Note: Posts on this site are for education purposes only. They provide one firm’s insight on the markets. Not investment advice. See additional disclaimer here.
Looking at the silver contract, SIU25, it shows the past two weeks have closed lower.
Last week’s session low was 38.1.
Tonight’s session low (as of 7:38 p.m., EST) is just ticks away at 38.135.
While gold and silver appear to be under some pressure, there’s no definitive trade setup (an opinion), so, we’re going to focus instead on the A.I., mania sector, the SOXX.
Semiconductors, SOXX, Daily Close
The most recent recovery high and short set-up has already been covered here and here (not advice, not a recommendation).
What the chart shows, is the reasonable expectation, either the SOXX, is going to test resistance (moving higher) like Carvana did, link here, or down to test support.
Currently positioned short as SOXX-25-08 (not advice, not a recommendation).
Note: Posts on this site are for education purposes only. They provide one firm’s insight on the markets. Not investment advice. See additional disclaimer here.
Similar to yesterday’s update, showing a wedge pattern for CRWD, we have another (long term) wedge pattern in Agnico Eagle Mines (AEM).
Focusing on ‘strategy’, when market patterns show up, especially in the longer timeframes, we’ll take notice.
Before getting to the chart, here’s a compilation of Richie Naso quotes and insights that have been reviewed over the past week. It’s always good to hear thoughts from a renowned trader.
Note: Posts on this site are for education purposes only. They provide one firm’s insight on the markets. Not investment advice. See additional disclaimer here.
There’s been plenty of coverage over the past week, about silver’s apparent ‘breakout’.
We may have a sustainable breakout, or there may be something else in the works.
As of this post, silver futures opened essentially unchanged, edging slightly higher (as of 7:04 p.m., EST).
With that said, we’ll look at the longer-term view of silver and specifically, the ETF tracking fund, SLV.
Silver SLV, Weekly
The smaller (magenta) wedge pattern at left of the chart, shows a sustained breakout.
That move culminated in the blow-off top, late April 2011.
From the initiation of the breakout (week of 8/27/10), to the first retrace was a Fibonacci 8-Weeks of higher highs, and higher closes.
There was a small amount of congestion for one month, in January 2011. Then, SLV continued on higher.
On a monthly scale, silver SLV, essentially went straight up for a Fibonacci 8-months with only one month lower, a total duration of 9-months.
You can almost see where this is going.
With the current ‘breakout’ (if we’re in one), the market may post an impulsive move, or alternate (from the prior wedge breakout) with some kind of choppy action.
As the chart implies, we’re at The Danger Point®, where price action’s hovering between a wedge pattern breakout, or throw-over.
Note: Posts on this site are for education purposes only. They provide one firm’s insight on the markets. Not investment advice. See additional disclaimer here.
Note: Posts on this site are for education purposes only. They provide one firm’s insight on the markets. Not investment advice. See additional disclaimer here.