Note: Posts on this site are for education purposes only. They provide one firm’s insight on the markets. Not investment advice. See additional disclaimer here.
Carvana, launched itself above resistance at Friday’s close. In so doing, got itself into another wedge.
Now we have Expedia, looking eerily similar (not advice, not a recommendation).
Like eBay, we’ll start with the long term, quarterly chart.
Expedia EXPE, Quarterly
The latest earnings release pushed EXPE up, contacting the upper trendline.
A gap higher and close of +17.55%, in one day.
EXPE has since backed off the all-time high; currently down about -8.5%.
Edge of The Wedge
The following is a partial list of tickers either forming a (monthly) terminating wedge, or have broken out to the downside (not advice, not a recommendation)
Note: Posts on this site are for education purposes only. They provide one firm’s insight on the markets. Not investment advice. See additional disclaimer here.
CORN had been moving steadily higher for nearly two years.
Using Wyckoff and Fibonacci, the (potential) top and retrace was identified one week before it actually happened.
The last update on CORN, with chart analysis was here.
Fast forward to this post; commodities pivoted, and appear to be moving higher in relative unison.
So, what happens now?
Teucrim Fund, CORN, Monthly
The ‘magenta’ arrow shows the location of the April post.
Moving on to the right-side, CORN held below support for seven months before pivoting higher.
If the labeling is correct, we have what looks to be a Wyckoff ‘spring’ set-up (not advice, not a recommendation).
That amount of time below support seems a bit of a stretch for labeling it as a ‘spring’.
Has that ever happened before?
Case in point, Netflix
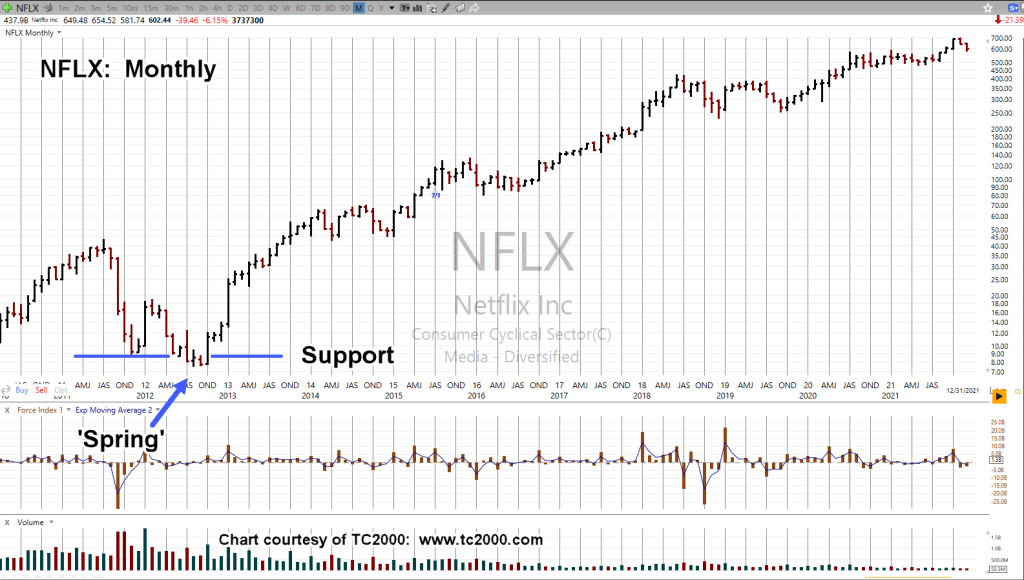
Netflix NFLX, Monthly
Depending on how it’s measured, back in 2012, NFLX, printed below support three-to-five months, before moving higher … in a big way.
With the chart of CORN, it’s unknown if we’ll get a ‘test’ of the breakout (purple oval).
At this point, there’s so much uncertainty in the financial markets as well as commodities, one needs to at least consider the possibility of a ‘test’.
Note: Posts on this site are for education purposes only. They provide one firm’s insight on the markets. Not investment advice. See additional disclaimer here.
Note: Posts on this site are for education purposes only. They provide one firm’s insight on the markets. Not investment advice. See additional disclaimer here.
What can’t be controlled is when the ‘broke’ part shows up.
We can, however, discern a potential inflection point … or, points.
In the case of Netflix (NFLX), that inflection appears to be happening now (not advice, not a recommendation).
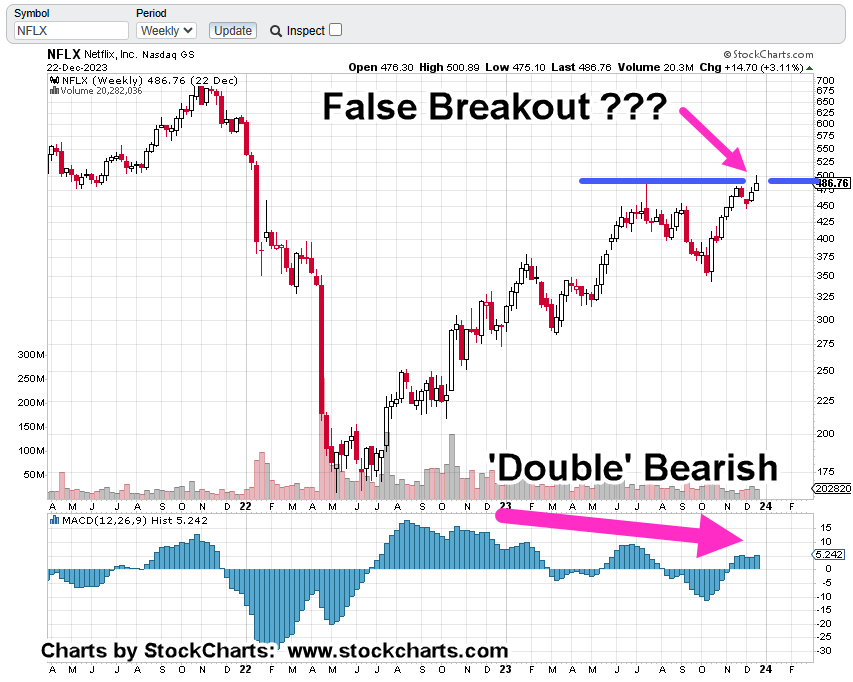
Netflix NFLX, Weekly
Two weekly charts are shown.
The first has the terminating wedge, tentatively confirmed with last week’s new weekly low (below NFLX: 348.71).
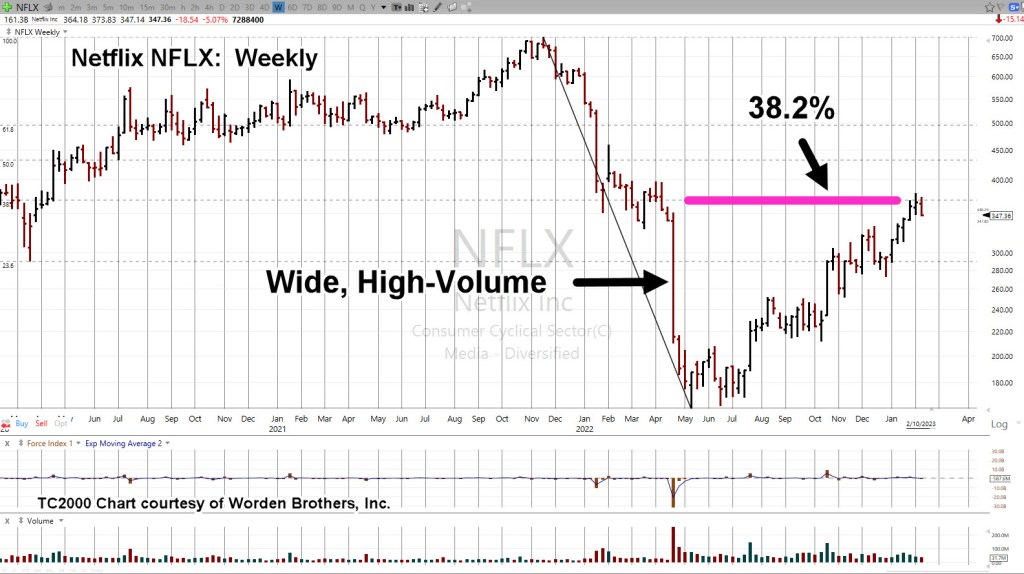
The second chart shows the Fibonacci retrace to the 38.2% level; if there’s a reversal and the level holds, it indicates weakness and higher probability for continued downside action.
Note how the wide, high-volume bar of week ending 4/22/22, has been completely retraced.
This is what markets do; they tend to come back and test wide, high-volume areas.
In the case of NFLX, that test required about 40-weeks to accomplish.
Summary & Strategy
Price action itself will define the potential strategy (not advice, not a recommendation).
Based on where the overall markets closed on Friday, the expectation is for more downside action at the next open, then followed by a retrace that day, or the next.
If it happens, we’ll look at NFLX, on the daily chart for additional set-up clues.
Note: Posts on this site are for education purposes only. They provide one firm’s insight on the markets. Not investment advice. See additional disclaimer here.
There tends to be a period of consolidation and organized chaos, before price action enters and exhibits channel behavior.
Of course, the problem from a trading perspective, be able to wait through the chaos getting to the set-up and that’s no small feat.
Several of the major indices are in a channel right now. Those are (ETF symbol) SPY, QQQ, IYR and IWM.
We’ll discuss the Q’s farther down but first, this just out, on ZeroHedge, concerning the overall economic conditions.
That is, we’re already in full scale economic collapse and they have the data to prove it.
As incredible as it may be, there are still sectors of the population that believe, ‘the consumer is strong’.
A big wake-up call is coming for them. Oh wait, is that a telephone ringing off in the distance 🙂
The media lies appear to be crumbling at an exponential rate; there’s no guarantee it’ll all hold together into late January, or mid-February as presented only yesterday.
From a Nasdaq (QQQ), technology sector perspective, we have the following.
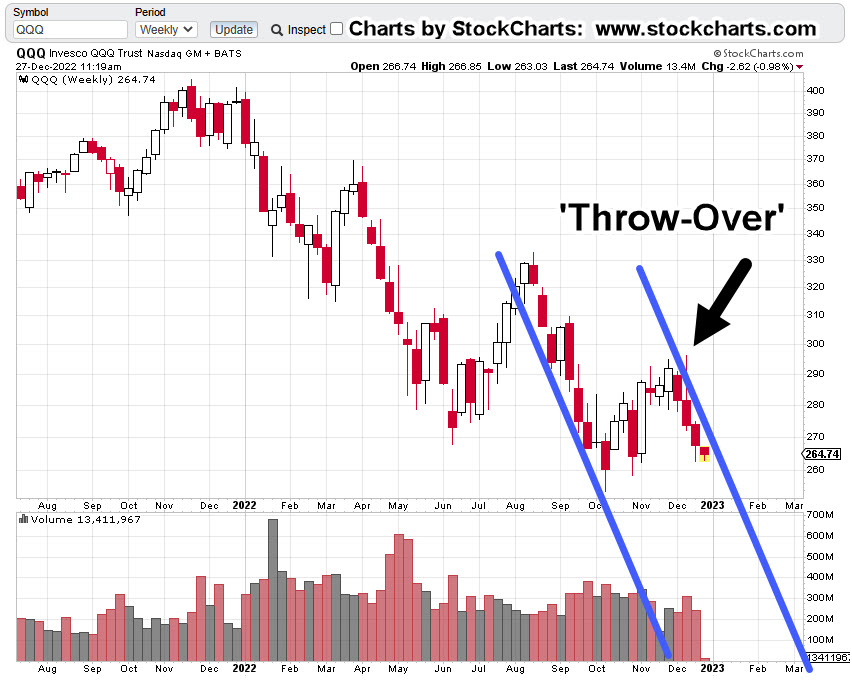
NASDAQ QQQ, Weekly
The Q’s began the week with a lower open and within the range of the prior week.
It’s a subtle clue the direction remains down and the market’s not volatile … just yet.
Next up, is the channel
It has the right ‘look’.
Moving in closer; the right-side trend line verification (hits).
There are no fewer than four weekly hits (including today) that verify the right side. The attempted push out of the channel is identified as the ‘Throw-Over’.
Attempted breakouts (and failures) are common market behaviors. We see that price action quickly got itself back into the channel.
Get In … Get Out
At this juncture, price action remains in the channel.
A short position (via QID, or equivalent) is a viable choice for the trader/speculator (not advice, not a recommendation).
For the reasons described above (the collapse), we appear to still be in the early stages of the down channel.
Obvious discretionary exit points for a short trade would be left side contact of the channel i.e., the ‘demand’ side or a decisive right-side breakout i.e., the ‘supply’ side (not advice, not a recommendation).
Summary
In a separate market, Netflix (NFLX), may have hit the right side of its own tend line as well.
Note: Posts on this site are for education purposes only. They provide one firm’s insight on the markets. Not investment advice. See additional disclaimer here.
During 2022, we’ve had one short squeeze after another.
For 2023, it could be forced liquidation in the relentless squeeze for cash.
One corporate example of the squeeze is the announcement from CarMax; they’ve suspended their stock buybacks.
This ‘buy-back halt’, theme, needs to be added to the market strategy for the coming year.
We can put that on the list right along with skipped dividends, power outages, market outages, internet cyber-attack and supply chain disruptions.
A comment below, posted in yesterday’s update from Jerrimiah Babe, opines the typical consumer’s going to carry on unabated, until the very last minute.
“I don’t believe most people will stop spending until all access to credit is exhausted. Whether it be cards, after-pay, family, theft most will continue to keep up appearances. I honestly think most could be 2 months behind on their mortgage or rent and still be spending on crap. There’s no financial responsibility or discipline anymore.”
How that may translate to the mainstream is, they continue to report ‘the consumer is strong’ until instantly, overnight, they’re not.
Possible timing for that event may be late January, or mid-February (not advice, not a recommendation).
With all that in mind, the last post identified Netflix and Target, as potential candidates for significant downside opportunity.
‘Significant’, meaning a 50% to 90% decline from current levels (not advice, not a recommendation).
Target TGT, Yearly
The year is just about over so let’s start with a very long-term view.
Two things have happened over the past three-years.
Price action has met a measured move out of the wedge as shown; then, a massive downward thrust.
It’s important to note, this year’s down-thrust, dwarfs the previous one during the -64.7%, decline of ’07 – ’09.
There’s a band of support that’s at least nine-years wide, in the vicinity of 50 – 75.
We’ll discuss that in another update.
Netflix NFLX, Yearly
Technically, Netflix is worse than target. That is, it has the potential to decline farther and faster.
NFLX, has support as well but comparatively minor in the area of 50.
It does not become significant until the wedge (blue lines) in the vicinity of 5 – 10.
With Netflix’s ‘product’ being completely discretionary, it’s ultimate downside potential, from a fundamental standpoint, surpasses that of Target.
Summary
Time permitting, shorter timeframes will be presented.
However, since the primary focus of this site, is first on ‘strategy’ (think dollar rally), we’re interested in the larger timeframes.
That in turn, provides background to drill down further for any trade decisions (not advice, not a recommendation).
Note: Posts on this site are for education purposes only. They provide one firm’s insight on the markets. Not investment advice. See additional disclaimer here.
As a digression; in Texas, we’re just now coming out of yet another record-breaking cold spell.
That’s two, never before seen record breaking low temp events within the past three years!
How does that fit with the global warming narrative?
Anyone awake knows full well what’s going on … and it’s not global warming.
Who’s On First: NFLX or TGT?
Now that vending machine Carvana (CVNA), is out of the way, who’s next?
Partly as a result of economic decline and partly from the decision to take consumer spending elsewhere, Netflix and Target now appear ready to continue their implosion.
More on their technical chart conditions in the next update.
Note: Posts on this site are for education purposes only. They provide one firm’s insight on the markets. Not investment advice. See additional disclaimer here.
Within the mirage of fake data, one thing’s not fake, the price.
The latest revelation about fake data, comes at this link, telling us something we already knew; the jobs data is a complete mirage.
What must be over a year ago, Neil McCoy–Ward, presented a series whereby he reviewed several individual, personal diaries, from The Great Depression.
From that series, no-one (in the public) seemed to know the extent of unemployment until much later.
The numbers were ‘hidden’ back then, just like now; what a coincidence.
The search, and need for the ‘truth’, becomes more clear by the day. In the markets, truth is the price and price only.
Apparently driving it home, revelation that chief cook and (woke) bottle washer Netflix, drank the Kool-Aid and overestimated advertising demand.
The last update on NFLX, stated there may be a rally to test the breakdown. So far, it hasn’t happened.
Last Thursday’s – 8.6%, ‘air-pocket’, may have been the kick-off to much lower prices (not advice, not a recommendation).
Let’s take another look at the big picture on Netflix.
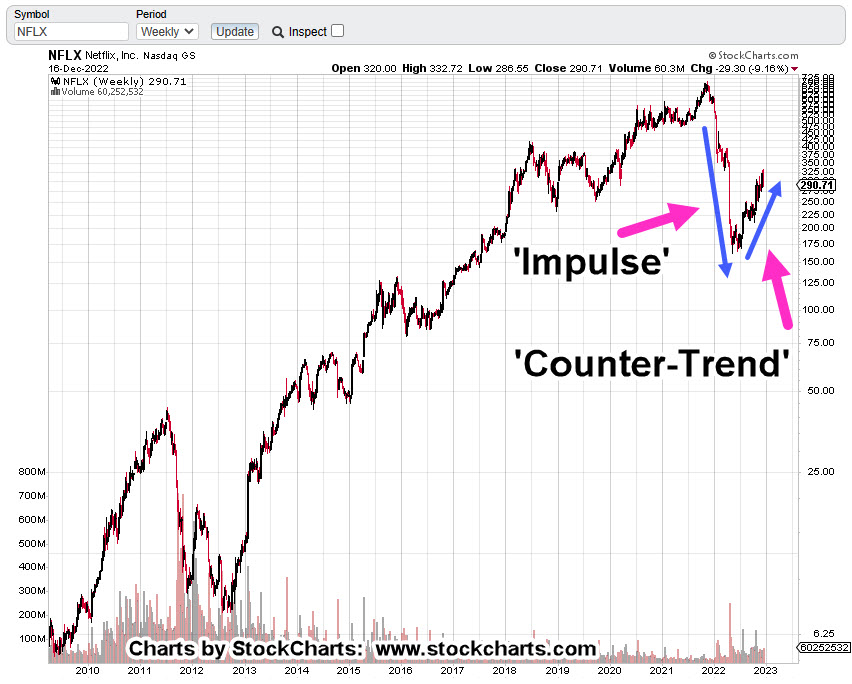
Netflix NFLX, Weekly
Very quickly we see the overall (impulsive) direction of the market is down.
In Wyckoff terms, there’s what he called ‘ease-of-movement’, to the downside.
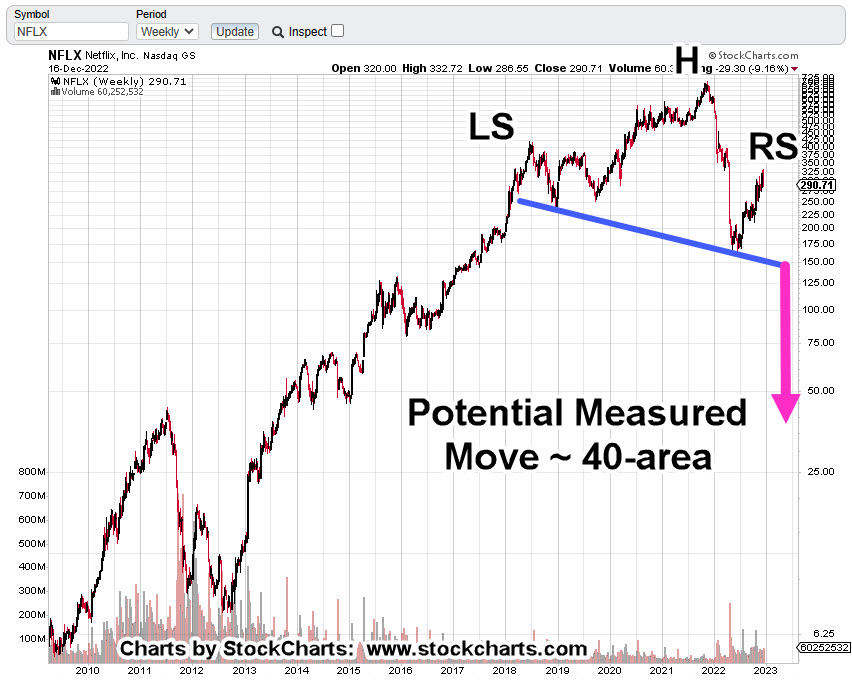
Next, we have a possible Head & Shoulders, top.
If NFLX, reverses from here all the way down to the neckline (blue line), and if it breaks that line, then we target the 40-area; that’s a lot of ‘ifs’.
Moving in closer on the daily chart, is the following:
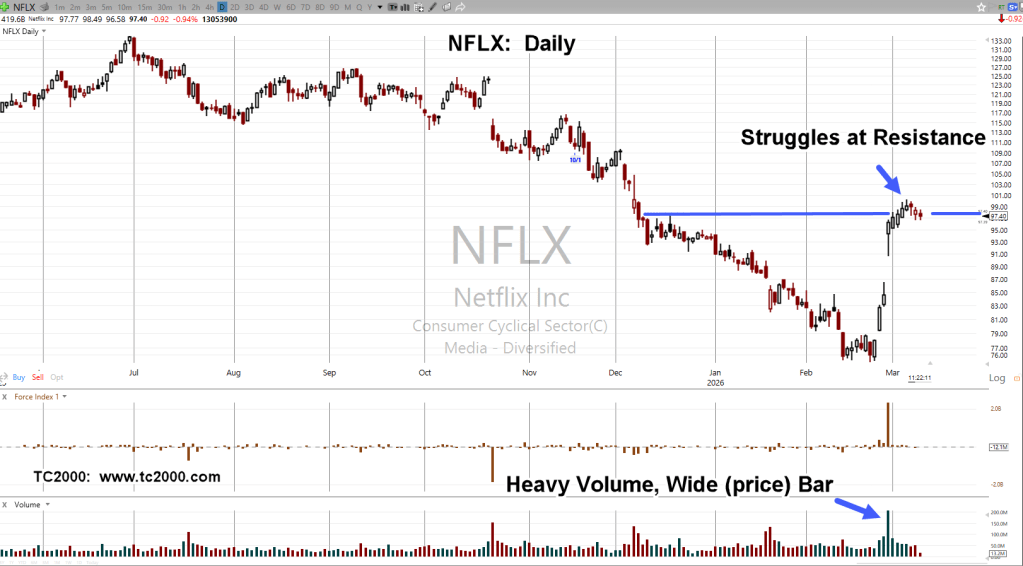
Netflix NFLX, Daily
The wedge breakdown is clear.
There was an attempt to rally, if you can call it that, on Friday. So far, no significant upside action.
The zoom area shows price action still below the lower wedge boundry.
Netflix is different from our other potential implosion, short candidate (which proved correct), Carvana, CVNA.
That difference, Carvana sold a product for which there was an actual need, i.e., transportation.
Summary
It’s been just over a year since the CVNA, ‘No P/E’, report.
Carvana’s a slow-motion train-wreck; down over -98%, as of Friday’s close.
Note: Posts on this site are for education purposes only. They provide one firm’s insight on the markets. Not investment advice. See additional disclaimer here.
Well, ladies and gentlemen, we have a completely discretionary (spending) business, that looks ready to resume its downtrend.
As the American public is forced to figure out what they need and what they don’t, paying for streaming movies can be eliminated from the ‘must haves’, with ease.
We’ll look at the big picture first to see what’s actually happening.
Netflix (NFLX) Weekly
The massive downward thrust (dropping over -35%) on April 20th, this year, created a huge gap on the daily chart.
The weekly shows it took thirty-two weeks to fill the gap, starting from the April lows.
The next chart has a terminating wedge, similar to gold (GLD) as discussed previously.
The daily chart shows the wedge close-up.
The lower trendline has been decisively penetrated and action is currently thrusting lower.
We’re at mid-session, 1:12 p.m., EST.
As NFLX, heads into the close, it’s possible there may be an attempt to rally, testing the lower wedge boundary (not advice, not a recommendation).
Note: Posts on this site are for education purposes only. They provide one firm’s insight on the markets. Not investment advice. See additional disclaimer here.