Silver … Sold Out !

… And The Bulls Are Trapped

How is it possible to have silver stocks sold out here and here, yet silver bears have trapped the bulls.

As we’ll show below, this morning’s action in SLV, has confirmed the reversal; a Wyckoff up-thrust, pointing silver’s probability to lower levels.

For starters, let’s recap on how this (trading) game is played.

That is, the public i.e., the masses, need to be led to and fro so they are continuously on the wrong side of the trade.

That’s it.

So it is with precious metals and specifically silver.

The media came out recently, effectively telling everyone ‘Now is the time to buy gold’.

Where were these guys in 2001, when gold bottomed around $271/oz.

No, they show up at the end of the move … not the start.

Public Buys Hype, Not Facts

So the public has bought into the hype and run the silver coffers dry. Everyone excepts an immediate currency collapse and certainly anything can happen.

However, as Undedicated Economist points out, the dollar strength (first identified in this post) can last for years.

The original (bullish reversal) analysis is now supported by the facts; it’s been nearly two-years since that post and the dollar (UUP) is still headed higher.

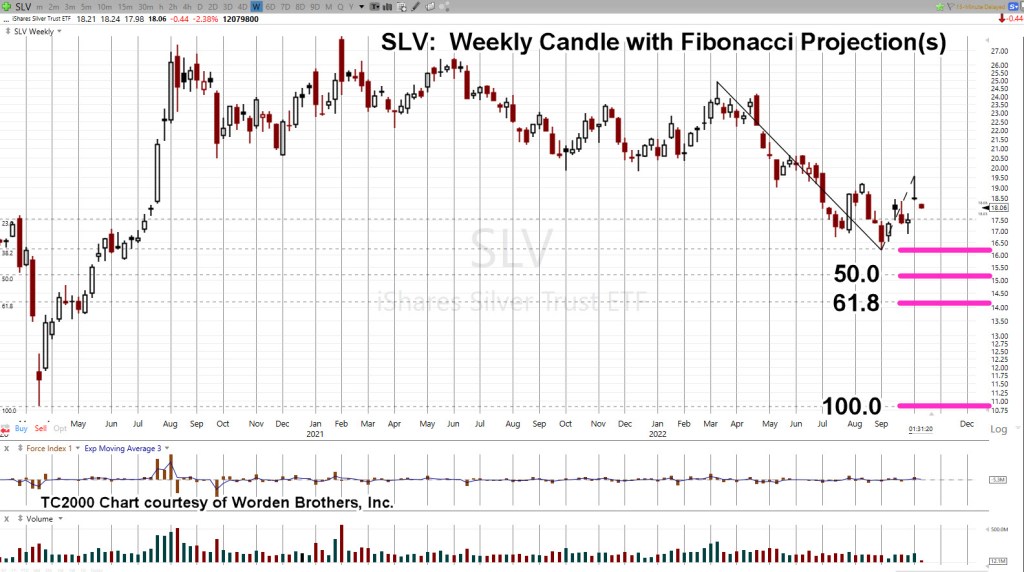
So, let’s find out where silver is likely to go. For that, we go to the weekly chart.

Silver SLV, Weekly

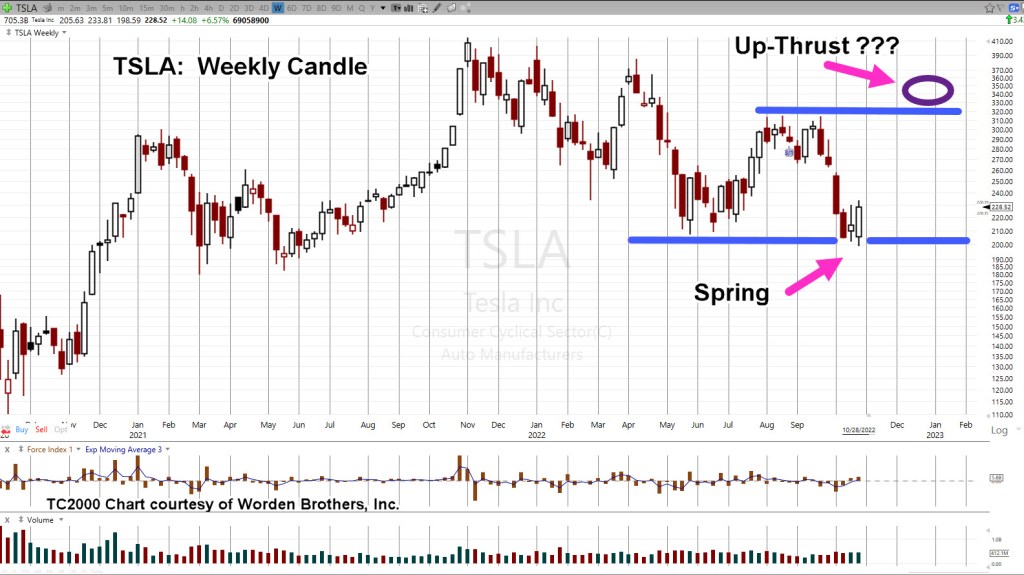
The set-up, already posted; Spring-to-Up-Thrust.

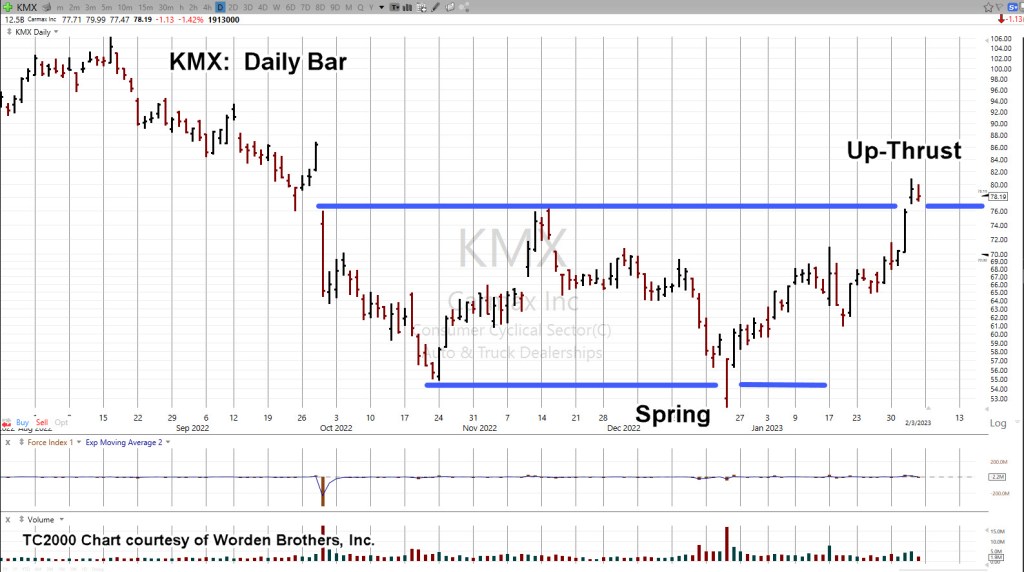
It’s a repeating pattern found across the markets.

Price action gets itself into a spring condition by penetrating support which subsequently sets up the reversal; the up-thrust.

Next, we’ll use the Fibonacci Projection Tool, showing likely areas for downside destination.

A full 1 : 1 projection gets us right back to where we started the whole ‘short-squeeze’.

If SLV, gets back down to the 10.50 – 11.0, level, one can only imagine what type of hype will be in vogue.

However, at those levels, it’s reasonable to expect the local bullion dealer will be begging for sales … they might even offer their product at, or near, spot. 🙂

Stay Tuned

Charts by StockCharts

Note:  Posts on this site are for education purposes only.  They provide one firm’s insight on the markets.  Not investment advice.  See additional disclaimer here.

The Danger Point®, trade mark: No. 6,505,279

After The Close …

The Tape Is Always Right

Once again, stopped-out of the biotech short (not advice, not a recommendation).

Call it bad timing, incorrect analysis or whatever. Every opportunity for SPBIO, to go lower is being thwarted … so, no more for now.

On the flip side, the potential collapse in silver has been discussed over the past few weeks, here, here, here and here.

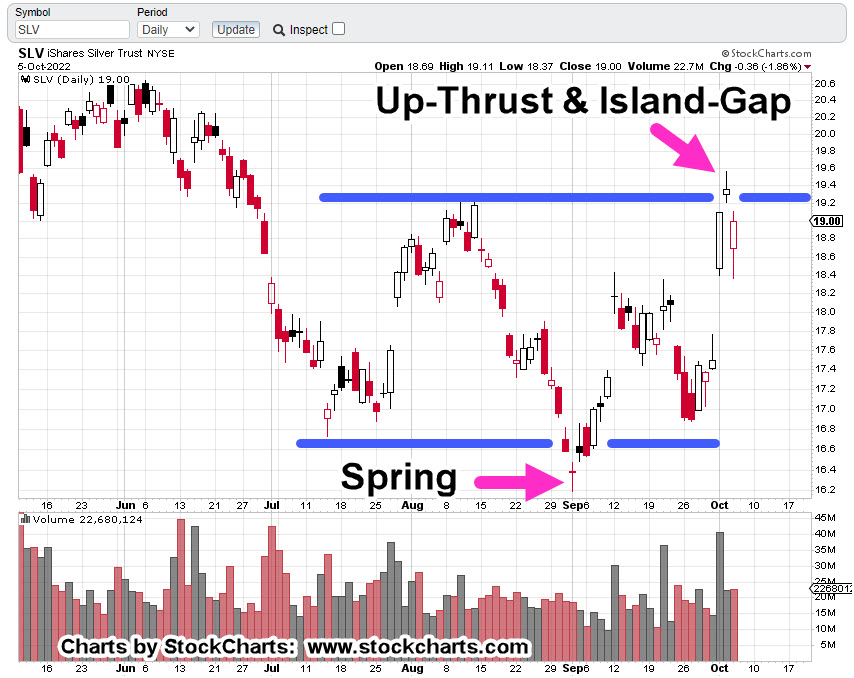
Looking at the chart below, not only do we have a Wyckoff Up-Thrust, but unless it’s negated by subsequent price action, we’ve got an ‘island gap reversal’ as well.

Prices can’t be sustained at yesterday’s higher level.

Silver SLV, Daily

As previously discussed, very late in the session as SLV, price action rose higher, reducing the risk, a short was entered via Leveraged Inverse Fund ZSL @ 28.08 (not advice, not a recommendation).

The trade is identified as ZSL-22-01.

An obvious hard-stop would be yesterday’s high in SLV, or the corresponding low in ZSL @ 26.55.

Stay Tuned

Charts by StockCharts

Note:  Posts on this site are for education purposes only.  They provide one firm’s insight on the markets.  Not investment advice.  See additional disclaimer here.

The Danger Point®, trade mark: No. 6,505,279

The Silver Set-Up

Repeating: Spring-To-Up-Thrust

Which comes first: Freezing and starving to death, or currency collapse?

Is that a hyperbolic statement?

Short answer, is no.

Here are at least two boots-on-the-ground sources that paint an incredibly bleak picture of what is to come in just weeks for Europe.

Links are here and here.

As with the Texas Freeze, the last thing on anybody’s mind was their “stack” of silver.

The humanitarian crisis is happening now, if not soon. Currency collapse may be months if not years away.

Which brings us to the precious metals and specifically silver, SLV.

The past few trading sessions have formed a repeating set-up: Spring-To-Up-Thrust.

Silver SLV, Daily

Note, the Pre-Market activity is far below yesterday’s high; the bulls may be trapped.

Typically the first order of business is an attempt to close the gap. If that happens, price action is then narrowing the risk on a short entry (not advice, not a recommendation).

One typical trading vehicle for shorting silver (other than the futures market) is 2X Inverse Fund ZSL.

Summary

The bulls think it’s finally the launch they have been waiting for … all these years.

It could be … anything can happen.

However, that does not take away from the fact we’ve got a trade set-up that may offer a low-risk short entry (not advice, not a recommendation).

Stay Tuned

Charts by StockCharts

Note:  Posts on this site are for education purposes only.  They provide one firm’s insight on the markets.  Not investment advice.  See additional disclaimer here.

The Danger Point®, trade mark: No. 6,505,279

The Biotech Breakdown …

Massive Short Volume, Proves Correct

Short-side volume was the key.

The August 13th, update linked here, identified unprecedented volume posting on the short side.

It’s also interesting to note in the very same report, there’s a link to ‘bears capitulate’.

If there was actually some value to the financial press, this would be it; help provide contrary indicators.

So, here we are just over a month later and biotech SPBIO, appears to be in free fall.

Biotech SPBIO ($SPSIBI), Weekly Close

The prior update had this so say about positioning (not advice, not a recommendation):

“Figuratively speaking, everything’s been dropped to focus exclusively on this sector. It’s obvious, what’s going on at this juncture is unprecedented.”

From that August 13th update, the main account for my firm has increased the size of its short position (LABD-22-05), by approximately 34% (not advice, not a recommendation).

Summary

Unprecedented short-volume, points expectations to some kind of unprecedented bad news.

When the market goes south, bad news comes out.

Stay Tuned

Charts by StockCharts

Note:  Posts on this site are for education purposes only.  They provide one firm’s insight on the markets.  Not investment advice.  See additional disclaimer here.

The Danger Point®, trade mark: No. 6,505,279
We’ve Seen This Movie, Before

1907, 1929, 1974, 1987, 2000, 2007, … and Now

As Scott Walters has said:

It’s different this time.

It’s Worse!

That ‘worse’ part includes the adverse moves in the market.

This time around, as opposed to ’07 – ’08, they really do seem to be worse.

Which, brings us to biotech SPBIO.

Biotech SPBIO, Weekly

Just to remind ourselves where biotech is at the moment, we have the un-marked weekly chart.

This sector’s the only one (miners excluded) that’s trading below the 50-Week and 200 Week Moving Averages with a 50-wk cross to the downside.

On a weekly basis, we’re in a major long-term downtrend that looks to have finished its upside correction.

Getting closer-in on the hourly chart we have the following.

SPBIO, Hourly

What do you see?

Here’s the marked-up version.

Over and again; a fractal set-up called ‘Spring-to-Up-Thrust‘.

The zoom chart below shows that price action appears to be struggling at the resistance area (black line).

Danger Point

At this juncture we’re at The Danger Point®

Enough of a push higher and SPBIO, could continue on upward, overcoming significant technical and fundamental barriers.

However, since we’re trending lower in the longer timeframes, probabilities suggest that downtrend may be ready (or near ready) to re-assert itself.

Stay Tuned

Charts by StockCharts

Note:  Posts on this site are for education purposes only.  They provide one firm’s insight on the markets.  Not investment advice.  See additional disclaimer here.

The Danger Point®, trade mark: No. 6,505,279

Biotech’s, Jaw-Dropping Volume

Bears Capitulate

According to this, just out on ZeroHedge, that’s what’s happened.

As we’ll see below, there’s certainly something unprecedented going on, specifically in biotech.

The prior update made the argument, biotech SPBIO, has a unique distinction that’s showing up on the leveraged inverse fund LABD, shorting the sector.

For illustration purposes, we’re going to do a little ‘trick’.

The weekly close of SPBIO, is shown below.

This index does not provide volume but we’re going to ‘fix’ that by putting in the lower panel, weekly volume for leveraged inverse fund LABD.

It’s clear, as SPBIO reached all-time highs and reversed, short activity via LABD picked up significantly.

However, the past several weeks tells us from a Wyckoff perspective, something major could be about to happen.

As SPBIO, has moved counter-trend higher, activity going short (via LABD) has gone off the scale.

Spring-To-Up-Thrust

If the unprecedented volume activity weren’t enough to draw attention, we also have a repeating set-up that’s well, repeating; Spring-to-Up-Thrust.

With the idea originally obtained from the late Daivd Weis, later confirmed time and again, it’s a unique (high probability) characteristic of market behavior.

That’s where we are now.

SPBIO: Up Close & Technical

It may be hard to see in the above chart.

The next one, moves closer-in.

The upward advance of SPBIO slowed dramatically last week, closing up just +1.68%, for the week.

Contrast that move with the week prior at +13.83%, and the slowdown is evident.

All Hands, On Deck

Figuratively speaking, everything’s been dropped to focus exclusively on this sector. It’s obvious, what’s going on at this juncture is unprecedented.

That goes for the rest of the markets as well.

However, this sector alone, is telling us to ‘look here’; potentially setting up for a major reversal.

Stay Tuned

Charts by StockCharts

Note:  Posts on this site are for education purposes only.  They provide one firm’s insight on the markets.  Not investment advice.  See additional disclaimer here.

The Danger Point®, trade mark: No. 6,505,279

S&P Rally to Continue ?

Dan … We’ve Bottomed Out !!!

‘Hey Dan, the worst is behind us.’

That’s going to age just as well as our picture at left.

Toilet paper across my face, makes me feel so much more safe.

Within the first ten seconds in the link above, Dan from i-Allegedly gets into it.

He still, at this late stage, has people contacting him to say we’re past the bottom.

He summarizes those comments by saying, ‘We’re far from the bottom of anything.’

Then, as if on cue, ‘Economic Ninja‘ comes online to let us know, another 200,000 egg-laying chickens have just been destroyed in a ‘mysterious fire’ … imagine that.

Almost becoming background noise to all this, the S&P 500, in a sharp rally on Friday that looks like it won’t stop.

S&P 500, Summary

Friday’s action took the S&P back to test resistance on waning volume while at the same time, posting a Wyckoff spring to up-thrust.

That’s it in a nutshell.

Daily SPY, Close

With markup notes

Getting closer-in on the candle chart.

Futures Market

As of this post (3:31 p.m., EST) the futures are higher by a tad at +0.52%. The question is, will that carry-through into the Tuesday open?

Of course, that’s not known. What we do know however, is that price is at established resistance and in up-thrust (potential reversal) condition.

Even if the ultimate direction for the market is higher, normal behavior would suggest a pull-back to gather more fuel for such an attempt.

Otherwise, we’re at the danger point; conditions have been set for downside reversal.

Stay Tuned

Update 6:47 p.m. EST:

S&P futures dropping … now up only +0.17%

Charts by StockCharts

Note:  Posts on this site are for education purposes only.  They provide one firm’s insight on the markets.  Not investment advice.  See additional disclaimer here.

The Danger Point®, trade mark: No. 6,505,279

Gold Set To Rally

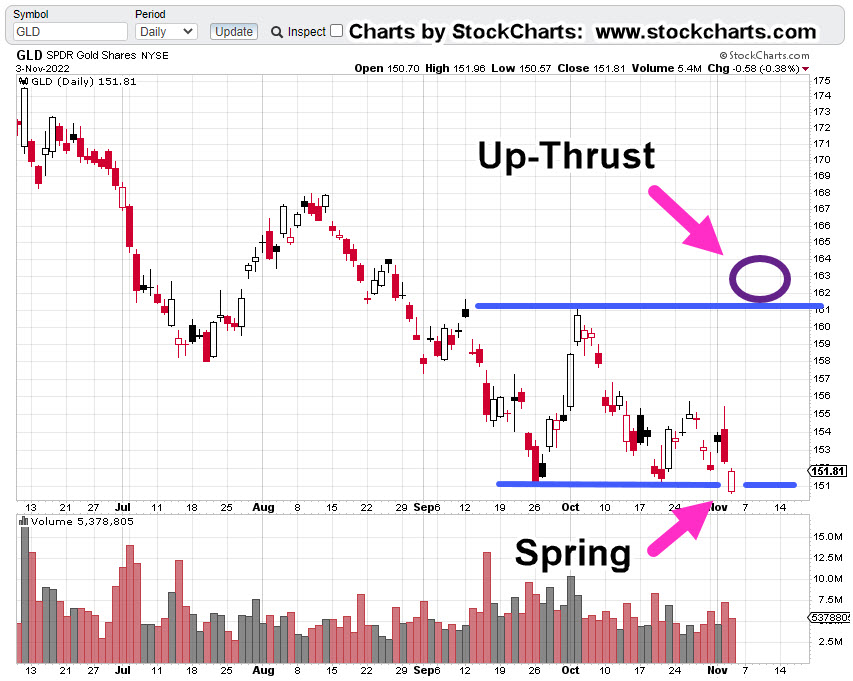
GLD, In Spring Position

It’s about an hour before the Sunday futures open and gold (GLD), is in spring position; set to move higher.

The daily chart of GLD below, shows the action for the past three years. The chart following gets closer in to identify the set-up.

Gold (GLD), Daily Chart

Closer in with the spring set-up marked.

We know that empirically, if a spring set-up is viable and in-effect, it has a tendency to go straight into an up-thrust.

The chart below locates a potential up-thrust zone should the price action launch into a spring.

If gold breaks to the upside, be prepared for another round of bull mania hysteria … all the while, the structure of the overall markets continues to fall-away.

Stay Tuned

Charts by StockCharts

Note:  Posts on this site are for education purposes only.  They provide one firm’s insight on the markets.  Not investment advice.  See additional disclaimer here.

The Danger Point®, trade mark: No. 6,505,279

‘Bounce’ Fails … Now, What ?

Get Right … Sit Tight

Yesterday’s upside failure (from Monday’s reversal) tells us it’s a very dangerous market environment.

Several YouTubers (here and here) and maybe more, the leaders anyway, have noted they’re providing good-faith analysis and potential tips, but that does not change the fact, ‘You’re on your own’.

The ‘rebound’ that Maverick discussed (second link, above) may have been on Monday and that’s all there was.

Absolutely nothing against him in any way.

If that was it for a bounce, we’re indeed in a very dangerous (to the downside) situation.

The S&P got itself into a Wyckoff Up-Thrust condition, noted here and shown on the daily chart below.

S&P 500 (SPY), Daily

It’s about midway through today’s session.

We can see SPY price action grinding its way down to support near the 410 – 415, level.

Up-Thrust, headed for ‘Spring’ ?

We already know from empirical observation that markets tend to go from spring to up-thrust.

Does it work the other way around … up-thrust to spring ?

From a personal standpoint, I do not have any data to show that behavior exists.

However, with SPY in its current position (near support) we may be about to see if there’s penetration and then attempts to move higher (i.e., in spring position).

The chart below shows current support.

There would need to be decisive penetration to set up the potential for any kind of sustained rebound.

The blue line is a significant support level.

The grey line just above, is also support, where price action is at the moment.

Penetration of either one sets up a spring.

Real Estate, IYR (Daily)

While the S&P fights it out at support, real estate, IYR is doing the same thing.

The previous post was looking for new highs in the sector.

At that time, it looked to be 50/50, odds of doing so.

Now, we’re right at the danger point.

It won’t take much for price action to confirm a spring or a break to lower levels.

It looks like we’ve already had an up-thrust which seems to point probability lower.

With the overall markets, the S&P at support now and deep oversold, points the opposite way, probability to the upside.

Summary

IYR had a shallow, 38% retrace during yesterday’s session before continuing lower and closing near the low of the day.

As that retrace was completing, a short position was opened via leveraged inverse SRS (SRS-22-01) and the stop set at yesterday’s IYR high of 109.58 (not advice, not a recommendation).

As this post is completing, IYR price action’s laboring to move higher (SRS, lower).

We’ll know soon enough if we’re in a breakdown or a spring.

Stay Tuned

Charts by StockCharts

Note:  Posts on this site are for education purposes only.  They provide one firm’s insight on the markets.  Not investment advice.  See additional disclaimer here.

The Danger Point®, trade mark: No. 6,505,279
Gold Price Action, Blows-Up

Trading The Price … Not The Narrative

The narrative and the price don’t agree; at least at this point.

Over and again, we hear it’s ‘dollar destruction’ and ‘hyperinflation’.

Here is a link to one of the latest pontifications on what ‘inflation’ is doing or is going to do.

After watching that, one is so much better informed. Well, at least we know what the bit-players are saying … each reading from their own (pre-approved) script.

Let’s get back to reality and the price action at hand.

We’ll start with this quote from the last update which references shorting the gold miners using JDST (not advice, not a recommendation).

“However, something that can be done is to use that upward bias to position short at the lowest risk possible.”

That’s exactly what was done during this (past) session; let’s start first with the big picture.

Junior Miners GDXJ, Weekly

As a reminder, and for those who may be new, we’re looking for a particular price pattern that has been shown to repeat over time:

Wyckoff: Spring-to-Up-Thrust

Note in the CAT, example in the link above, price-action up-thrusted and then came right back down to support without any kind of an upward test.

Sometimes, it happens that way.

What’s not known of course, is if GDXJ will respond the same way.

Junior Miners GDXJ, Daily

The chart above is a close-up of the action.

The next chart is leveraged inverse fund JDST. It shows the initial entry of what is labeled trade, JDST-22-02 (not advice, not a recommendation).

Trade entry was just as JDST, price had reached its daily low extreme and was backing off higher (GDXJ, lower); right around 1:14 p.m., EST.

Note the tightness of the stop; just 0.24-points.

Summary

Tomorrow’s action could hit the stop, blow (gap) through the stop or continue upward.

It’s unknown.

What we’ll get for sure, is another data point on what’s really going on with the miners.

Stay Tuned

Charts by StockCharts

Note:  Posts on this site are for education purposes only.  They provide one firm’s insight on the markets.  Not investment advice.  See additional disclaimer here.

The Danger Point®, trade mark: No. 6,505,279