Note: Posts on this site are for education purposes only. They provide one firm’s insight on the markets. Not investment advice. See additional disclaimer here.
From Reminiscences of a Stock Operator, ‘Turkey’, aka Mr. Partridge, was much older than the rest.
The rumor in the broker’s office was that he was rich.
Even so, he was not contributing to heavy commissions (i.e. day and swing trading) as far as Livermore could tell.
The other thing was, that he never offered advice.
If a stock tip worked out, he would thank the tipster … if not, you never knew if he took a position or not.
Losing The Position & Psychological Impact
Turkey’s ‘losing the position’ remarks impacted Livermore the most. He recognized that Partridge wasn’t some old duffer; he was an astute speculator.
Losing the position: Not the same as holding a loser.
Maintaining a profitable position during a correction while at the same time, recognizing a big move could be in the works, requires (mental) strength; let the market itself say when to get in and out.
This link has Prechter’s ‘missing out’ story on big gains.
Continuing on with Turkey.
In the book, he said he ‘paid a high price for his tuition’ and does not want to incur a second fee.
Attempting to ‘play’ the market in and out then repeat, by definition, leaves one out of the big move.
It’s not the move itself; it’s the recognition that fiddling with the position and losing it, has resulted in a lost opportunity that will never come back.
The psychological damage is immense.
It’s worse than taking major loss. Watching a move take off without you when you had planned for months (or years) for the set-up, may have left no way to recover.
Which brings us to the market at hand.
Gold (GLD):
This site is not advice, and it does not make market ‘calls’.
Presented here, are posts documenting how Wyckoff analysis is being used to spot market set-ups.
Those set-ups have shown themselves over time to be potentially profitable (not advice, not a recommendation).
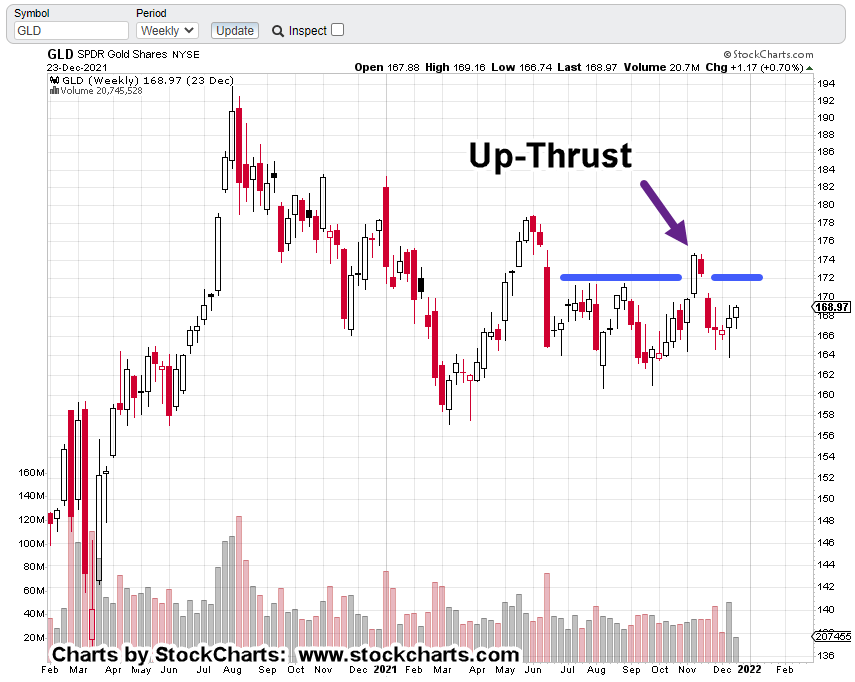
The weekly chart of gold (GLD) shows the up-thrust that was months in the making.
We’re going to invert the chart and so, the ‘up-thrust’ now becomes a ‘spring’.
Note:
Back in the day, when I wasted time posting on SeekingAlpha, I would get numerous complaints about ‘inverting the chart’.
They wanted it spoon-fed and did not have the mental plasticity to look at situations from the opposite perspective.
The ‘inverting the chart’ came from none other than Dr. Elder, himself … discussed in Trading For A Living or Come Into My Trading Room if memory serves.
The main interest on the ‘Alpha’ site seems to be pontificating about how sharp your pencil is; how close you can come to guess what earnings (or some other meaningless fundamental) will be at the next release.
I have not been back in years … they’re probably out there still arguing … only this time, the banter may be about which “masks” are most effective. 🙂
But I digress.
Months To ‘Spring’, Weeks To ‘Test’:
The inverted chart of GLD shows it took months for price action to penetrate support and create a spring condition.
Since then, we’ve had a move higher and now lower coming back near support.
Is this a test or a failure of the move?
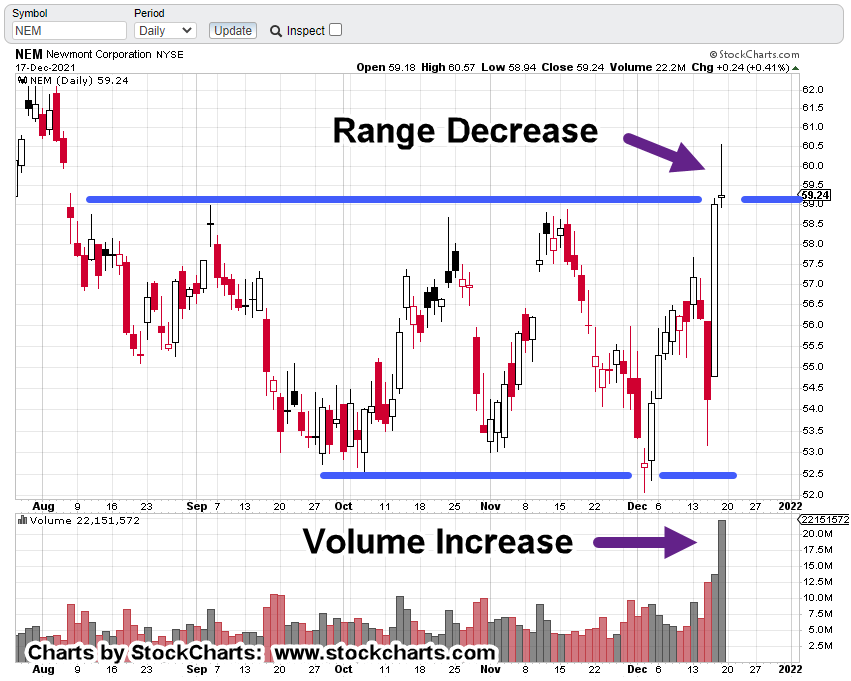
It was a short week. However, it may still provide actionable data. For example, range of GLD, GDX and NEM, all narrowed. Volume contracted as well.
The inference is, thrust energy is weakening and thus weights the probabilities to a ‘test’ and not a ‘failure’.
Deflation Pivot:
Interestingly, we’re starting the see the consumer has finally reached the limit of their spending. Price are staring to edge lower as reported here and here by Economic Ninja.
Another data point, a bit esoteric, is ammunition. Pices are starting to taper off as well. Most notable is 22-LR.
A couple of months ago, 22-LR was about 0.10 per round (bullet). Looking at this site, we see the cheapest price has dropped to .080/round.
That does not look like much but it’s a 20% decline.
Summary:
Everyone has their own time frame and market approach.
Taking a cue from Turkey, referenced above, I would rather sit through a correction, incur the erosion of profit than exit and ‘click my heels’ as Prechter puts it; then watch the original position move for a huge gain without me aboard (not advice, not a recommendation).
We’re likely to find out very soon if this is a major pivot lower or if somehow, gold (GLD) bulls gain control and drive prices higher.
Note: Posts on this site are for education purposes only. They provide one firm’s insight on the markets. Not investment advice. See additional disclaimer here.
Founded by William Boyce Thompson in 1916, Newmont (NEM) was around over a century ago during Livermore and Wyckoff’s day.
Thompson is center in the photo with President, Warren G. Harding at left.
Wyckoff and Thompson were interconnected.
In Wyckoff’s autobiography, he writes about working for Thompson’s firm (Thompson, Towle & Co.) in 1910.
During that time, he describes no fewer than two stock ‘manipulation’ schemes; one by renowned James R. Keene and the other by Thompson himself during a deal-gone-bad with the Guggenheims.
Also in 1910, Wyckoff published his seminal work: Studies In Tape Reading. If there’s any one book to read concerning how markets work, ‘Studies ..’ is that book.
Wyckoff had first-hand exposure into market operations by the wealthy and super wealthy. More importantly, he saw how those transactions showed themselves on the tape.
Last check, a first edition ‘Studies’ went for around $3,500. A quick search as of this post, turns up nothing currently available.
For those who complain ‘it’s rigged’, to that we can say, ‘it’s always been rigged’.
Determine what those ‘rigging’, are trying to accomplish and you may have a trade.
Now, to the market at hand: Newmont Mining.
It’s the key; the largest cap equity in the Senior Mining Index (GDX).
Newmont, NEM
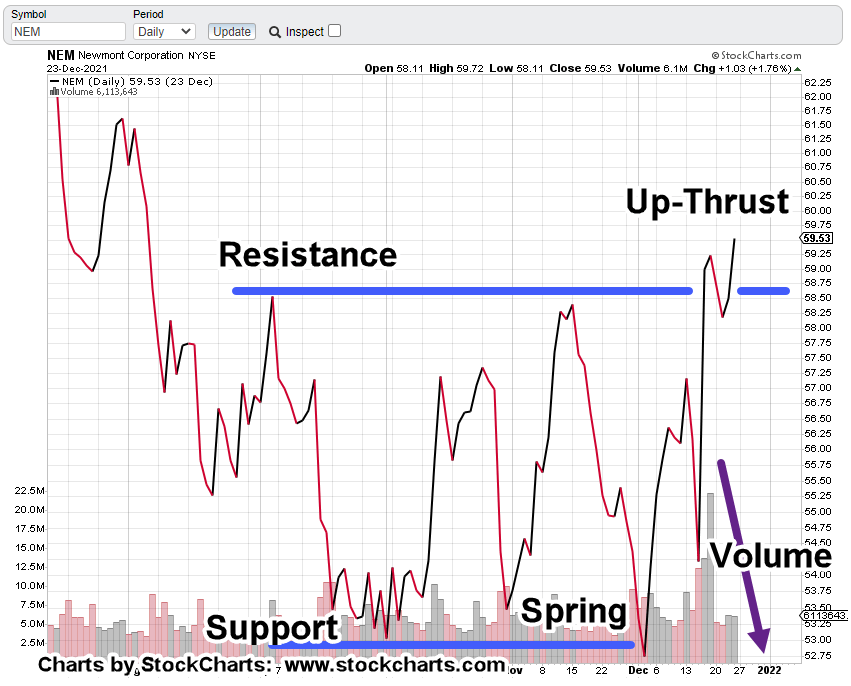
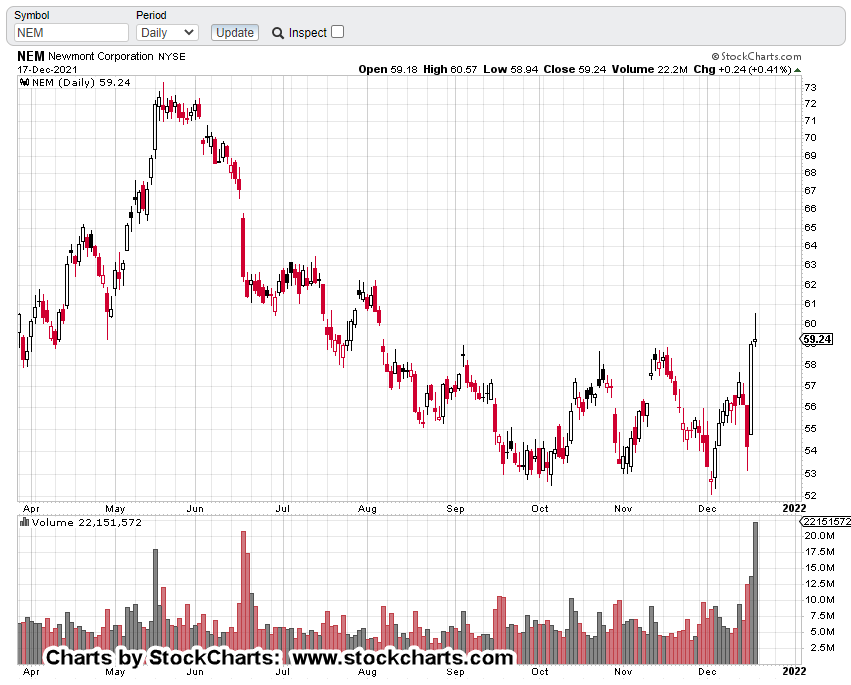
The daily chart:
For those who have been with this site for a while, you may instantly see the set-up: Spring to Up-Thrust.
The marked-up chart makes it clear.
Moving in a little closer for additional clues:
We can see from the volume itself, there were a huge number of transactions this past Friday.
NEM penetrated long established resistance.
In so doing, it set off a massive number of orders: Buy orders, sell orders, sell-short.
Senior Mining Index: GDX
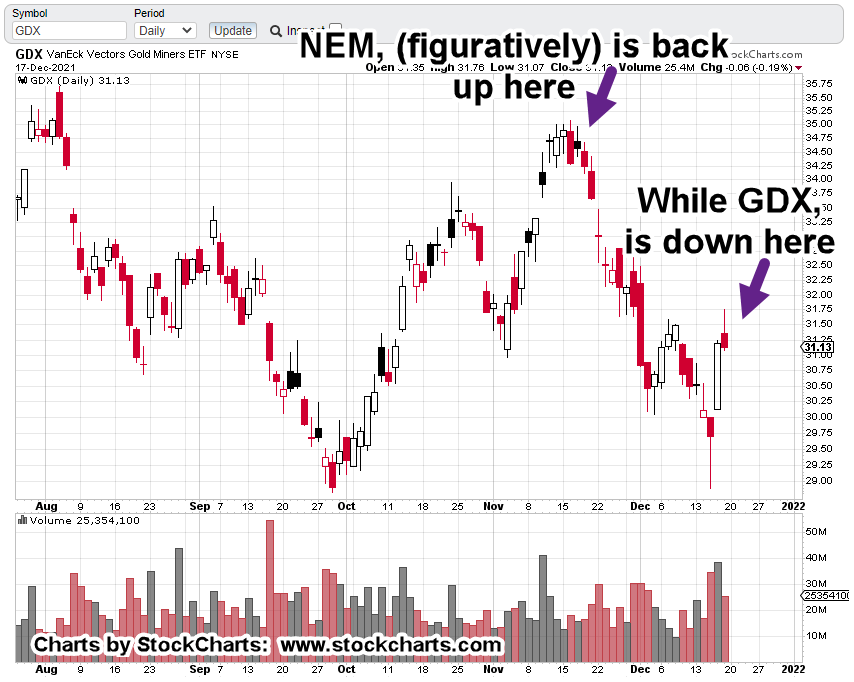
The other part of the story and the one that weights it to the bears:
While NEM, is at multi-month highs, senior miners GDX, is nowhere near its highs.
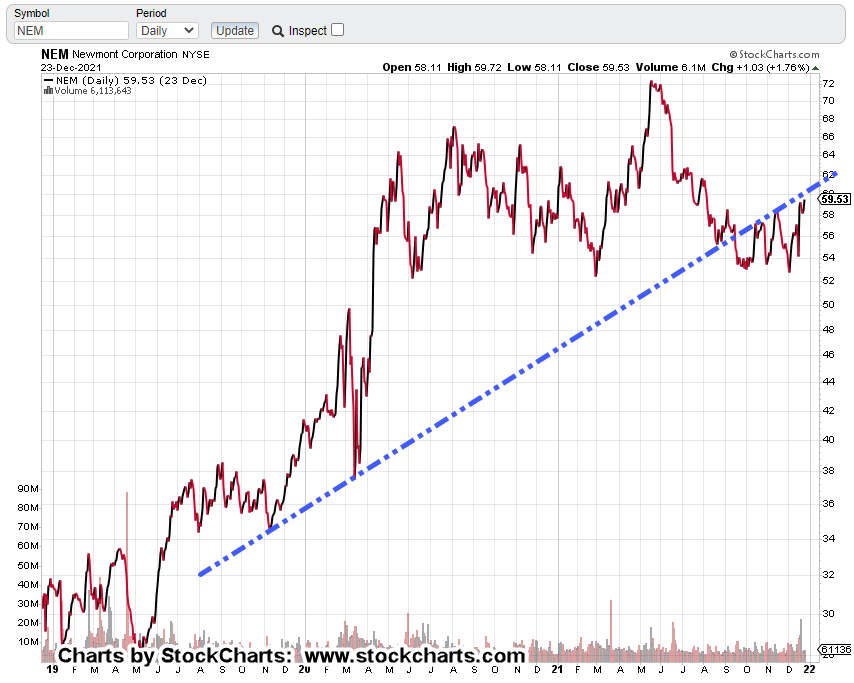
Daily chart, GDX:
What does that mean?
It means the market is ‘thinning-out’
The professionals and maybe some investors alike, are abandoning the non-performing lesser cap equities; pouring funds into the last man standing NEM, in hopes that it will keep moving higher.
It’s desperation and signals market weakness.
As always, anything can happen and bulls may somehow take control.
However, from the charts themselves, hyper-stretched major indices coupled with insiders bailing out the most in history, uneducated ‘retail’ willingly stepping up to hold the bag, it does not look good for any bulls … gold or otherwise.
Summary:
We could find ourselves in a situation similar to the oil market in mid-2014 where it spontaneously deflated for eighteen months … nary a blip higher all the way down.
With that, we’re maintaining short via DUST (not advice, not a recommendation).
Note: Posts on this site are for education purposes only. They provide one firm’s insight on the markets. Not investment advice. See additional disclaimer here.
If there ever was a CPI report to completely break the ‘inflation’ narrative, this was it.
Several articles, here, here, and here, all saying essentially the same thing … skyrocketing ‘inflation’.
If that really was true, why is the 5,000-year-old hedge against inflation (gold) not responding … and even worse, heading lower?
That’s because, it’s all rigged, man !! (cue, Tommy Chong).
Well, it has always been rigged.
Both Wyckoff and Livermore talked about that ‘rigging’ way back in 1921, when Wyckoff interviewed Livermore about his trading methods. Later, in 1922, a series of articles on Livermore was published in Wyckoff’s ‘Magazine of Wall Street’ (a forerunner to Barron’s).
The point is, we’re not interested in who is doing the rigging. That’s what the press tries to find out (a waste of time). The real question is, what are those ‘rigging’ trying to accomplish?
Answer that, and you may have a potential trade set-up.
We’ve got supply chain, controlled-demolition with corresponding asset price inflation; the kicker is, gold and the dollar, say we’re in some kind of monetary deflation.
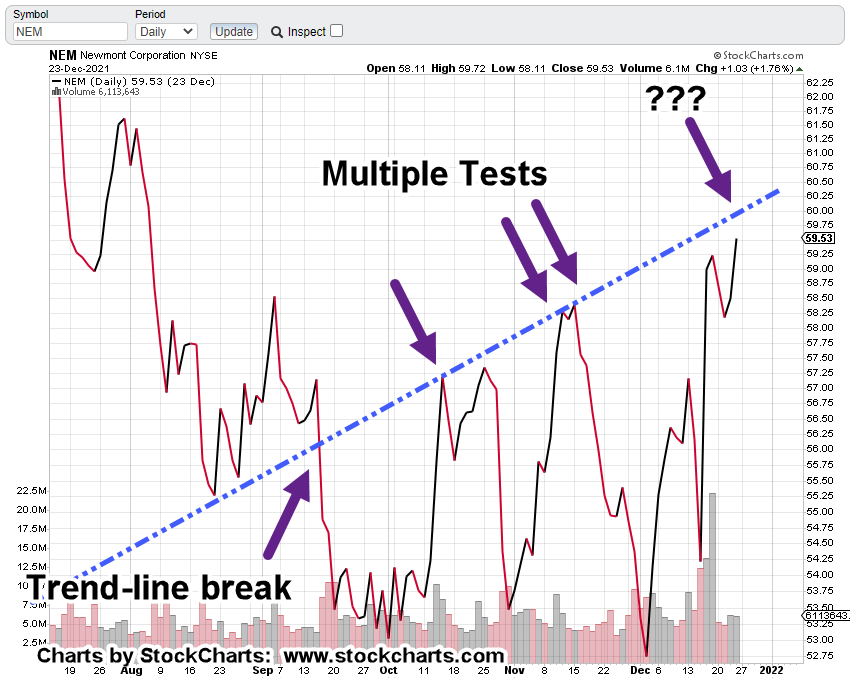
Senior Miners, GDX Confirming Trend
Price action in the gold market and the miners confirm that (deflation) assessment … for now.
Zoom-in on trend line contacts.
Summary
Based on the articles linked above, if there ever was a data-set release that would launch gold (and the miners) higher, today would be the day … right?
Both Wyckoff and Livermore did not concern themselves with what ‘should’ be happening. They were focused on what ‘is’ happening.
Gold and the miners are (and have been) moving lower.
As yesterday’s post said, we’ll remain short (not advice, not a recommendation) until the market itself says to exit.
Note: Posts on this site are for education purposes only. They provide one firm’s insight on the markets. Not investment advice. See additional disclaimer here.
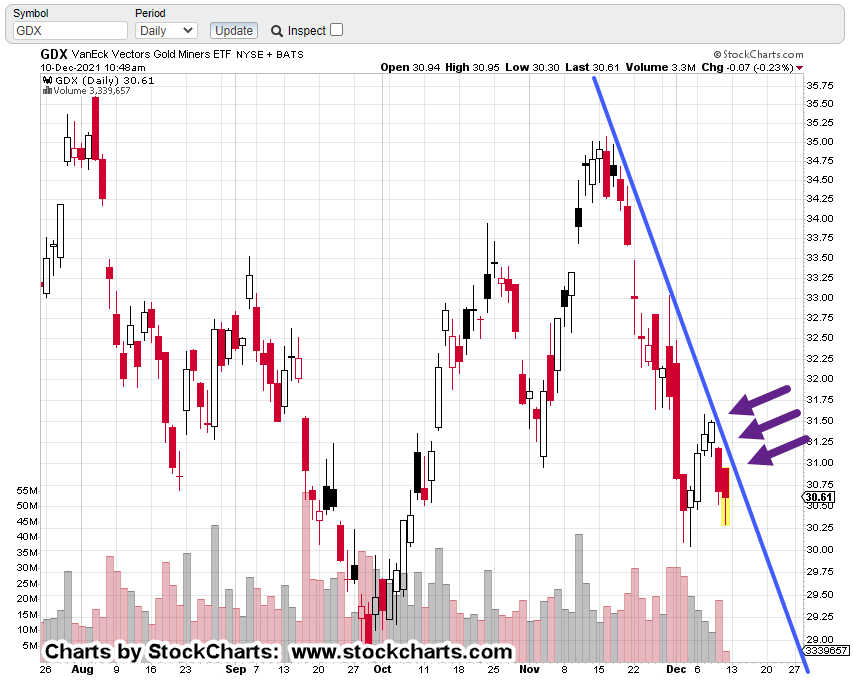
Steven Van Metre, in his Sunday Night Charts (time stamp 12:20), shows the precarious situation of GDX.
There’re about 90-minutes left to go in this session.
It looks like GDX is/has tested underside resistance and down-trend simultaneously. For GDX to break higher, it would have to get through that resistance.
As always, anything can happen but we need to remind ourselves, the gold bulls are already trapped … having bought at the mid-November breakout.
If still holding, they’re now deep in the red.
Under such conditions, each down move serves to set the (bear) hook even more.
If we use this just released article from ZeroHedge, we’re nowhere near any kind of capitulation and upside reversal.
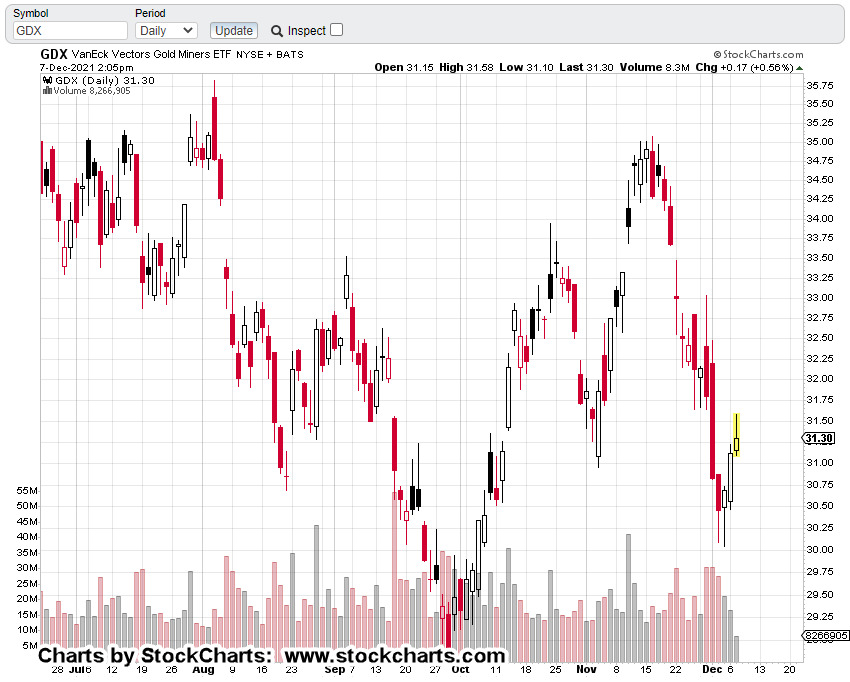
Senior Miners, GDX
The un-marked daily chart
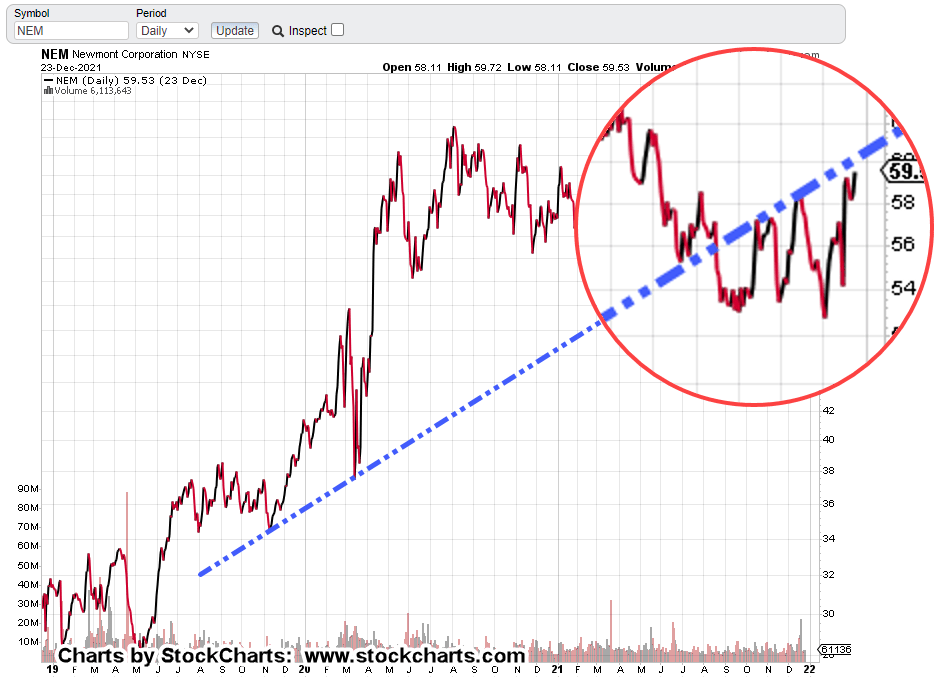
And now …
With zoom
We’re at a confluence of resistance; the downtrend and the underside of price action.
Let’s keep in mind, the overall markets (S&P, Dow, Nasdaq) are still oscillating around their all-time highs. Volatility has increased as the trend appears to be changing.
Gold and the miners are nowhere near all-time highs.
A century ago, Wyckoff showed how to spot markets that would decline the fastest and farthest under bear market conditions (not advice, not a recommendation).
It’s not the high-flyer we’re looking for … no, it’s the laggard.
That’s the one to pick.
It’s already weak and once the buoyancy of the general market evaporates, the bottom may fall out.
Note: Posts on this site are for education purposes only. They provide one firm’s insight on the markets. Not investment advice. See additional disclaimer here.
The first part describes some technical details that are all true … after that, well, you decide.
Turns out, gold is going to skyrocket because of Russia !
I suppose, anything can happen.
We get fundamentals and anecdotal data as the reasoning for a Russia driven up-side breakout.
The problem with fundamentals is, they don’t work.
They never have worked.
Wyckoff discovered this a century ago when he said (from his autobiography) that ‘stocks move based on a power of their own. That power, has nothing to do with fundamentals.’
Trading genius Ed Seykota repeated that truth during his interview for ‘Market Wizards’.
He called them ‘funny mentals’ and went on to say he nearly, if not always lost money using them.
This article’s so good that I have to pay to read it.
From reading the shaded area, we can infer a similar (bullish) discussion to the first link above.
Sorry, not interested.
Summary
This time really could be different. Gold could launch into a sustained upward breakout.
However, the charts (GDX, GDXJ) at this juncture, are saying ‘not yet’.
Maintaining short (not advice, not a recommendation) via DUST … which is now in the green.
Stay Tuned
Note: Posts on this site are for education purposes only. They provide one firm’s insight on the markets. Not investment advice. See additional disclaimer here.
A higher XOP open would have probably been a short set-up (DUG) failure.
However, that’s not what happened.
The open was lower but then price action went on to post a new daily high above yesterday’s.
At this juncture, the short set-up is still valid (not advice, not a recommendation).
How can a new daily high be acceptable for a short position?
Repeating Set-Up:
Back in August this post was created to help document a market behavior that’s probably been repeating since the beginning.
My former mentor, David Weis used to call it ‘Spring to Up-thrust’, using Wyckoff’s terminology.
The fact the set-up’s been repeating for decades, if not a century or more, is definitive proof traditional valuations and fundamentals have nothing to do with actual price movement.
That’s a topic for another time.
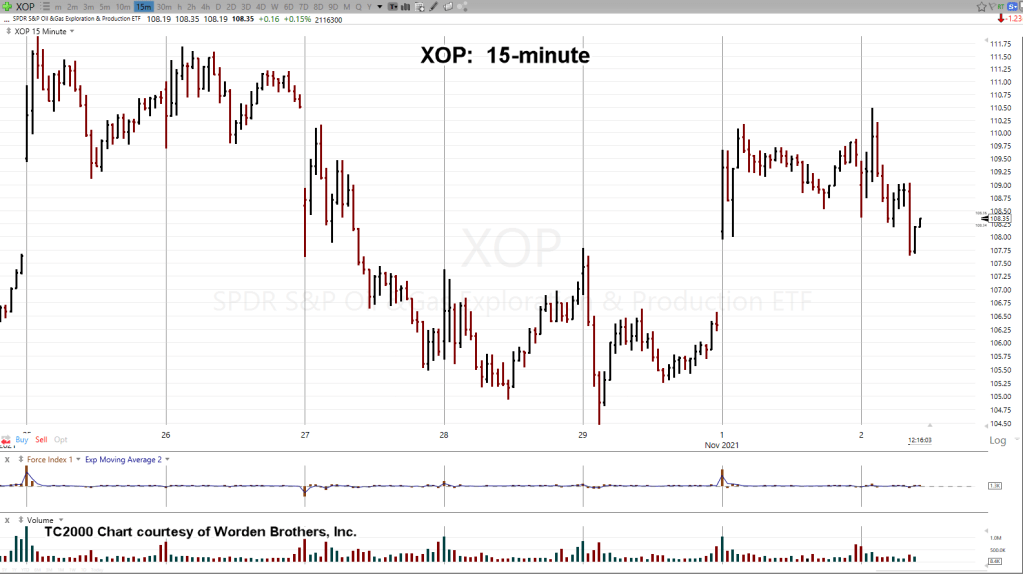
XOP Analysis:
We’ll start with an un-marked XOP daily chart:
It doesn’t look like much is going on. So, let’s zoom into the far right side using the 15-minute, below:
Ok, what am I supposed to see?
Marking up the chart, we have the following:
Once we have the correct annotations, it’s obvious XOP just posted a ‘Spring to Up-thrust’.
True, it’s on a minor time frame like the 15-minute; however, it does give a clue XOP, could be in for a more significant and longer-term reversal (not advice, not a recommendation).
Positioning:
If XOP is somehow able to post another new daily high during this session or subsequent, most likely it would be time to exit our short position (via DUG, not advice, not a recommendation).
For now, the expectation’s for continued oscillation below today’s high … while XOP figures out if that’s all there is for the up-side.
Stay Tuned
Note: Posts on this site are for education purposes only. They provide one firm’s insight on the markets. Not investment advice. See additional disclaimer here.
The daily chart above, shows our current location.
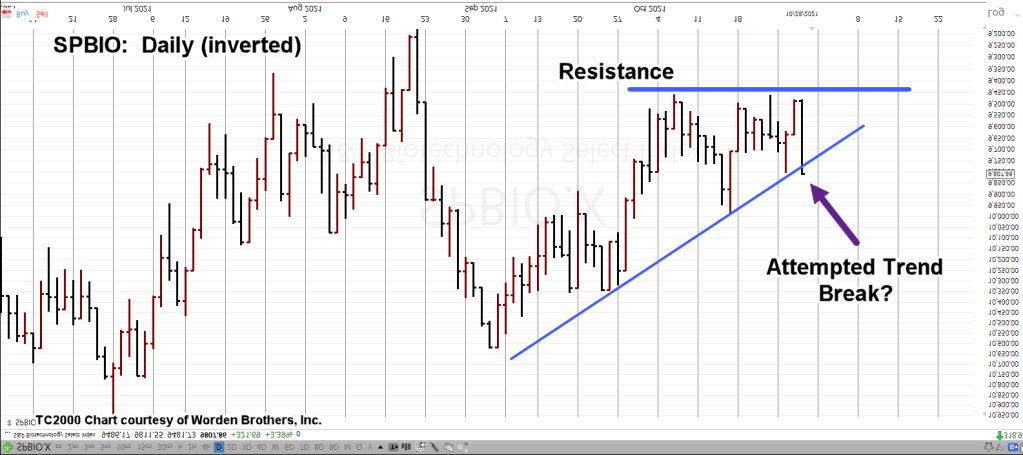
Inverting the chart and expanding the price action gives us the following:
Was today an attempt to break the up-trend (down-trend, non-inverted)?
Wyckoff called this type of sharp adverse move ‘threatening action’.
You won’t know if the market’s going to carry out the threat until the next session or subsequent sessions.
Positioning:
My firm’s (core) short position remains unchanged (not advice, not a recommendation).
However, the main account holding of LABD, was reduced by approximately 2.9%, during this session to adjust for margin requirements.
It’s important to note, the after hours session is already trading about 1% higher (for inverse LABD); a typical occurrence when the day’s move was a shakeout.
We’ll see if that action carries over to the regular session tomorrow.
Stay Tuned
Note: Posts on this site are for education purposes only. They provide one firm’s insight on the markets. Not investment advice. See additional disclaimer here.
Because, it’s the news that’s pushing around those who are easily manipulated, causing set-up(s) to materialize.
Decades ago, Wyckoff said that a speculator, will never be successful in the markets until they can completely ignore the news.
Sure, it’s important to monitor the news … but not for the purpose of speculating or investing.
Keep track of it to identify what they’re trying to accomplish. What’s the desired outcome for their press releases? Who are they trying to influence and maybe ask why?
Wyckoff went on to say (paraphrasing).
‘Put the other traders and speculators to work for you. Stand aside and let them spend their own money to drive prices into a high probability set-up.’
With that in mind, last week’s ‘Shakedown’ update on biotech SPBIO, and inverse fund LABD, said this:
“Because LABD, price action has hit the 21.40 area three times and rebounded, … it could, … could head lower for a penetration and spring set-up.”
Well, today was the penetration and spring set-up 🙂
Inverse Biotech Fund LABD
Hourly Chart
We’ve had the penetration of support … the rebound as well as what looks like a test.
Expectation for LABD, is to move higher from here to the top of the trading range.
Positioning:
My firm remains short SPBIO via LABD (not advice, not a recommendation).
Biotech’s showing weakness in the face of all-time highs in the S&P as well as the Dow.
What’s going to happen to ‘already in a bear market biotech’, when the overall markets reach their final top?
Stay Tuned
Note: Posts on this site are for education purposes only. They provide one firm’s insight on the markets. Not investment advice. See additional disclaimer here.
About a week ago, the fist bullet item in this list discussed Moderna; that when price action reverses to the down-side (after being a market darling), the lawsuits start.
It’s not the lawsuits themselves, but the discovery process that’s part of the trial … if it goes to trial.
One can guess with some assurance, the last thing Moderna wants is for this baby (any potential lawsuit) to go to discovery and trial.
This could be one of those times, popcorn is justified; watching it all from the sidelines.
Southwest Backs Off:
Looks like greed is more powerful than jabs.
At least we can see the priorities and keep that for future reference.
Now, all-of-a-sudden, it makes no sense to destroy executive stock options with forced collapse of the organization.
Glad we have such genius executives in charge. 🙂
Meanwhile, Back At The Ranch:
While all that’s going on, we still have the financial press talking about earnings and sales and ‘pent up demand’ like any of that is important or actually real.
The only reality at this point in time, is the price.
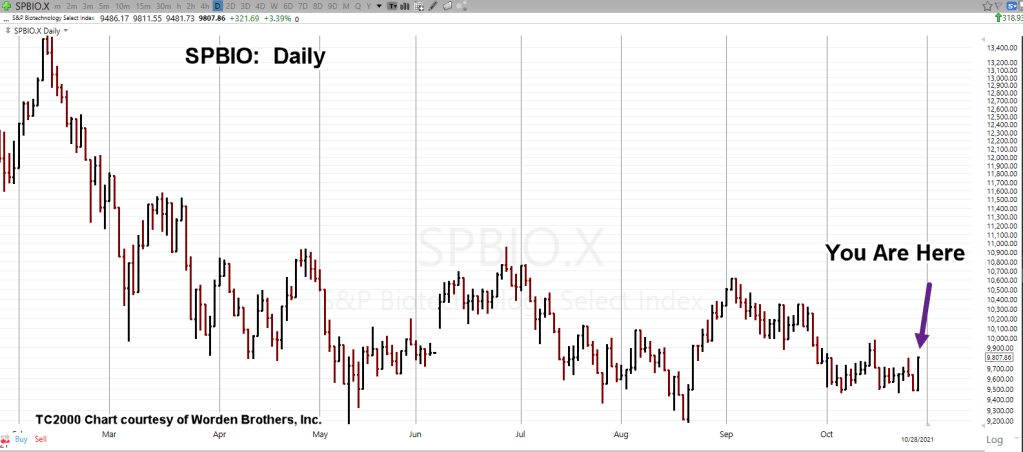
Biotech SPBIO, Inverse Fund LABD Analysis:
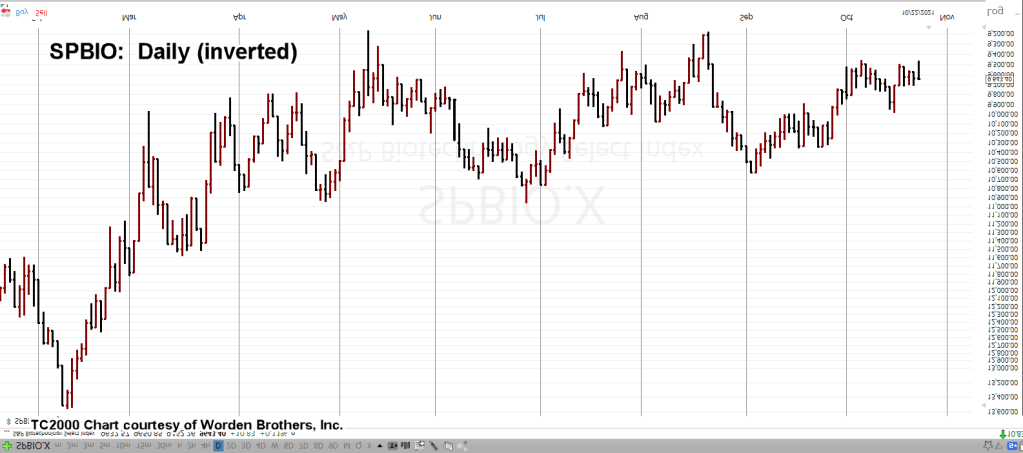
We’re going to start with the un-marked chart of SPBIO:
Next, we’re going to invert that chart; giving a better perspective of what the inverse fund LABD, is tracking:
Repeating a previous observation; price action over the last two months (from late August to now), has calmed down.
Price range has narrowed and movement looks orderly.
Our take on this; bears have assumed control and are preparing (opening positions) for a directional move.
Compared to my firm and probably anyone reading, their capital is unlimited. They’re also patient.
Depending on the level of greed, they’re keeping price action from a major breakout until positioning is complete (not advice, not a recommendation).
Wyckoff termed this phenomenon (a century ago) as the ‘composite operator’, or the ‘central mind’.
This is how markets work. There’s no getting away from it.
By making a transaction, any transaction, one has implicitly entered the ‘arena’ where the gladiators (the professionals) are ready to take all you own.
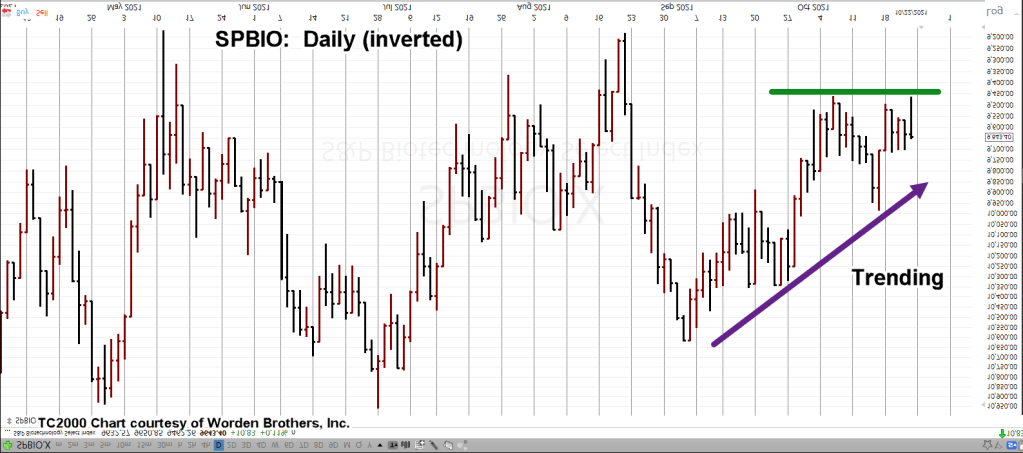
Moving in a little closer, we already have a trend.
Price action bounced off support on Friday (resistance on the inverted chart) but closed nearly unchanged.
My firm remains short SPBIO via LABD (not advice, not a recommendation).
That is, until the market itself says the bearish analysis is wrong or it’s time to exit.
Stay Tuned
Note: Posts on this site are for education purposes only. They provide one firm’s insight on the markets. Not investment advice. See additional disclaimer here.