Retail Investor … The Apocalypse

Mass Psychosis, At The Edge

Even before we had gone around the room to introduce ourselves, the instructor at Online Trading Academy, Dallas, said he had a important topic to cover.

He wanted to make sure everyone understood the concept. The rest of the seven-day course hinged on the understanding and acceptance of the idea.

What was it?

You may have already guessed: ‘Short Selling’.

The big money is made on the downside … not after, when the bottom is in, although that may happen as well. No, it’s the downside that has the greatest opportunity for profit.

Fear is a much easier emotion to gauge than greed; in that sense, down is easier than up.

Short Selling: Market Trading 101

You would think it’s a no-brainer; that everyone knows this.

Not so.

Years ago, while discussing the markets with a former broker, he asked me, and I quote: “What’s an inverse fund?”

During a business lunch, I asked another broker if he worked the downside for his clients. The response was “They can’t handle the volatility”.

In his case, he knows the vehicles are there (inverse funds) but he doesn’t use them; only working the upside.

Shorting The Market

My first short sale was back around 1995.

I shorted ‘against the box‘, when you could still do so. The short trade was Alcide.

In the May 1993, edition of my newsletter (see About) ‘Market Order Letter’, published by my firm, Equity Research Corporation, Alcide received initial coverage.

Prior to that edition, I managed to get a phone interview with Mr. John Richards, Vice President, and Chief Financial Officer of the company.

Remember that I was simultaneously employed as Engineering Technical Manager, for an avionics company. So, the interview was performed on my lunch hour.

During the call, I had made it past the receptionist, then secretary, and then to Mr. Richards, specifically.

Initially, the interview was not going well.

I could tell he considered me an annoyance and rightly so. That was, until I mentioned the competition and how they were going to deal with that.

At the time, Isomedix, had a plan to irradiate chicken (carcasses) to prevent salmonella. Conversely, Alcide had a product that was sprayed on (i.e. low-tech) and biodegradable.

When I mentioned Isomedix, the tone of the conversation changed instantly. I had done my work; I knew the market and wasn’t some newbie (even in ’93).

Mr. Richards opened up and gave me a fantastic interview discussing all manner of things. I did not tell him I was on my lunch hour and in the end, had to politely say, ‘You must be busy, so I’ll let you go’; thank you for your input.

Alcide (ALCD) was a ten-bagger that ultimately went from about $3/share to above $60/share (actually, a twenty-bagger) before being acquired by Ecolab.

Which brings us back to the ‘Retail Investor’

Still Buying The Dip

One more thing about the trading class mentioned above.

After the short-selling topic was covered, the instructor went on to say, the fact we were sitting in that room, separated us out from the massive herd of ‘investors’.

At that time, there were about 40,000 – 60,000 professional traders in the U.S. Although still neophytes, we were considered in that group.

That’s 60,000 out of 240-million adults, putting the ratio at around 0.03%

Now, on to ‘the dip’.

This article out from ZeroHedge has the data saying, ‘Retail’, is still buying the dips although the average portfolio is down a whopping -34%, for the year.

Without getting into specifics, the most conservative account managed by my firm is up over 30%, for the year, which includes the LABD, whack from this past Friday.

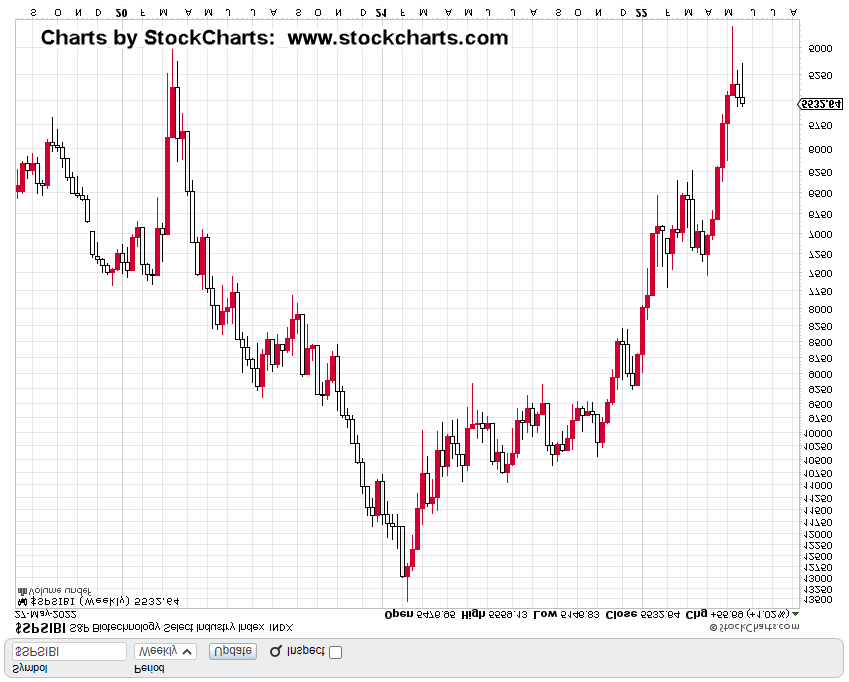
Note: An updated analysis of Biotech SPBIO, inverse LABD, and LABD-22-03, is scheduled for tomorrow.

Fuel, For The Downside

Over a century ago, Wyckoff wrote about the behavior of those on the wrong side of the trade.

That is, they are the ones who provide the fuel for the next move. In our case, that would be fuel for the downside.

Investors are buying the dip, because that’s all they know how to do.

It’s a sign of desperation.

Hoping that somehow, the markets will pull them out and return things to ‘normal’.

If you’ve read this far, you already know, ‘normal’ is gone.

Whatever happens next, (except for the starvation) will be completely new.

Stay Tuned

Charts by StockCharts

Note:  Posts on this site are for education purposes only.  They provide one firm’s insight on the markets.  Not investment advice.  See additional disclaimer here.

The Danger Point®, trade mark: No. 6,505,279

Seabridge Gold … Strategy Update

Lying In Wait … For Opportunity

As the ‘About‘ section says, this site provides one leader’s view on the market; what can best be termed as ‘Strategic Leadership’.

So, just what is that, exactly.

A good example is the current biotech analysis and action.

Biotech strategy, thus far.

No. 1:

Recognize biotech (SPBIO), as bear market leader.

No. 2:

Wait for opportunity to position short via LABD, on an upside reversal; A Wyckoff, up-thrust.

No. 3:

Monitor and increase the short position as the market allows. Continue until targets are met or stopped out (not advice, not a recommendation).

As can be seen, here, here, here, and here, the trade LABD-22-03, is progressing well.

It should be noted, this trade could be over in minutes, or go on for months. The price action itself, will decide when it’s complete (not advice, not a recommendation).

Now, on to gold in general and Seabridge, specifically.

The Gold Reversal

We’ve had several updates that show gold (GLD) has changed hands; from strong to weak.

Quite obviously, this assessment is completely opposite the narrative and the crowd consensus.

However, price action itself, has told us there’s been a reversal.

Recent posts here, here, here, here and here, successively build on themselves showing at this juncture, the gold direction, is down.

Leading Edge Chaos

Evidence continues to build, we’re just on the leading edge of chaos; likely to last for years, if not decades.

Go to time stamp 1:12 at this link and observe one of many efforts already in place to take down the current system.

Chaos, Opportunity, and Seabridge

All of the above brings us to Seabridge Gold (SA).

Going way back, 20-months, to the first post on SA, and taking the following from that report:

“If and when the markets (S&P, Dow, NASDAQ) reverse in earnest, there’s likely to be widespread panic. Just like last time [2007 – 2008] and probably worse.

As a side note: If and when we get there (panic selling), and if SA pushes below well-established support (6-area), the initial plan is to open a major long position … but with a significant caveat.

That caveat is:  We’ll take possession of the actual physical shares (not advice, not a recommendation).  The broker could put up a fuss and charge a fee.  So be it.”

Now, that’s a strategy.

Back then, nearly two years ago, it was not so obvious why having the physical shares was important. I think the reasons for doing so now, are clear.

Let’s move on to the actual chart of SA and look at probabilities.

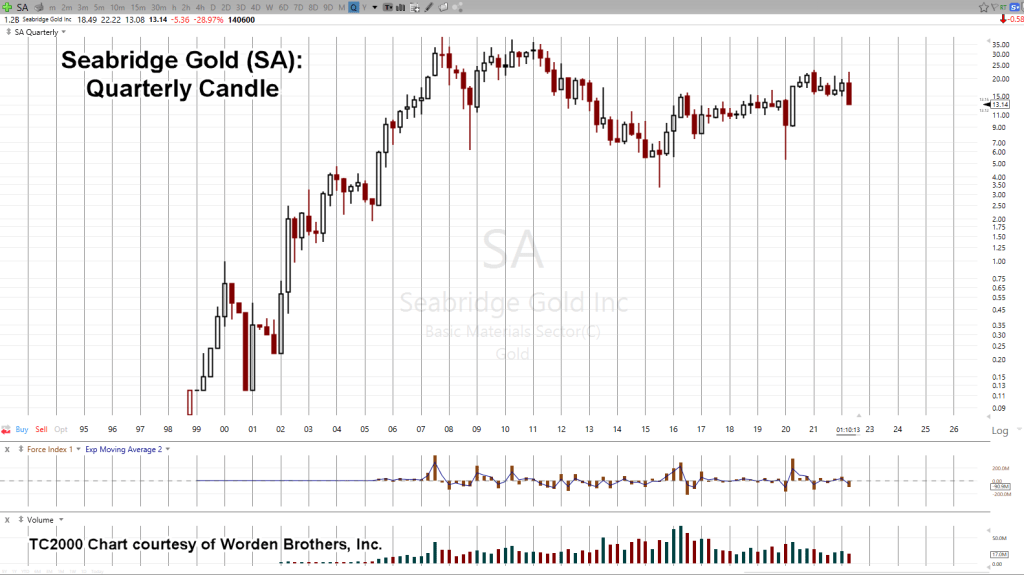
Seabridge Gold (SA), Quarterly Chart

One thing is obvious just looking at the un-marked chart:

The bull market for SA, ended years ago; October of 2007, to be exact.

The actual price of gold (GLD) went on higher for over three-more years. Yet, SA languished.

Now, gold (GLD) has potentially reversed and there’s possibility for significant downside.

How significant? Well, somewhere in the range of $1,300/oz, or even lower.

Which brings us to the same chart of SA but adding Fibonacci projections.

SA, Quarterly Chart, Fibonacci Projection(s)

Getting closer-in with the zoom, we see the market itself has already validated those projections; especially the 38.2, level.

The 50% projection is near 5.00, and the 61.8%, is all the way down to 0.49 – 0.51.

Seabridge down to 50-cents, is that possible?

The Great Depression, 2.0

Those attempting to equate current events with the Great Depression, are at least doing the good work of recognizing the similarities and possibilities.

In the case of Neil McCoy-Ward, (linked above), he recognizes this time, is a whole other animal.

So, the answer is yes … SA could go to 50-cents. If and when it does, nobody will want to buy.

Stay Tuned

Charts by StockCharts

Note:  Posts on this site are for education purposes only.  They provide one firm’s insight on the markets.  Not investment advice.  See additional disclaimer here.

The Danger Point®, trade mark: No. 6,505,279
Gold is Down … What ?

Supposed ‘Safe-Haven’, Goes South

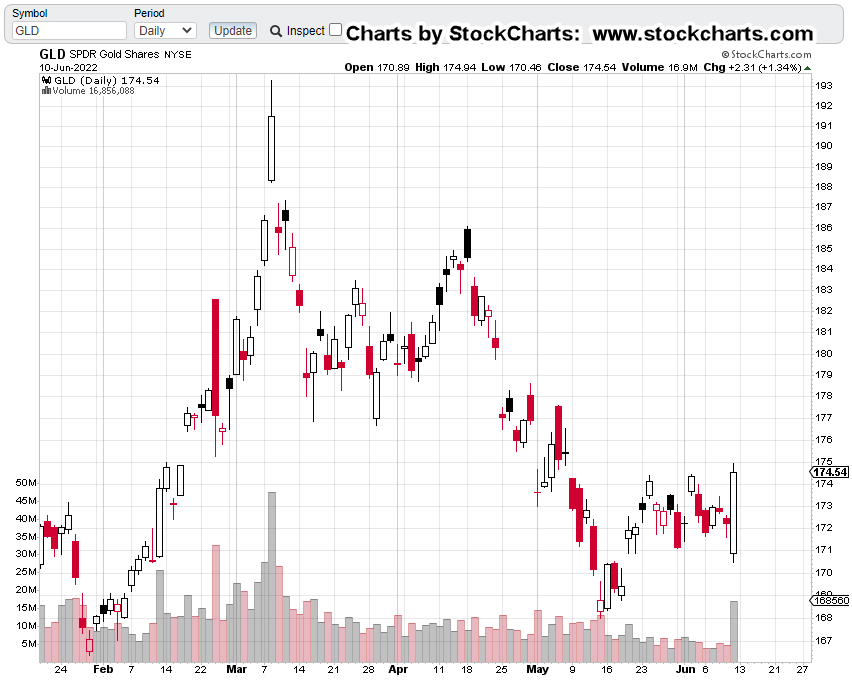
With this morning’s turmoil, gold “should” be higher, right?

Before we even get started, everyone needs to know or be reminded, the word “should” is a ruse; it’s a trap.

Just like there’s no crying in baseball, there’s no “should” in the markets.

Instead, we replace that word with any of the following: Expectation, probability, empirical, set-up, and not the least of which is, ‘price action’.

Case In Point

Gold is down hard but it should be higher.

Coming from that perspective, then leaves you scratching your head, attempting to figure out ‘why’ gold has not moved higher.

With that, off we go on a never-ending rabbit trail having full encouragement of the financial press; making sure you never find the answer.

On the flip side, coming from a Wyckoff perspective, we look at gold (GLD) and ask the following:

What is the market saying about itself?

That brings us to Friday’s action and the chart of gold (GLD), below.

Gold (GLD), Daily

Long-time users of this site may instantly recognize the set-up.

To help make it more clear, we’ll go down to the hourly chart and mark it up.

Gold (GLD) Hourly

There we have it.

The repeating pattern of “Spring-to-Up-Thrust.

Let’s go back to the daily and put in the same notations.

Gold (GLD), Daily

Following on with this morning’s action we have this.

Price action has already posted a new daily low; adding confirmation, the trend remains down.

The fact there was heavy volume this past Friday, sets the hook even deeper into the bulls.

This action, up-thrust plus volume, may result in yet another sustained pivot to the downside.

Summary

It took me twenty-years of diligent search to eventually find the answers to market behavior.

That answer came in 2007, in the form of Wyckoff analysis and the late David Weis, with his video, linked here.

I was fortunate to be mentored by him before he became somewhat of a star … having a waiting list a mile long.

After that, was the constant study of his daily market updates for more nuggets of wisdom.

In a nutshell:

Gold (GLD) reversed today, because price action got itself into an up-thrust condition after launching from a spring set-up.

That’s it.

There’s no CNBC, no Fed, no Fast Money, no Russians, no Hyper-Inflation; just the market, itself.

Stay Tuned

Charts by StockCharts

Note:  Posts on this site are for education purposes only.  They provide one firm’s insight on the markets.  Not investment advice.  See additional disclaimer here.

The Danger Point®, trade mark: No. 6,505,279

Biotech … ‘Brace for Impact’

Downside Leader

From the outset of the bull market’s end, biotech has been the downside leader.

Of the two indices being tracked, IBB and SPBIO, the latter of the two, is the weakest.

Over the past several weeks, it’s been like a terrier on a mailman’s leg concerning positioning short this index (not advice, not a recommendation).

In the end (as we’ll see below), it turns out that waiting for an actual penetration, print, and close above resistance, was the best approach.

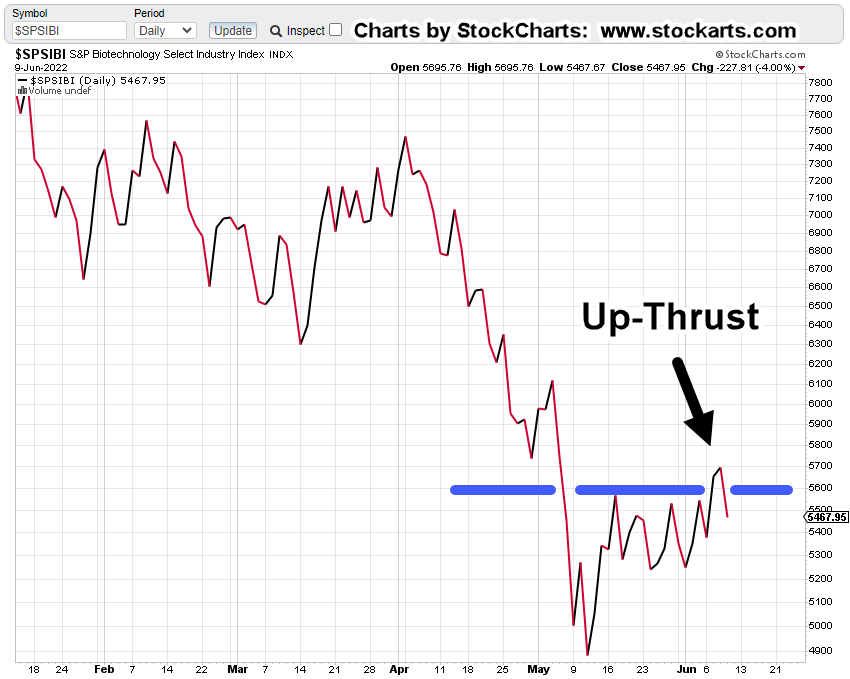
Now, it’s obvious, we’re in a reversal.

The unfortunate part from an economic standpoint, this could be the next big leg lower.

Biotech SPBIO, Daily Close

Penetration and close above resistance (blue line).

Then, price action retreats below resistance and back into the trading range; Wyckoff, Up-Thrust (reversal).

It’s important to note, if SPBIO closes at this level or lower, the prior analysis of ‘grinding to a halt‘ on a weekly close basis, remains valid.

Positioning

Right or wrong, the short position LABD-22-03, was never fully exited (not advice, not a recommendation).

Everyone has their own style.

From a personal standpoint, I despise ‘chasing’ the market. Chasing is for the lazy or frightened who are too afraid to pull the trigger. No thank you.

In fact, the LABD-22-03, position was increased near the end of yesterday’s session.

The intuition, the gut feel, if you will, was ‘This sector’s going to reverse. When it does, it’s going to reverse hard’.

With today’s pre-market action (about fifteen minutes before the open), LABD, trading higher by 3.10-points, or +6.35%, that intuitive assessment is proving correct.

At this point, an obvious stop level would be yesterday’s LABD, low @ 45.77

Stay Tuned

Charts by StockCharts

Note:  Posts on this site are for education purposes only.  They provide one firm’s insight on the markets.  Not investment advice.  See additional disclaimer here.

The Danger Point®, trade mark: No. 6,505,279

Miner Reversal … 7-Weeks Later

Strategy Update … GDXJ

Wyckoff and Fibonacci analysis allowed the reversal of gold miners GDXJ, to be identified to the week and then, to the day.

A quick review of this post, is the reversal on a weekly basis and this one is a follow-up, showing Fibonacci correlation on a daily basis.

If we want to go way-back, this report, shows the miners were not in a bull market and have not been for some time; for years, actually.

That does not mean there were no trades for upside or downside; there were.

However, from a strategy standpoint, gold miners are not bullish.

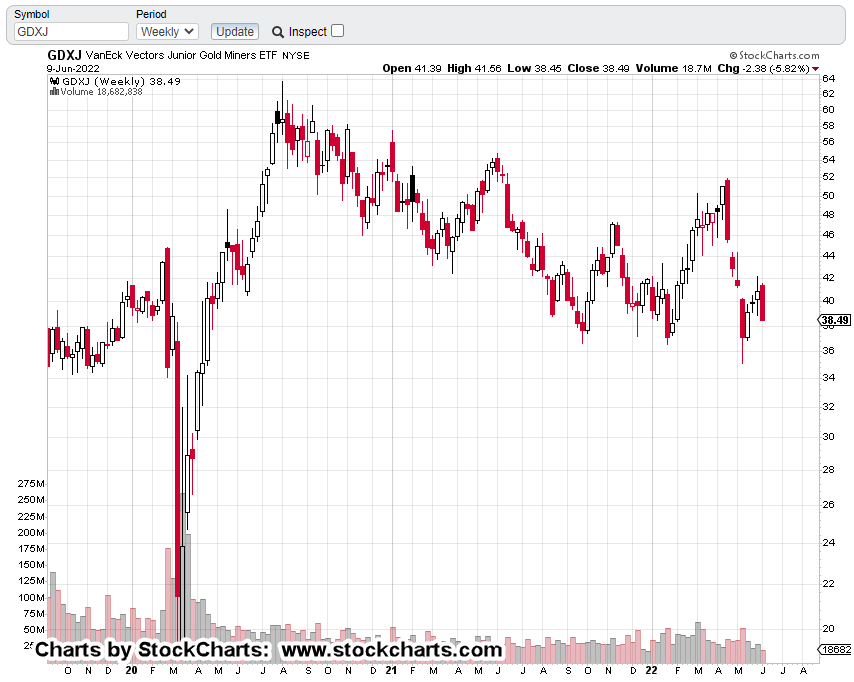
So, let’s look at the Junior Miners GDXJ, as it’s the weakest in the sector.

Junior Miners GDXJ, Weekly Chart

Un-marked

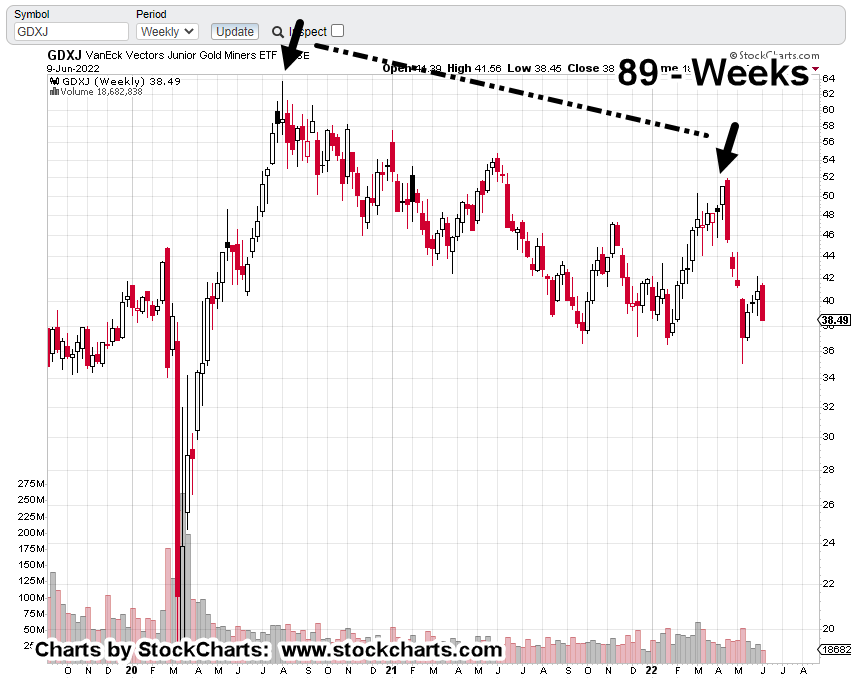
First Mark-up

The reversal is at Fibonacci 89-weeks, plus one day.

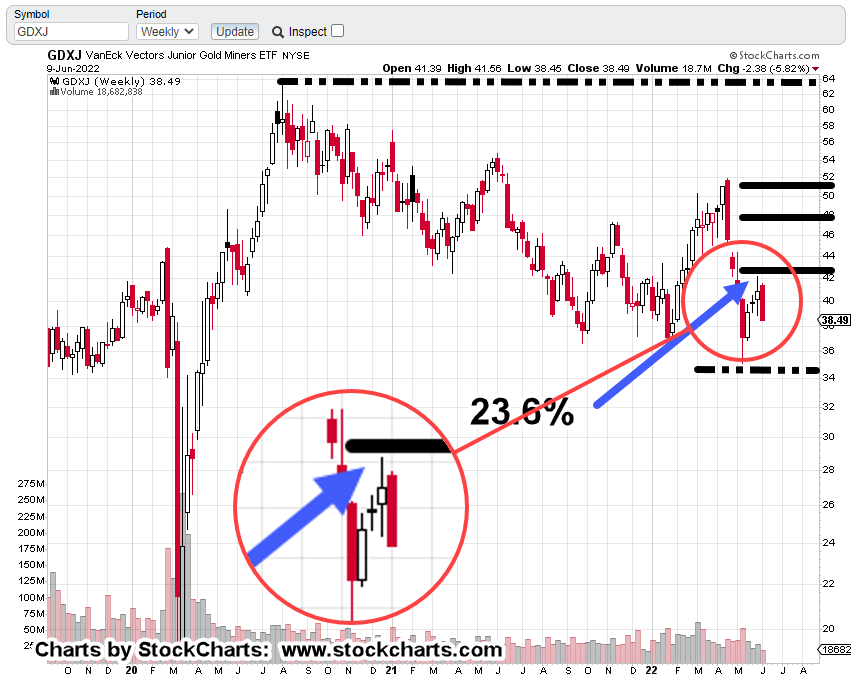
However, it’s the next chart that’s more disconcerting for the bulls.

Price action reversed right at a Fibonacci 23.6%, retrace; indicating severe weakness (if it holds).

The two black lines above the 23.6%, are 38.2%, and 50%, respectively.

The next chart zooms into the reversal area.

This week has already posted a new weekly low, providing additional confirmation of the reversal.

As gold, silver and the associated miners reverse lower, we have news reports of precious metals purchases going off the charts.

Where was everybody in 2001, as gold was bottoming?

That’s, 2001 – to – 2022, a Fibonacci, 21-years.

Which brings us to the next point.

The YouTube “Herd”, is Forming

Several YouTube sites that have been monitored for years, have recently blown-up, passing 100,000 subscribers; more than a few are past 200,000 or higher.

Recently, they have started giving each other ‘shout-outs’, to indicate their approval of that particular site’s ‘content’.

Viewer, Beware

By definition, the ‘herd’, does not have the right answer.

Each one is now monitoring what the other one is doing; they are all, influencing themselves.

The only way to have a hope of getting unique insight is to remain aloof. Wyckoff described this exact phenomenon in his autobiography.

He had very wealthy clients that wanted to get closer (unlimited) access to him. To this overture, he refused.

He isolated himself and remained cloistered.

Summary

Thus far, the analysis of gold ‘changing hands‘ remains intact. Gold continues to be well off its highs; silver is not anywhere close.

Strategy, Tactics, and Focus.

The Junior Miner’s reversal can’t be disputed … there it is.

If precious metals and the miners are not responding to all the ‘money printing;’, then something else’s afoot that’s not being revealed to us in the proletariat.

That ‘something’, is probably starvation … which gets us back to Genesis 41; corn and grain come first, then gold and silver (not advice, not a recommendation).

Stay Tuned

Charts by StockCharts

Note:  Posts on this site are for education purposes only.  They provide one firm’s insight on the markets.  Not investment advice.  See additional disclaimer here.

The Danger Point®, trade mark: No. 6,505,279

Biotech Strategy … Going Forward

SPBIO, Correction Complete

This morning’s action in biotech SPBIO, indicates we’re done with the upward corrective move.

The prior short position LABD-22-02, was reduced throughout the downward push over the past week and then exited completely in this morning’s pre-market session.

Within minutes after the open, as LABD pushed lower (SPBIO higher), it became obvious, a significant reversal was at hand.

It took LABD, just a little over two minutes to clear out stops and then begin an upside reversal.

Amateur vs. Professional

Dr. Alexander Elder covers the amateur/professional difference in his book Come Into My Trading Room.

That is, if an amateur gets stopped out or exits with a loss, they never come back.

Even if the trade reverses to go their direction, they refuse to re-position … having been ‘spanked’ by the market.

Breaking free of the (engineering) perfectionist mindset, is just one challenge during the journey to professional.

It must be overcome to achieve sucess in the markets.

Re-Positioned, Short

All of the above to say, the short in biotech has been re-established: LABD-22-03 (not advice, not a recommendation).

The difference at this point is, there’s a high level of expectation on what’s likely to happen next.

As Wyckoff put it a century ago, the reversal and re-position, enables us to be ‘in tune’ with price action.

Biotech SPBIO, Weekly

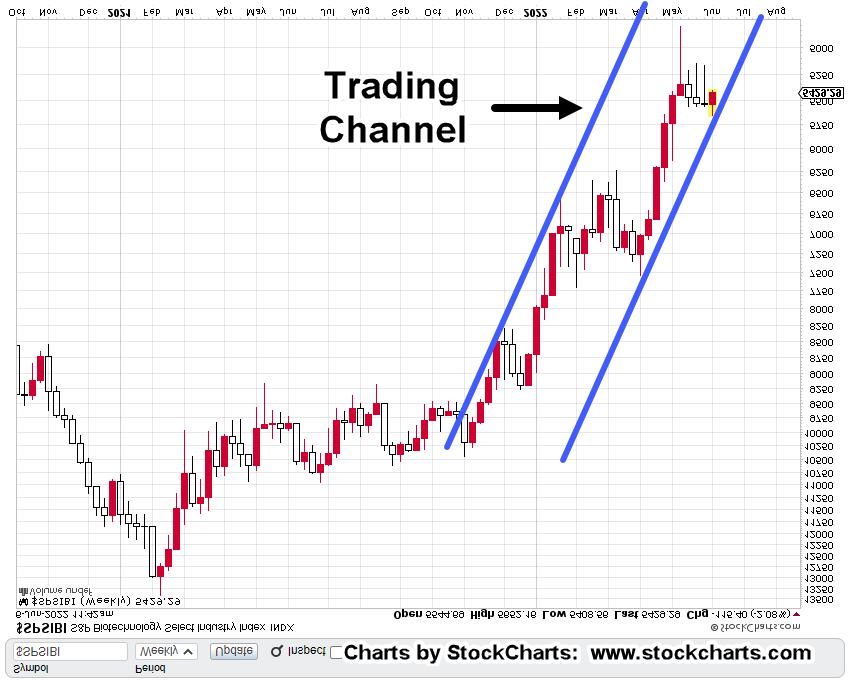
We’re going to invert the chart and mark it up.

First off, we can see the rule of alternation at work.

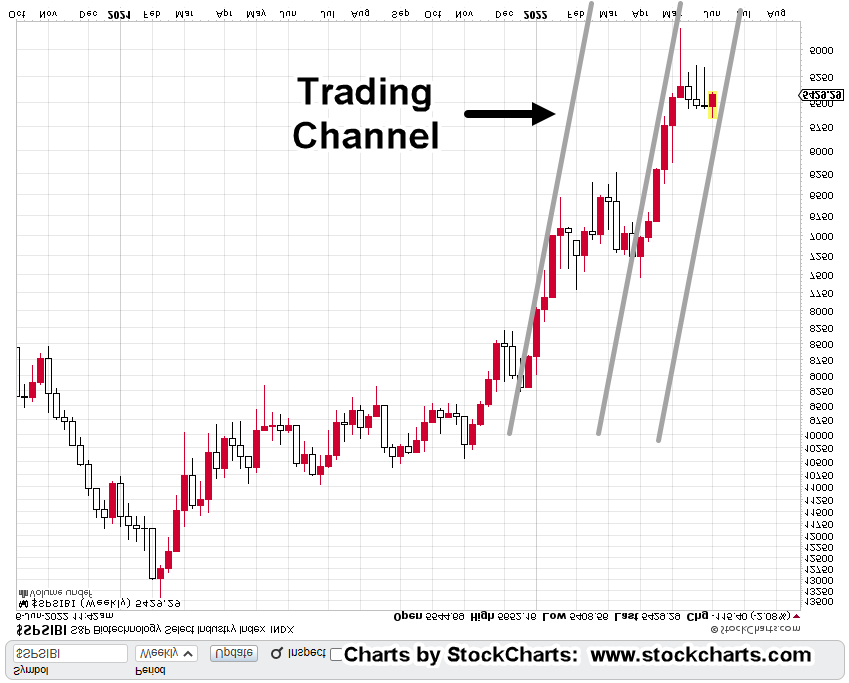
Next, we have at least two potential trading channels.

This one …

And this one …

We’ll let price action itself define which one (or none) is in-effect.

When we get a corrective move that resolves itself, at times, it creates a pivot point with a different rate of advance or decline.

That means, there’s more than a good possibility, the second (more aggressive) channel, is now dominant.

Summary

As this trade progresses, we’ll cover potential areas where the existing position can be increased with as low risk as possible.

As this juncture, LABD is trading in the area of 55.25.

The early (pre-market) loss has been more than recovered and we’re now well in the green for the day.

Stay Tuned

Charts by StockCharts

Note:  Posts on this site are for education purposes only.  They provide one firm’s insight on the markets.  Not investment advice.  See additional disclaimer here.

The Danger Point®, trade mark: No. 6,505,279
S&P Rally to Continue ?

Dan … We’ve Bottomed Out !!!

‘Hey Dan, the worst is behind us.’

That’s going to age just as well as our picture at left.

Toilet paper across my face, makes me feel so much more safe.

Within the first ten seconds in the link above, Dan from i-Allegedly gets into it.

He still, at this late stage, has people contacting him to say we’re past the bottom.

He summarizes those comments by saying, ‘We’re far from the bottom of anything.’

Then, as if on cue, ‘Economic Ninja‘ comes online to let us know, another 200,000 egg-laying chickens have just been destroyed in a ‘mysterious fire’ … imagine that.

Almost becoming background noise to all this, the S&P 500, in a sharp rally on Friday that looks like it won’t stop.

S&P 500, Summary

Friday’s action took the S&P back to test resistance on waning volume while at the same time, posting a Wyckoff spring to up-thrust.

That’s it in a nutshell.

Daily SPY, Close

With markup notes

Getting closer-in on the candle chart.

Futures Market

As of this post (3:31 p.m., EST) the futures are higher by a tad at +0.52%. The question is, will that carry-through into the Tuesday open?

Of course, that’s not known. What we do know however, is that price is at established resistance and in up-thrust (potential reversal) condition.

Even if the ultimate direction for the market is higher, normal behavior would suggest a pull-back to gather more fuel for such an attempt.

Otherwise, we’re at the danger point; conditions have been set for downside reversal.

Stay Tuned

Update 6:47 p.m. EST:

S&P futures dropping … now up only +0.17%

Charts by StockCharts

Note:  Posts on this site are for education purposes only.  They provide one firm’s insight on the markets.  Not investment advice.  See additional disclaimer here.

The Danger Point®, trade mark: No. 6,505,279

Economic Free-Fall

Anecdotal Data, Says Implosion

As we speak, economic activity is shutting down … fast.

Amazon shipments cancelled, gas stations going dry, banks halt lending, real estate sales collapse.

Meanwhile, the market’s in a short-squeeze.

What happens next?

We’ll discuss real estate and biotech farther down but first the data sources.

Dan from i-Allegedly reports here, he still has a couple of rubes (my word) that think the market just bottomed out.

Good luck with that.

As we’ll show below, the real estate bear market (IYR) rebound, was identified ahead of time.

Next, we have Red Hurricane describing one semi-trailer load after another being cancelled. He hauls for Amazon.

Shipping activity’s contracting, seemingly, by the minute.

Lastly, this link where the D-word, ‘Depression’ is used within the first one-minute, twenty seconds.

Bottom-out in the stock market? Probably not.

So, let’s take a look at real estate IYR, and see where it might go next.

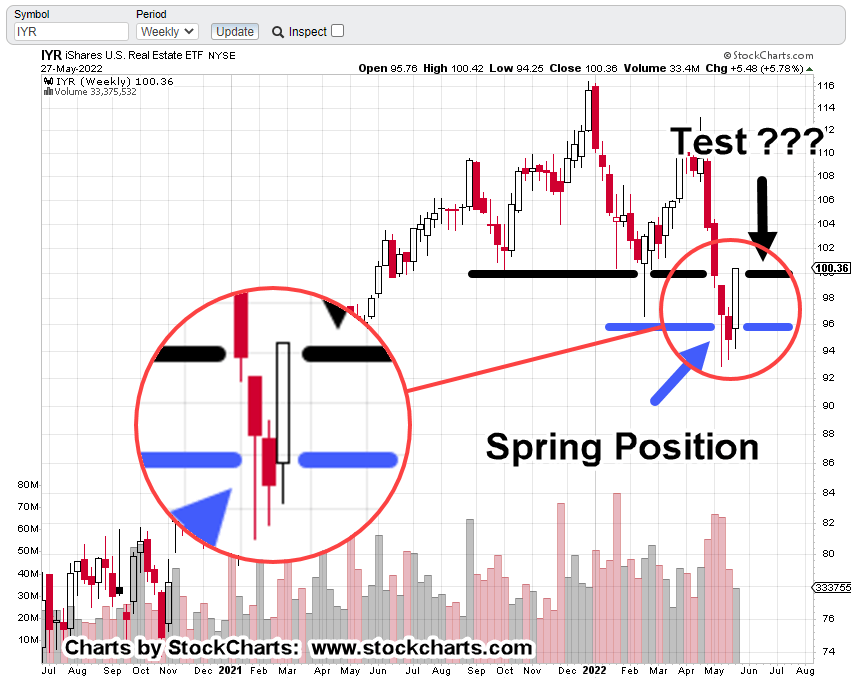
Real Estate IYR, Weekly Chart

The last update (link, here) showed potential to rise into a test of resistance. That’s exactly what happened.

Back then:

And now:

With zoom

Obviously, the upward test happened much quicker than anticipated … but it was anticipated … no surprise.

Real estate got itself into Wyckoff spring position; so, a rebound (test) is normal market behavior … short-squeeze or not.

If it was a squeeze and if it’s over, we can expect an immediate drop in price action. We’ll analyze that as it plays-out in the coming week.

Now, on to biotech, SPBIO

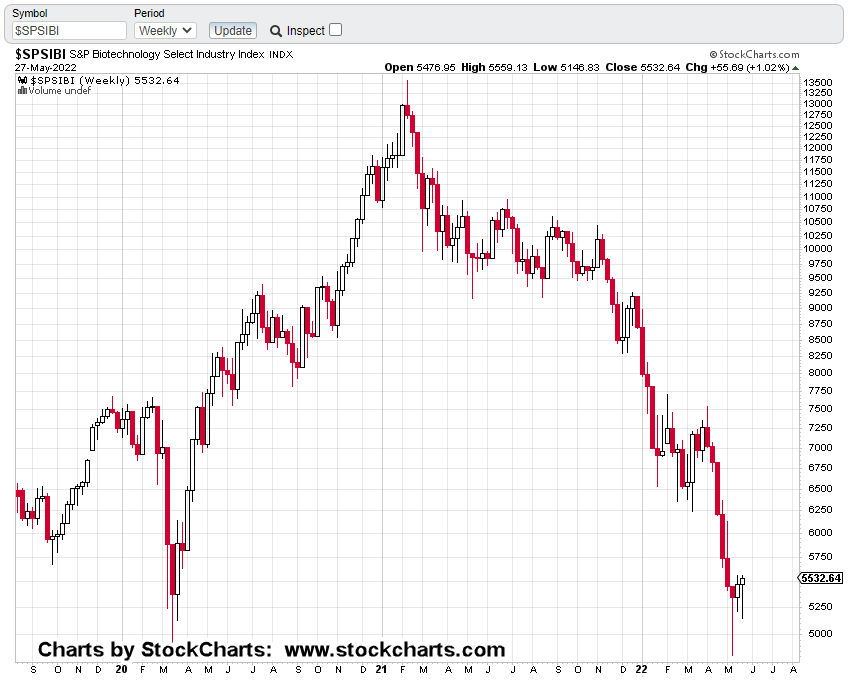
Biotech SPBIO ($SPSIBI), Weekly

Some housekeeping first.

Obviously last week, with being short, more downside action was anticipated resulting in upside for LABD.

On Friday, that did not happen. Biotech was part of the squeeze as well.

The short position via LABD, identified as LABD-22-02, was reduced but not exited completely (not advice, not a recommendation).

At present this is where we are.

First, we’ll start by inverting the chart to mimic the action of 3X inverse, LABD.

Next, we’ll zoom-in and highlight the ‘squeeze’.

Doesn’t look like much when viewed that way does, it?

Next, we’re going to zoom-in, on the zoom

In spite of all the squeeze chaos on Friday, price action could not post a new weekly low (high on the non-inverted).

We’ll see this Tuesday, if that’s important or not.

This post is getting long but let’s end with the rule of alternation. The same chart is marked up below.

If this rule is still in-effect, we’re at a juncture where one can expect a ‘simple’ alternation.

We’ve already had complex action on the prior congestion; so, we can expect current action to be simple in character.

That means, price action’s not likely to stick around at these levels whether it’s going up or down.

Based on the above analysis, the expectation for Tuesday’s open is a gap lower for SPBIO and higher for LABD.

If that does not happen, something else is at work … we’ll report on that as necessary.

Summary

Has the market bottomed out? Not likely.

Those who are at this late stage, still arguing with Jerimiah Babe and Dan (and Patera), that the market’s rebounding, everything’s fine, are in a state of delusion.

The mindless herd following spending with ever newer cars, moving up to the McMansion, opulent vacations, posting it all on Facebook is most decidedly, gone.

It’s finished. It’s Done.

The problem is, as J.B. notes above (time stamp 7:15 and 8:30), those still living that life don’t seem to know it’s over.

For the leaders, the tiny minority and those reading this post, who are, or who have been preparing for years, it means potential huge (life changing) opportunities.

That is, as long as the markets, the banks and other infrastructure stay open; not guaranteed in any way.

Stay Tuned

Charts by StockCharts

Note:  Posts on this site are for education purposes only.  They provide one firm’s insight on the markets.  Not investment advice.  See additional disclaimer here.

The Danger Point®, trade mark: No. 6,505,279

‘Investors’ Buy Dip Over & Over

“Fuel” For The Downside

Once this next level gives way, carnage will (likely) reach all-time records.

Over a centry ago, Wyckoff said in his writings, it’s those on the wrong side of the bull trade, who provide the fuel on the way down.

As reported by Reuters, that downside fuel appears to be building on a massive scale.

The Fed This … The Fed That

What a colossal waste of time … that is, trying to figure out what The Fed is, or is not, going to do.

As The Maverick reports in this update, The Fed has a higher authority. It should be no surprise to any of us at this point … they’re ‘just following orders’.

Mirroring that sentiment is Dan from i-Allegedly, saying ‘This is not the bottom‘.

Part of the reason there’s so much focus on earnings, financials and The Fed, is that it’s a whole lot easier to do that, than actually getting down to work and learning price action.

That my friends, as Wyckoff said in his text Studies In Tape Reading, ‘takes many years and many losses’.

So, let’s take a look at what that ‘tape’ is telling us concerning the biotech market.

Biotech Inverse BIS and LABD

The prior analysis on IBB, is still valid.

However as was done with real estate, changing from 2X inverse to 3X inverse, the same has happened with biotech; from BIS, to LABD.

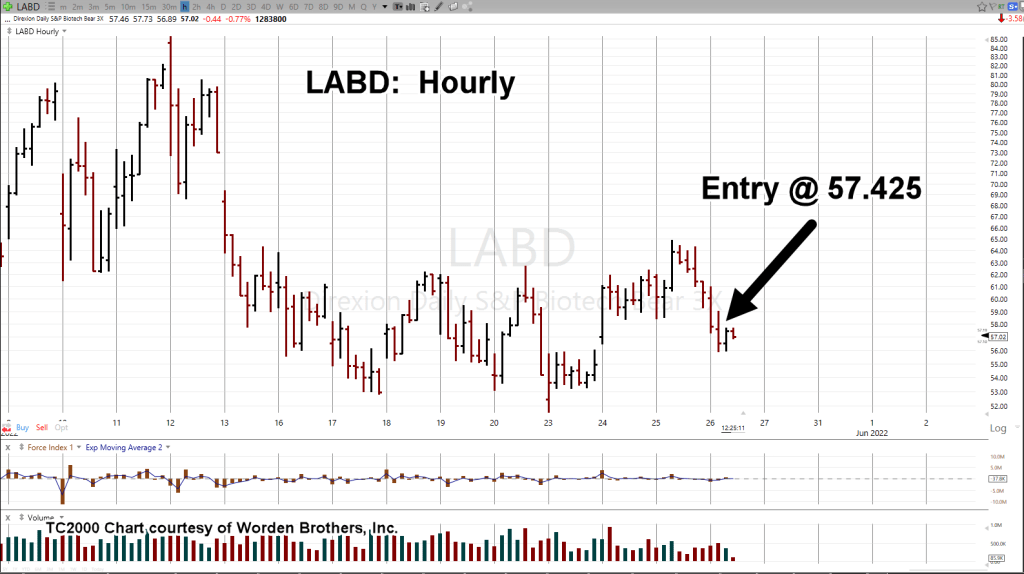
Since the overall bearish assessment has not changed, this morning’s upward move in the markets was used to re-position to a higher (inverse) leverage vehicle … LABD (not advice, not a recommendation).

The hourly charts below show the exit of BIS and the entry of LABD.

Biotech 2X Inverse, BIS

Biotech 3X Inverse, LABD

As this post is being written 12:55 p.m., EST, price action’s at the danger point.

We’re at the extreme; the risk is least but price can go either way.

Summary

Watching that action in real time, it looks like LABD wants to go higher; currently trading at 57.20-ish.

If LABD is higher, that means SPBIO, is moving lower.

Unless price action of biotech (IBB, SPBIO) and the overall markets signal a change of behavior … the bear move is still in play.

If we get a significant break lower, ‘retail’ that’s not positioned properly, will provide the majority of downward thrust energy.

It’s no different than it was in Wyckoff’s time, over a century ago.

Stay Tuned

Charts by StockCharts

Note:  Posts on this site are for education purposes only.  They provide one firm’s insight on the markets.  Not investment advice.  See additional disclaimer here.

The Danger Point®, trade mark: No. 6,505,279

Real Estate … Critical Mass

Struggling to Break Out of Wipeout

It’s still early in the session and it looks like real estate’s in serious trouble.

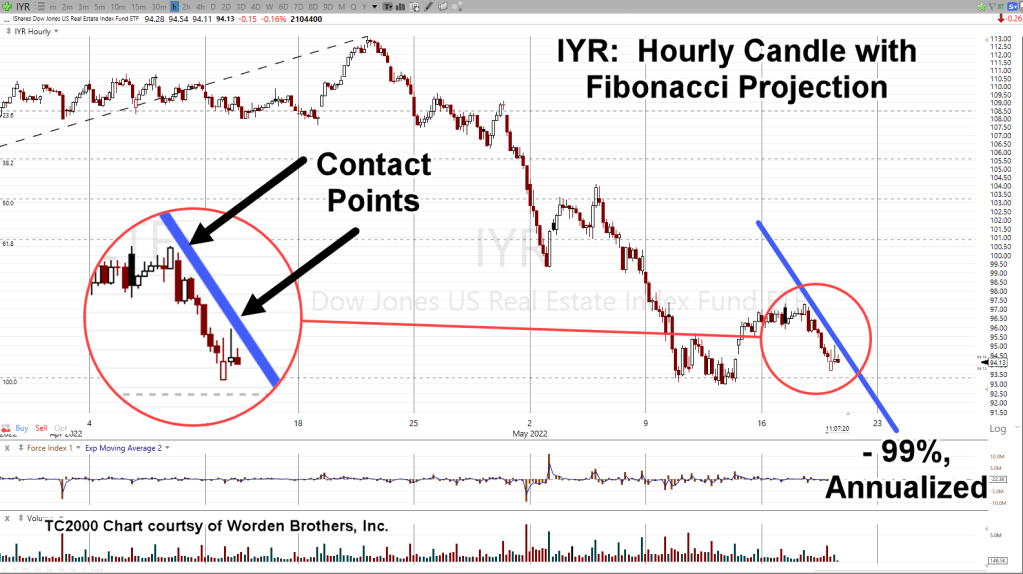
A change of events putting IYR declining at – 99%, annualized.

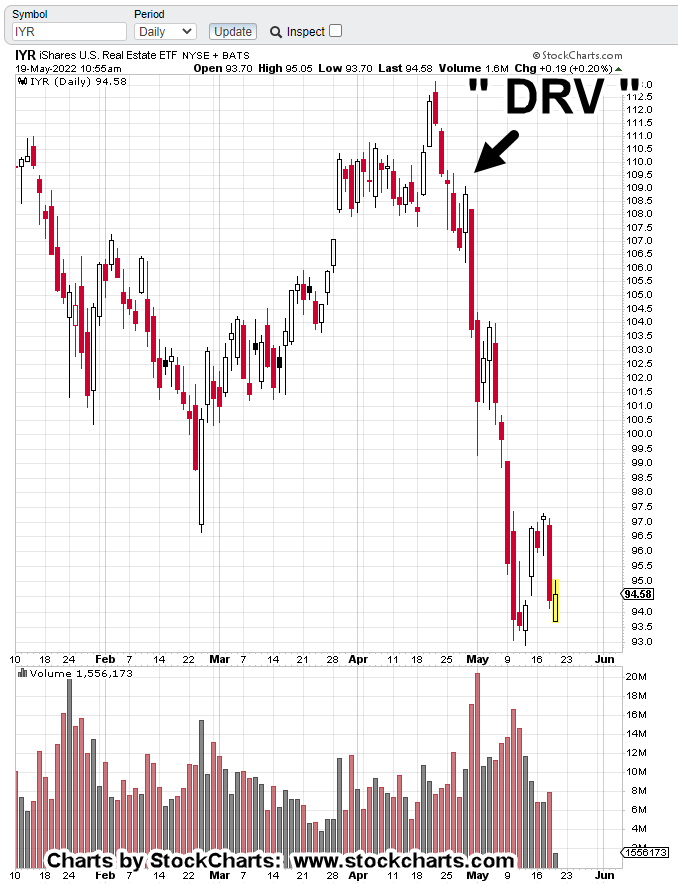
Several charts of real estate IYR, are presented below; not the least of which is the location of the first ‘DRV’ (3X inverse, IYR), entry.

Strategy, Tactics and Focus are the three tenets laid out by Livermore, Wyckoff and Loeb respectively.

Strategy: The real estate sector is ‘finished’ for this bubble go-round. Look for significant medium to long term trading (position) opportunities.

Tactics: Use Wyckoff analysis to identify the exact location where risk is least; The Danger Point

Focus: Significant trading opportunities are rare. When one is found, it must be used to its fullest extent.

This site presents the method above, in real-time.

The first chart of IYR shows the location of the initial DRV entry (not advice, not a recommendation).

Real Estate IYR, Daily

Positioning short this sector has been fully documented here and here.

As a result of yesterday’s action, also anticipated and documented here, the sector may have pivoted into a sharper trend; a trend declining at – 99%, annualized.

Is that a hyperbolic statement? Not if it happens.

As this post is being created, we’re going to look at the hourly chart of IYR (below) and show that price action is struggling to stay away from that -99%, trendline.

IYR: Hourly Chart

We’re at the top of the hour (11:00 a.m., EST) and the hourly candle may have just confirmed the new trend.

Summary

As said many times on this site, when or if, a major break occurs, there will be no getting in or out (not advice, not a recommendation).

At this juncture, now fifteen minutes past the top of the hour, price action is still struggling.

If it continues lower, does not break the trendline and prints below last week’s low of 92.89, it’s a serious event; more confirmation of the new down-trend.

Stay Tuned

Charts by StockCharts

Note:  Posts on this site are for education purposes only.  They provide one firm’s insight on the markets.  Not investment advice.  See additional disclaimer here.

The Danger Point®, trade mark: No. 6,505,279