The last update’s high probability set-up was negated at the next session … only to morph into another high probability.
We’ll go straight to the FXI, leveraged inverse fund YANG.
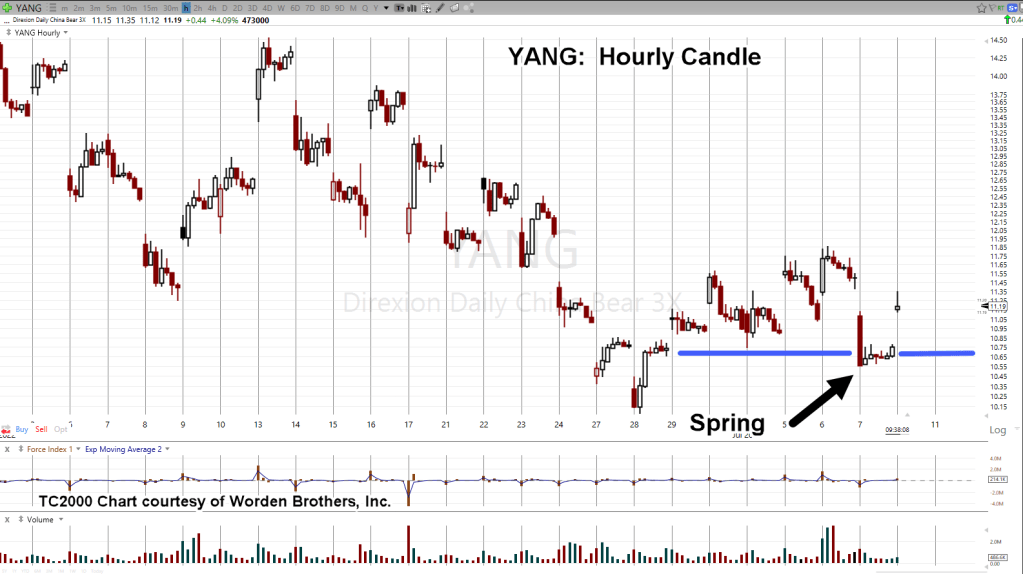
FXI, Leveraged Inverse YANG, Hourly
It’s about twenty minutes after the open and YANG is trading at around, 11.15 – 11.16.
The chart below shows a Wyckoff spring set-up in progress.
What’s missing at this point, what’s to be expected during this session or next, is the test.
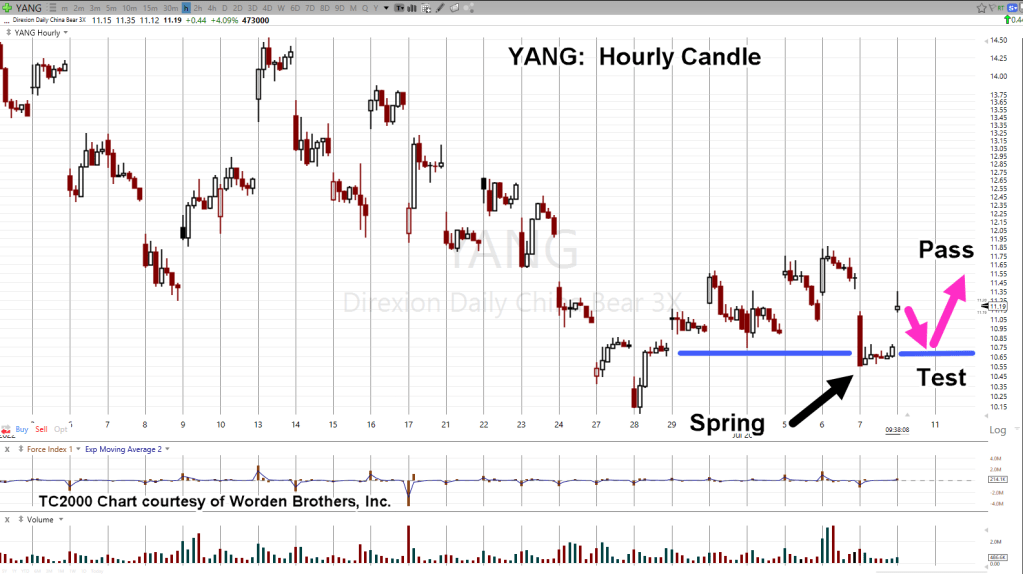
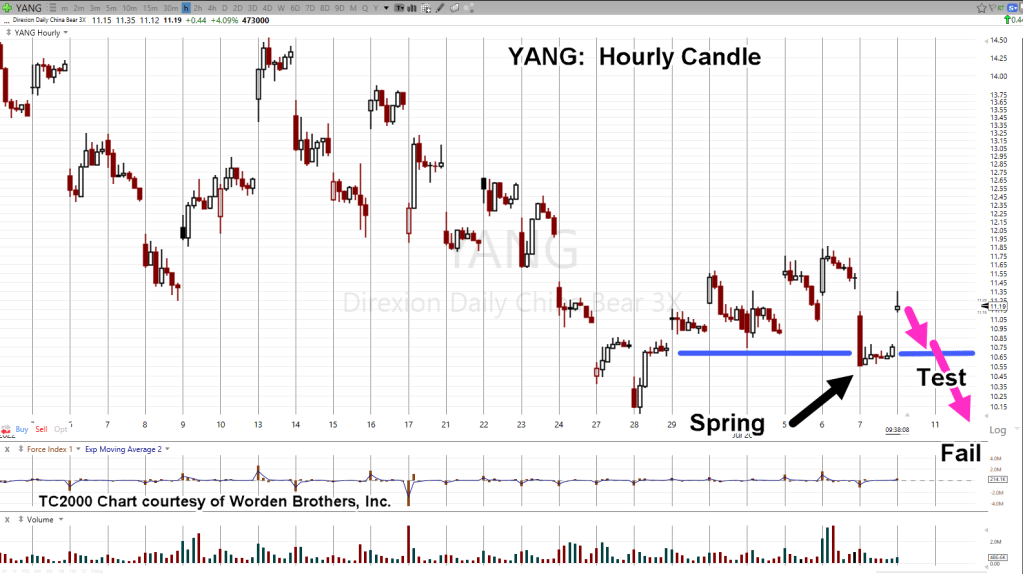
That same hourly chart is marked up below to show how that test may look with a pass or fail.
Risk on a position short FXI via YANG (not advice, not a recommendation) can be reduced by allowing YANG price action to retrace as much of the opening gap as possible.
It’s Friday and we’re heading into the weekend.
Does anyone really want to be positioned long? 🙂
It’s not as if anything bad is happening.
Nothing like British Members of Parliament (and the Prime Minister) turning in their resignations … all staged but that’s a whole other story.
Note: Posts on this site are for education purposes only. They provide one firm’s insight on the markets. Not investment advice. See additional disclaimer here.
And so it was. Short position in real estate, closed out.
Even with all the analysis, real estate (IYR) has pushed higher. The short position via SRS (SRS-22-01) was exited just below the stop @ SRS 16.33.
Exiting a trade, frees the mind to look elsewhere for opportunity.
Typically, one would have to wait days or even a week or so for something else to be available.
However, despite appearances, the market is moving very fast at this juncture.
Looking around in those markets, we have a textbook entry signal (to go short) the FXI (not advice, not a recommendation).
David Weis & The Video
Many times, on this site (actually, for years), the Weis video has been recommended.
Next to Wyckoff’s treatise from 1910, Studies In Tape Reading, that video is probably the most important one could ever watch concerning the markets.
In it, he describes a ‘trick’ as he calls it, to get aboard a market that’s already underway. At the time, his discussion was using DE (if memory serves), as the trading vehicle.
That ‘trick’ is highlighted below on FXI
China Index FXI, Daily
This is how the chart looks early in today’s session.
Next, we’re going to invert the chart to mimic what’s seen on leveraged inverse fund YANG.
And now, the signal zoomed-in
The above price action is nearly exactly as presented in the Weis video; even though it was recorded fifteen-years ago.
The above signal is not a guarantee.
It is, however, a high probability low risk set-up (not advice, not a recommendation).
The entry signal was triggered at approximately YANG 11.75, with a stop at YANG 11.02, for a ‘risk’ of 0.73/share (not advice, not a recommendation).
Summary
As this post is being created, YANG is retracing and is currently trading near 11.67, narrowing the distance from any potential entry to the stop.
On a very long term (Monthly) basis, there are interesting things happening in FXI. We’ll be covering that soon in another update.
Note: Posts on this site are for education purposes only. They provide one firm’s insight on the markets. Not investment advice. See additional disclaimer here.
The Danger Point®, trade mark: No. 6,505,279
Active: YANG (YANG-22-02), entry @ 11.83, with stop @ 11.30
‘Sometimes it seems as if the market hangs in the balance by the weight of a feather.’: Wyckoff, circa 1910.
Is this the big reversal to the downside?
Before we get to that answer, let’s review two recent market pivots (including today).
A Day To Remember
Back on May 4th, the post with the same title, linked here, was to be used for reference on a go-forward basis.
The post has a linked article, whose comment section could be surmised as the bourgeois rebuke of a 78-year-old fund manager.
That manager was quoted as saying, “It’s the biggest bear market of my life”; to which the younger crowd responded with derision, effectively saying the old man’s a dolt, an idiot, a doofus and needs to retire.
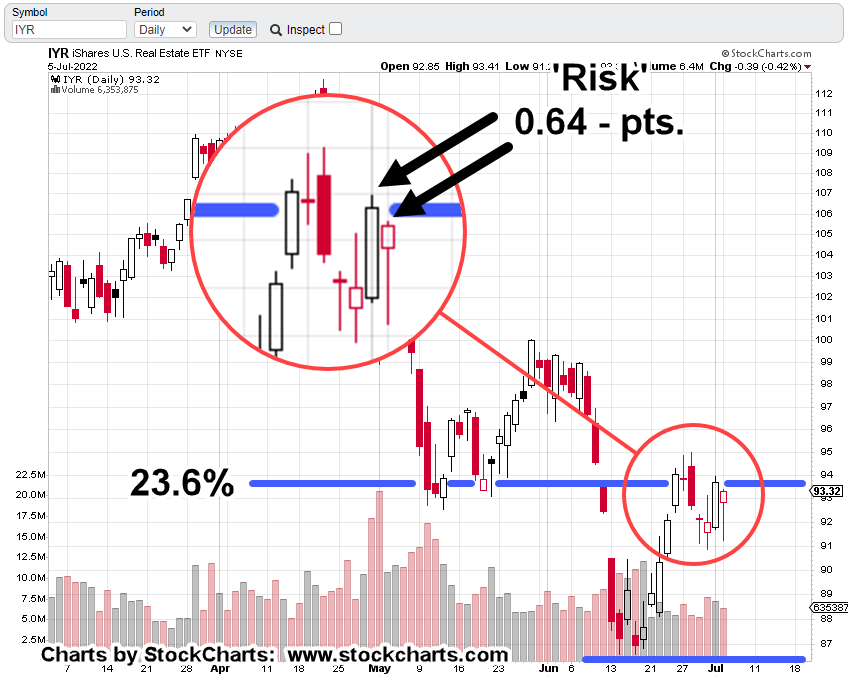
Now that time has passed, let’s remind ourselves when the quote was published with the daily (IYR) chart below.
Not only did IYR, not close higher after that, it never printed higher either. It was the top of the pivot reversal, to the day.
The 23.6%, Retrace
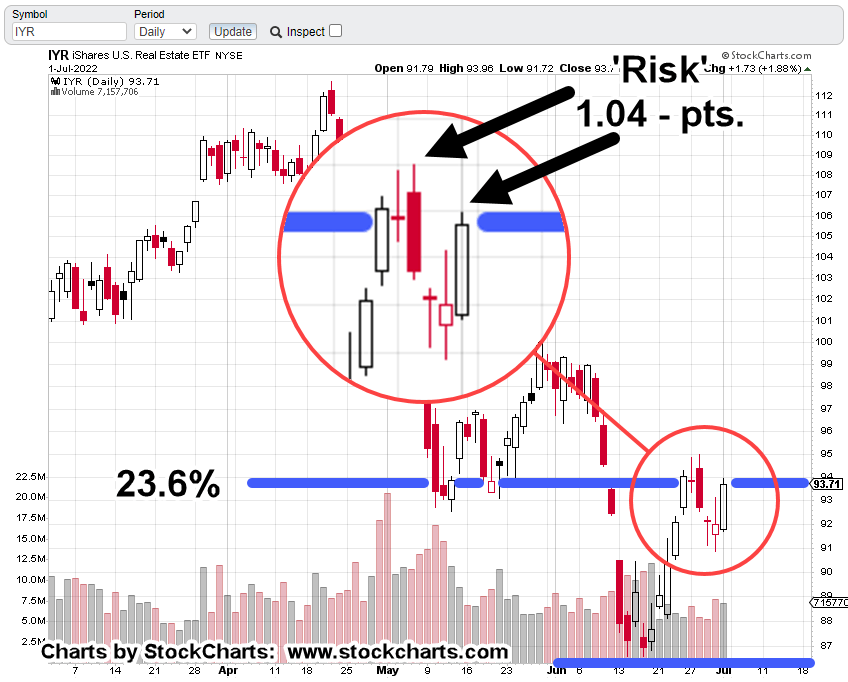
Then we have this report just days ago, showing IYR’s price action coming back to a (very weak) Fibonacci 23.6%, retrace.
The daily chart repeated below, showed the ‘risk’ on a short position as approximately 1.04-pts (not advice, not a recommendation).
Risk Narrows Even More
As a result of today’s new daily low and lower close, one can (theoretically) reduce the risk of a short position even further (not advice, not a recommendation).
The risk is now defined as the distance between today’s close (IYR: 93.32) and Friday’s high of IYR: 93.96
A subsequent push above Friday’s high negates the short and would likely indicate a potential move to a 38.2%, retrace.
Subtleties of The Market
A lower daily print and marginally lower close (IYR down just – 0.39-pts.) does not look like anything of consequence.
Could we be right in the middle of a historic crash and not even know it?
Of course, it’s never for sure, until it’s over.
However, if shorting opportunities are being spotted, entered, and managed correctly, probabilities are that one will already be positioned short when ‘the big one’ hits.
Note: Posts on this site are for education purposes only. They provide one firm’s insight on the markets. Not investment advice. See additional disclaimer here.
The Danger Point®, trade mark: No. 6,505,279
Active: Positioned short via SRS (SRS-22-01), with stop at SRS: 16.38
Anyone who thinks the Fed’s going to ‘pivot’ because the numbers are weak, does not understand (or won’t admit to) the real purpose of the entity; but I digress.
The Strategy
Way back in December of 2020, this post was released which discussed ‘Genesis 41’, specifically.
It was an intuitive assessment; we’re in a phase where corn and grain (i.e., the food supply) are potentially more important than ‘stacking‘ silver or gold.
Over the ensuing year and a half, how correct, that has proven to be.
Then, nine-months ago, was this post, presenting the ‘elephant’; a massive population decline whose repercussions would last the lifetimes of anyone reading.
Now, we have this. A report that confirms the elephant.
It’s all starting to hit the mainstream, although the language is still being couched to not cause undue panic. Good luck with that.
So, what’s next?
The Danger Point: Real Estate
While mainstream press and money managers alike struggle to figure out the obvious, we have price action itself telling us the next likely direction of the market.
During an economic downturn there are many places not to be such as semiconductors, airlines and other low margin businesses, restaurants and so on.
However, the most illiquid of all, is real estate. It does not matter how bad one wants to sell, if there is no buyer, there is no sale.
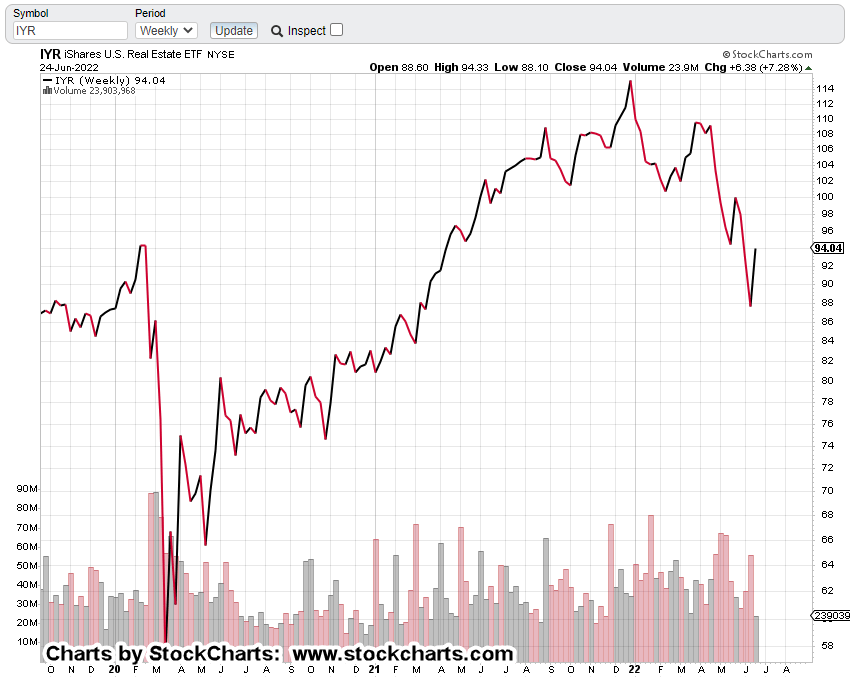
Real Estate IYR, Weekly Chart
Last week, real estate IYR, closed right at the Fibonacci 23.6% retrace as shown.
Getting closer in on the daily, it’s marked up to show the risk from a shorting perspective (not advice, not a recommendation).
Real Estate IYR, Daily Chart
In this case, the risk on a short position is defined as the distance from last Friday’s high (IYR: 93.96) to that same week’s high of IYR: 95.0
Let’s add, Friday’s action saw IYR, retrace a Fibonacci 76.4% (the most available) of the entire move for the week.
The Summary
Amazon (AMZN), ProLogis (PLD), and Real Estate IYR, are joined at the hip.
Now the economy’s imploding, massive warehouse space is not needed.
Ditto that for employees as well.
ProLogis is already down – 31.2%, from its all-time highs set just this past April.
We’ve already shown PLD, has a nasty habit of going straight down during a market route.
Last time, PLD, crashed over – 84%, in just two months.
Note: Posts on this site are for education purposes only. They provide one firm’s insight on the markets. Not investment advice. See additional disclaimer here.
Note: Posts on this site are for education purposes only. They provide one firm’s insight on the markets. Not investment advice. See additional disclaimer here.
As far as is known, no other site has identified, gold (GLD) has “changed hands” with the next probable direction, as sideways or down.
That is, until now.
Sometimes, it literally takes years to find anything useful from mainstream financial media. However, you really can’t blame them; it’s not their job to reveal the truth.
By chance, every once in a while, someone makes a mistake and bits of truth, escape.
That may be where we are with the following Kitco NEWS interview, linked here.
It’s worth a half-hour to watch the entire exchange but for us, the real business starts at time stamp: 19:05.
The Overall Gold, Premise:
If the dollar moves sharply higher and the markets move lower (or crash), gold’s response may be a wash-out to $1,300/oz., or lower.
“Changing of Hands” as identified on this site, was mostly intuitive. We won’t know for sure if it was the (real) inflection point until gold resolves itself.
Now, we have another view from a separate party (above), that at least recognizes gold’s downside potential.
With that said, let’s look at gold (GLD), Quarterly
Gold (GLD), Quarterly Chart
There are only two trading days left in the quarter; it’s reasonable to think we’ll get something similar to the un-marked chart below.
The next chart shows the Wyckoff up-thrust (reversal) along with an attempt to move higher (the test) that was rejected; prices continued lower.
The next chart is the one no gold bull wants to see; downside projection(s).
Using a standard Fibonacci tool, we have the above projections.
If there’s a major unwind of gold positions, price could decline to the GLD, 133-area, corresponding roughly to physical gold @ $1,300/oz.
Uncharted & Unprecedented
The caveat: We’re not in any time that’s happened before (other than maybe the collapse of the Roman Empire).
It’s uncharted territory.
We should expect market events to reach never before seen extremes. That would include the potential for a severe draw-down in gold.
The World, Then
If gold gets to the $1,300/oz level, it would easily be considered a buying opportunity.
What if gold keeps going lower, moving below $1,000/oz?
The second projection, targets approximately $950/oz.
What, then?
What if the $1,300 level, was bought by those with means, using both hands … including massive margin (if it’s still available).
What happens if there’s another leg down; then margin calls?
Can’t happen one might say.
Well, oil going negative for the first time in history couldn’t happen either … until it did.
Note: Posts on this site are for education purposes only. They provide one firm’s insight on the markets. Not investment advice. See additional disclaimer here.
That’s the assessment from agents in the field on the imminent real estate implosion.
Interest rates have risen dramatically, applications have evaporated, properties not moving as before, prices are dropping, lenders deploying the last resort; Adjustable-Rate Mortgages (ARM).
When the ARMs, show up in force, it’s over.
Technical & Fundamental
Over the past several days, the real estate situation has been assessed from both a technical (chart) perspective as well as the fundamentals.
The bottom line (below), is so long, it may have to be covered in several posts.
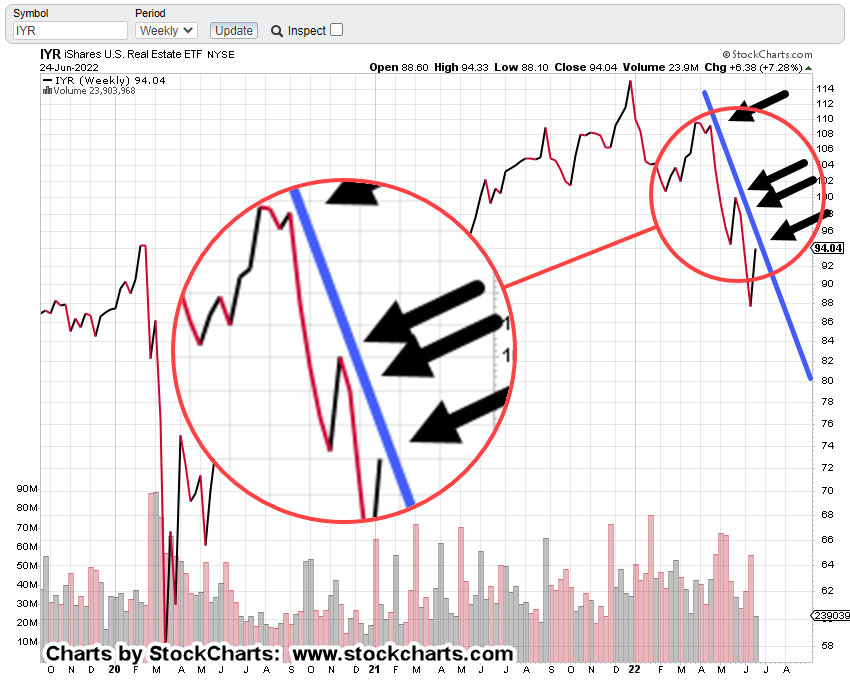
On a weekly and daily close basis, IYR has contacted underside resistance.
On a weekly and daily close basis, IYR has contacted the right side of a downward trading channel.
Multiple gap-fills at IYR, 91 and 94. Volume declines over – 22.5%, on the second gap-fill.
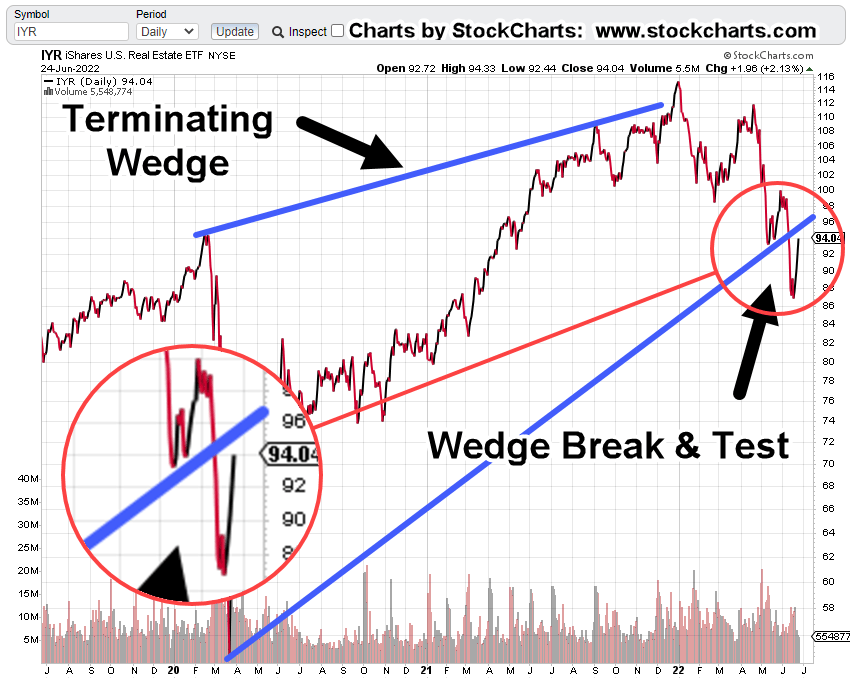
Multiple rising wedge breaks on multiple time-frames signal a potential drop of – 41.5%, from current levels.
Trading volume contracting (as price is rising) on multiple time frames, indicates potential lack of trader commitment to higher prices.
Financial press gets in the game (with several reports), saying ‘now is the time to buy’.
As highlighted above, once the Adjustable Rates dominate, the top is in.
This top may be far worse than ’07 – ’08, as debt levels are much higher, consumer is tapped-out and there is a massive ‘elephant’.
That elephant is now going mainstream with the resultant effect of unprecedented population decline/disablement.
So, let’s get started.
Real Estate IYR, Weekly Close
Un-marked chart.
Test of underside resistance
Zoom of underside contact.
Right side trendline.
Zoom of contact points.
Trading Channel
Wedge Break: Daily Chart
Zoom of break and test
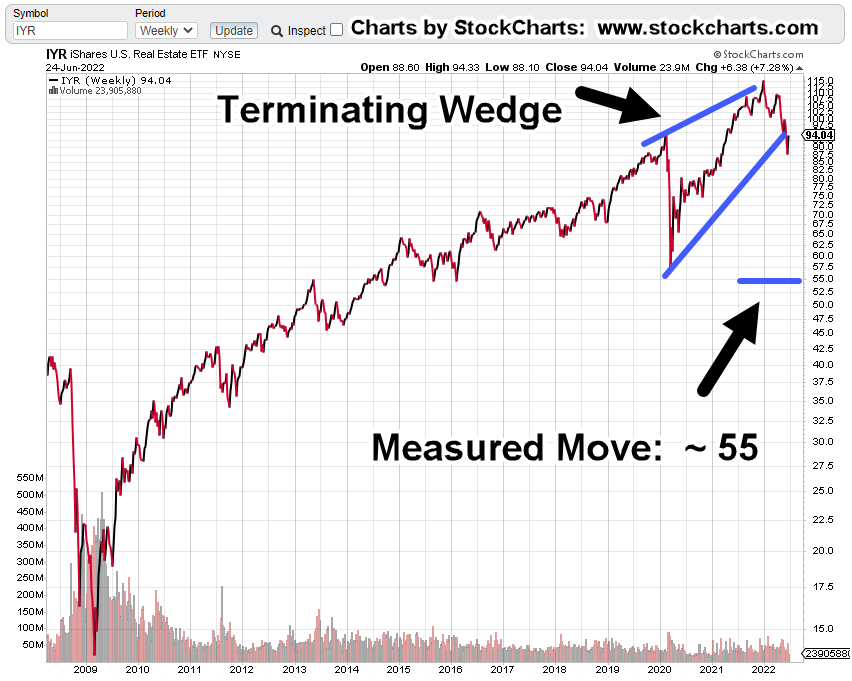
Wedge Break: Weekly Chart
Note:
A measured move to 55-area, gets IYR, back to 2020 lows. That’s a reasonable expectation for an initial leg down.
If we use Prechter’s assessment concerning bubbles (manias), price action eventually retraces every bit (sometimes more) of the entire bubble move.
That puts the ultimate destination of IYR, somewhere in the vicinity of 14.0, or lower, representing a decline of – 88%.
It was going to be $3,000/oz., in months, not years.
Gold-O-Mania was coming. You could even sign up and pay money to read the group-think of the imminent launch.
Well, obviously at this point, $3,000/oz., is nowhere in sight.
Gold (GLD) is even lower now than it was then. On top of that, the ‘changing of hands’ assessment has not been negated; prices continue to grind lower.
Having the financial press cheerlead at the exact wrong time, is an (almost) necessary component to identify a lasting reversal.
As we can see here and here, the financial media’s position is, we’re heading higher. There is ‘real buying’ (whatever that is) for the first time in weeks.
However, from the chart evidence presented above (and we didn’t even get to ‘gap-fills’, ‘multiple wedges’, ‘contracting volume’ … maybe later), it’s hard to present that price action will somehow move significantly higher.
Price action behavior above, appears to point to an immediate or very near-term downside reversal.
Summary
Lastly, we have this from Activist Post: Real estate housing crash in progress.
Be careful. If you read the article, can you see the ruse?
It’s been discussed before on this site. That is, the real purpose of the Fed.
Note: Posts on this site are for education purposes only. They provide one firm’s insight on the markets. Not investment advice. See additional disclaimer here.
Is this trade set-up still viable and/or worth the pursuit?
Short answer (at this point) is yes, and yes.
We’re going to look at the tape (the chart) and let it tell us what’s happening from a Wyckoff analysis perspective.
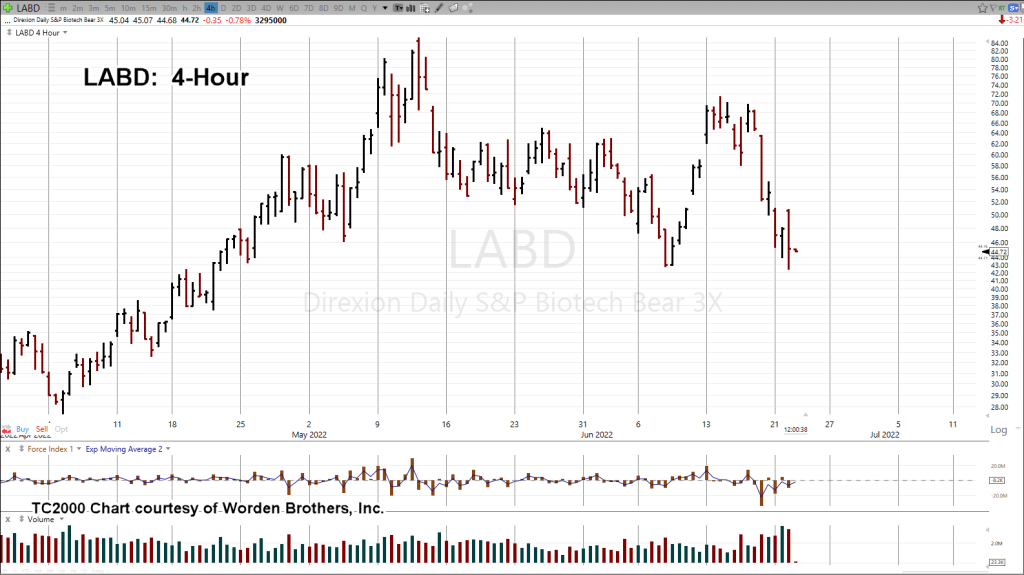
Since we’ve just past mid-session (12:37 p.m. EST), we’ll use the 4-Hour chart.
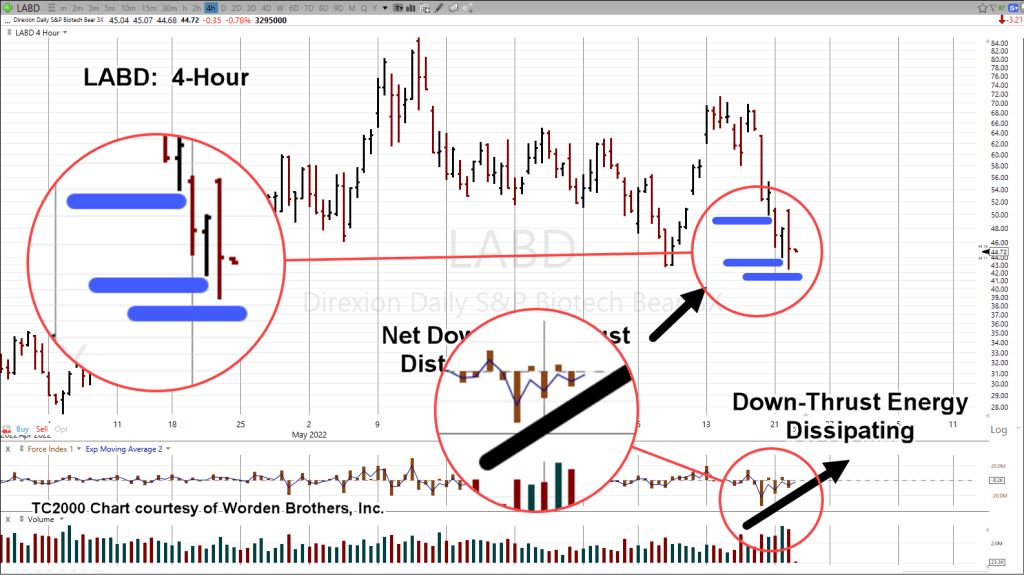
Biotech SPBIO, Leveraged Inverse LABD: 4-Hour
The unmarked chart above, looks like a mess.
Volatility everywhere in the past four sessions; including the Fed announcement on June 15th.
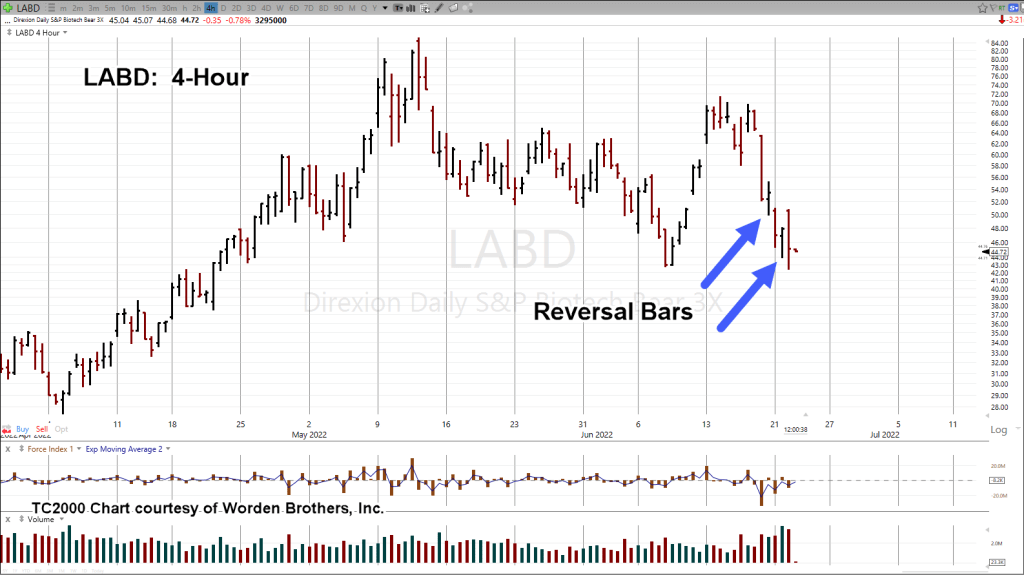
The marked-up chart below shows two distinct 4-Hour reversal bars.
Each of those bars were subsequently penetrated to the downside thus negating any entry signals.
However, it’s the next chart that draws from the secrets of Wyckoff analysis.
That is, “Shortening of the thrust”.
Discussed by David Weis in his training video, when thrusts become shorter, probabilities favor we’re nearing the end of the move.
As shown below, net downward thrusts on the chart have narrowed significantly.
Note that each downward thrust has successively less energy as shown on divergence of Force Index.
The next chart zooms-in.
Positioning
Based on the above, as much as price action gives the appearance of moving lower for LABD (higher for SPBIO), the energy to do so, appears to be spent.
Obviously, the accounts being managed have gone through a draw-down over the past trading sessions.
One account was stopped out @ 44.58 and then re-positioned at 44.01. The other account was allowed to draw down (not advice, not a recommendation).
The LABD-22-04, trade remains intact.
Summary
If the trend remains down for SPBIO, it’s highly unlikely the index will make new daily highs beyond this session.
If it does, then we can consider the trade set-up invalid.
A reasonable stop location at this point for inverse LABD, would be near or below the lows for the day (thus far), currently @ 42.37 (not advice, not a recommendation).
Note: Posts on this site are for education purposes only. They provide one firm’s insight on the markets. Not investment advice. See additional disclaimer here.
The S&P bottomed out at 666.67, on March 9th of 2009.
Putting it differently; that’s 3/9/09.
When that ’09, bottom is discussed in the financial press, they quickly round it up “667”; nothing to see here.
Market Reversal
The S&P needs to print a new daily low to make it official but our chief cook and bottle washer, biotech, looks like it’s not waiting around.
Pre-market action in (inverse) LABD is already at a new daily high, corresponding to a new daily SPBIO, low.
Once again, the short position was exited during the last session and then re-entered (discussed below) towards the end of the day (not advice, not a recommendation).
Trade LABD-22-03 is closed out; LABD-22-04, now open.
Biotech SPBIO Inverse Fund LABD
The chart shows pre-market action is at this juncture; Fifteen minutes before the open.
The hourly chart below has entry detail along with the current stop.
LABD Hourly
Positioning
With the market to open gap-higher (SPBIO, gap-lower), the first order of business is likely to be an attempt to close that gap.
If there’s going to be an attempt, look for it within the first 90-minutes of trade.
From my firm’s standpoint, the actions are obvious: We’ll be looking to increase the LABD-22-04, position and continue to have a tight stop (not advice, not a recommendation).
Summary
Anyone accessing this site for any length of time is most likely, fully awake.
Go ahead and look up “June 21st” on this calendar; it all makes sense.
If this reversal ‘sticks’ and is the pre-cursor to much lower levels, we know ‘the enemy’ has not changed.
Note: Posts on this site are for education purposes only. They provide one firm’s insight on the markets. Not investment advice. See additional disclaimer here.
Last Friday’s action was volatile with the op-ex short-covering apparently coming into play. Biotech was affected more than any other index.
If it really was short covering, then we already know what’s likely to happen next.
First, we’ll go over the charts and then build a case for the next probable direction.
The focus is on SPBIO, instead of IBB, as it’s the weakest of the two indices.
From a weekly standpoint, this is where SPBIO, left-off this past Friday.
Biotech SPBIO, Weekly Bar
Adding the mark-up to show we’re at support and resistance.
Getting closer in on that area.
We can see based on the price action itself, we’re at an important juncture.
Two years ago, in March of 2020, price action formed a support level.
Fast forward to now.
Price action bounced off that same level, attempted to move higher (for over three weeks), was rejected, moved lower, and last week, came back up for an underside test.
Most Probable Direction
If there was a short squeeze as a result of options expiration, fuel for that move is gone.
The options have expired.
in addition, that fuel was only able to get SPBIO, to the underside of resistance.
So, you can see where this is going.
Upside fuel is gone. SPBIO, is currently at underside resistance; most probable direction is down.
Measured Move
If the action from all-time highs during the week of February 12th, 2021, to the current support/resistance area is a trading range, then we may have a ‘Measured Move’ target as shown.
Under the current conditions, i.e., financial, societal, collapse along with the ‘elephant‘ going mainstream, a downside objective that’s an – 85.6%, decline from all-time highs, is entirely reasonable.
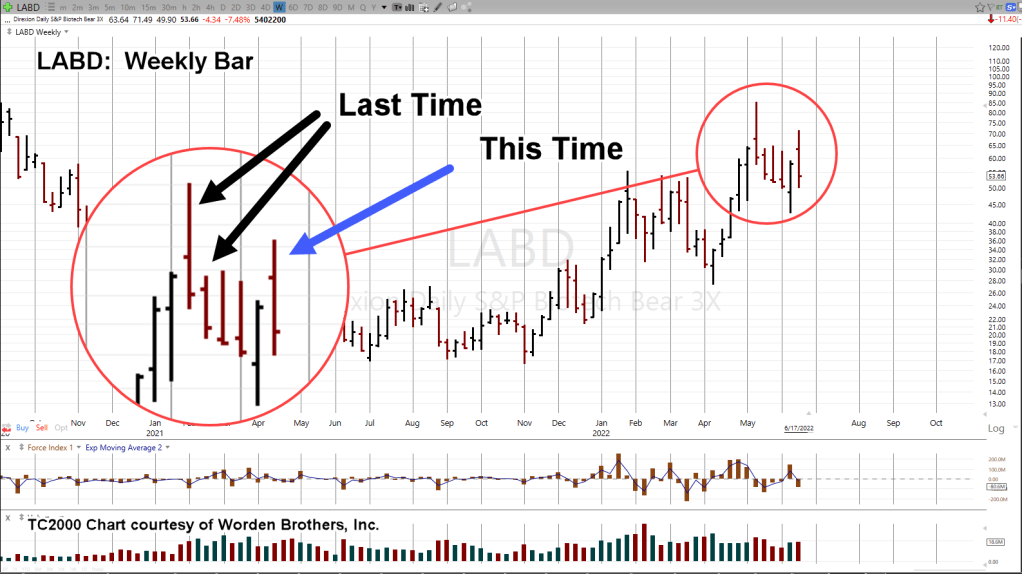
The 3X Inverse LABD, Weekly
The unmarked chart
First, the rule of alternation.
Last time is not this time.
Last time there was a reversal bar and the next week continued lower, then lower again and so on.
The rule of alternation says, whatever happened last time will not happen this time. Price action will (likely) have a different form.
Obviously, if the short squeeze referenced above is over and the trend remains down, one could expect LABD, price action to be higher at the next session (SPBIO, lower).
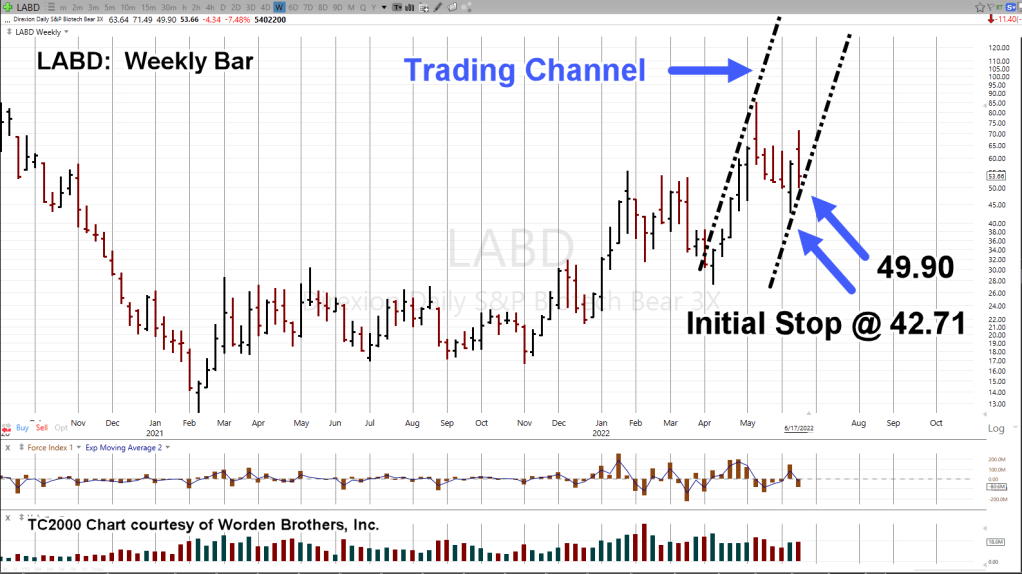
Positioning
The weekly chart shows progression and location of the stop orders on LABD-22-03 (not advice, not a recommendation).
The initial stop has been moved up to last week’s low.
There may be a trading channel as well.
Potential exit target(s) if not stopped out, would be contact points at the upper channel line.
Summary
If the position is stopped out at the next session, we’ll re-evaluate.
If not, and SPBIO, continues to move lower (LABD, higher), we’ll be looking for additional confirmation of the right-side trend line and the next likely area to move the stop.
Note: Posts on this site are for education purposes only. They provide one firm’s insight on the markets. Not investment advice. See additional disclaimer here.