Note: Posts on this site are for education purposes only. They provide one firm’s insight on the markets. Not investment advice. See additional disclaimer here.
Note: Posts on this site are for education purposes only. They provide one firm’s insight on the markets. Not investment advice. See additional disclaimer here.
For what seems the longest time, a recurring focus of this site has been the biotech sector.
Specifically, the IBB (ETF) and SPBIO (Index).
There’s good reason for that. In this update, we’ll go deeper into the downside opportunity.
Biotech Reversal:
SPBIO, topped out on February 9th this year. The IBB (ETF) topped one day later.
Both went on to form a Quarterly reversal bar; indicating a long term change in character.
Of the two, SPBIO has showed more weakness having posted monthly lower lows for three successive months.
That relative weakness over the IBB index, has resulted in focusing on the inverse of SPBIO; specifically the 3X inverse, LABD.
Working with leveraged inverse funds is only profitable on a short-term basis or when the underlying index is in a persistent down-trend.
Otherwise, typical market chop results in value erosion of the inverse fund (not advice, not a recommendation).
For the reasons discussed in the last section below (Nuremburg 2.0), we’re anticipating the index to have a sustained and persistent drop to much lower levels.
Downside Projections:
Going way back to Reminiscences of a Stock Operator and the Wyckoff Stock Market Institute training materials, both in their own way indicated a speculative position was only entered if there was sufficient potential.
Livermore’s 10-points or more and Wyckoff’s cause and effect
In Wyckoff’s case, the ’cause’ was price action congestion built up in the P&F chart.
The ‘effect’ was the resulting move.
Which brings us to now:
Many times on this site, we’ve said biotech has built up congestion in a way, when it reverses and begins its decline, price action itself will create lower targets.
We’ll present two charts showing how that’s happening.
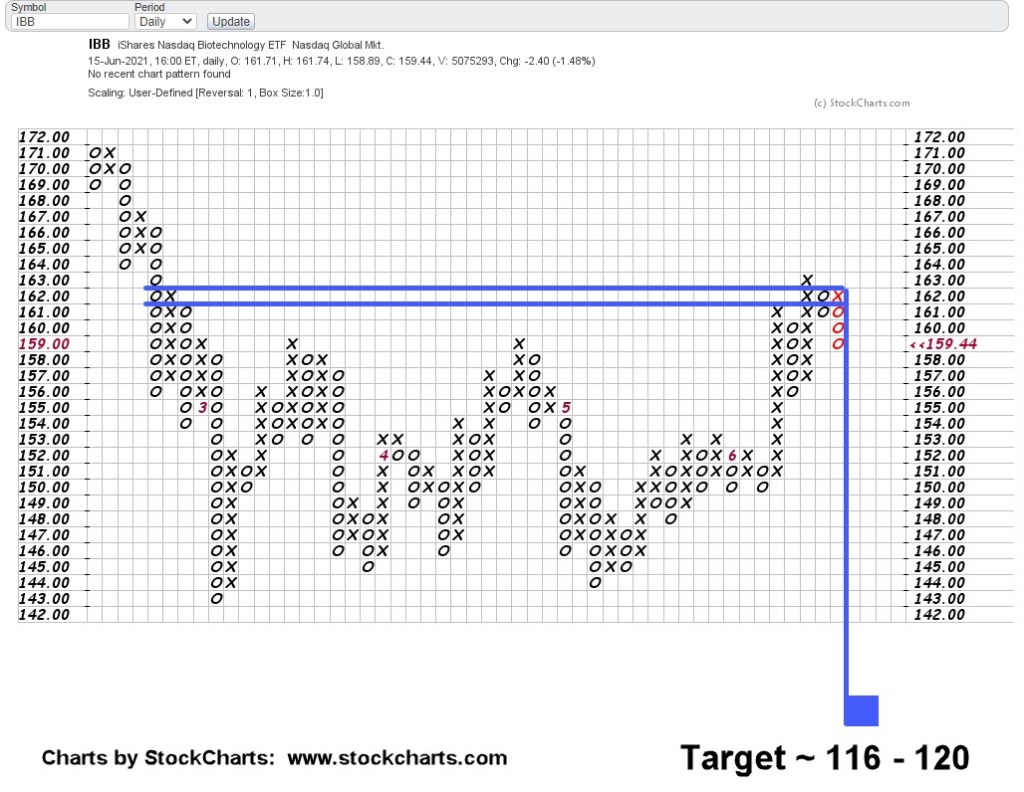
The first P&F chart in this update and provided below, has a projected downside target for IBB around, 116 – 120 area:
Note, the downside is not to scale as the real location is far below the noted area.
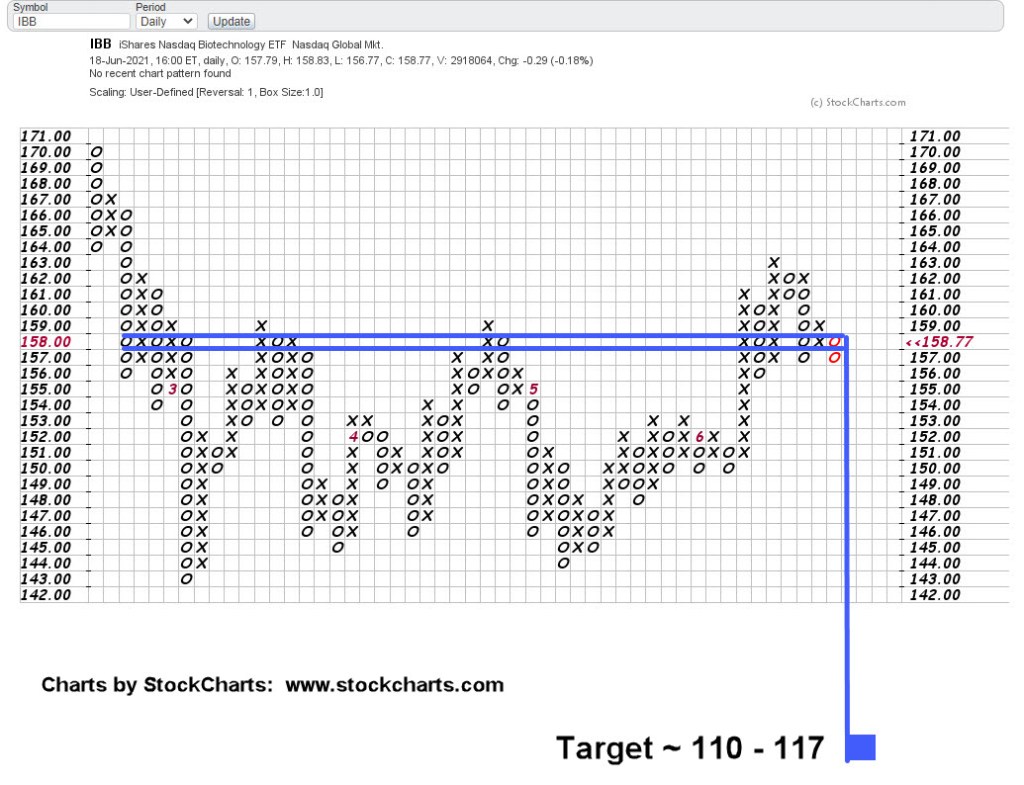
Biotech IBB, then went on to post lower action. That in turn has resulted in an updated downside target:
Once again, the downside is not to scale.
It’s apparent, as IBB heads lower, it successively builds lower targets and it’s only (potentially) just getting started.
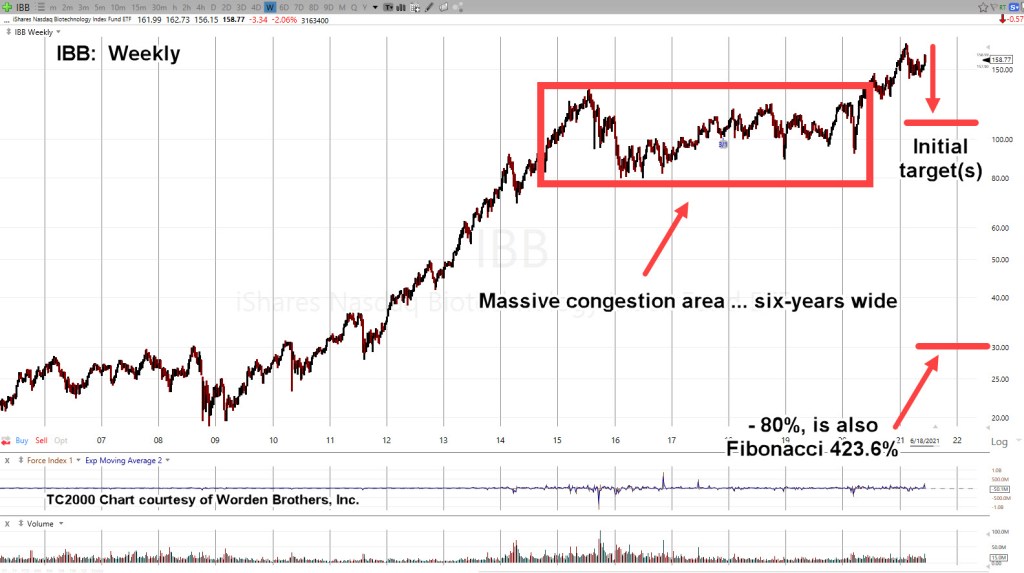
The weekly chart of IBB below, spells it out:
If and when IBB price action gets to the initial targets, it enters a congestion area that will (by that time) be over seven years wide.
If the trend is still down, that congestion in turn would target even lower levels.
The “-80%” interestingly enough, comes from a quote by Steven Van Metre at this link.
That 80% drop also corresponds to a downside Fibonacci (not shown) projection of 423.6%, on the above chart.
Nuremberg 2.0
This phrase has become so ubiquitous you can do a search for it.
So far, not a single mainstream financial site or YouTuber (still on that platform) has mentioned this fact in their analysis.
The speck injections are mass genocide and intended as such.
Two recent events resulting from injections are here and here.
If all of a sudden, injected pilots can’t fly (the first link), how are goods going to be transported?
Not generally known to the public, commercial air-transport is also used to haul freight (while carrying passengers).
Exactly how all of this (world crime) will break is unknown.
If and when it does, the result in the biotech sector as well as equities in general, could be successive air-pockets all the way down.
Note: Posts on this site are for education purposes only. They provide one firm’s insight on the markets. Not investment advice. See additional disclaimer here.
In fact on June 9th, the day the above ‘penetration’ report was posted, gold (GLD) had already reached its peak and was in a reversal.
Five days later (before the major down-move), this report was published on gold.
Therefore, at this juncture, we’re still inversely correlated.
So, what does that mean?
The updates on the dollar have proposed, since the bullish divergence (now turned rally) is on a longer, weekly time frame, the ensuing move could have the potential to carry the index UUP, to the top of the trading range shown here.
Then, what happens to gold?
If the negative correlation remains intact, gold gets whacked.
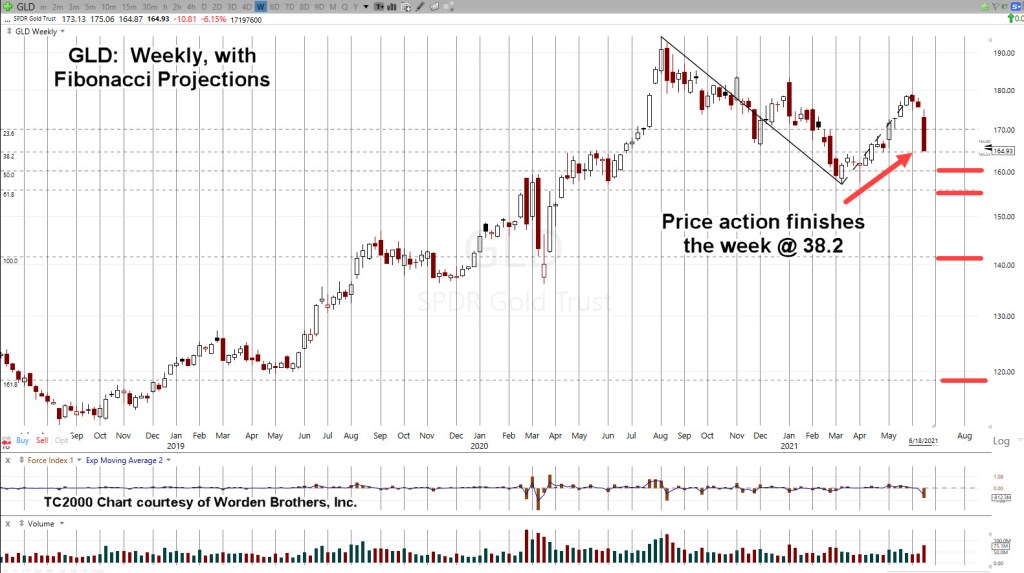
The weekly chart of GLD (above) has the index closing right at the Fibonacci 38.2%, projected level.
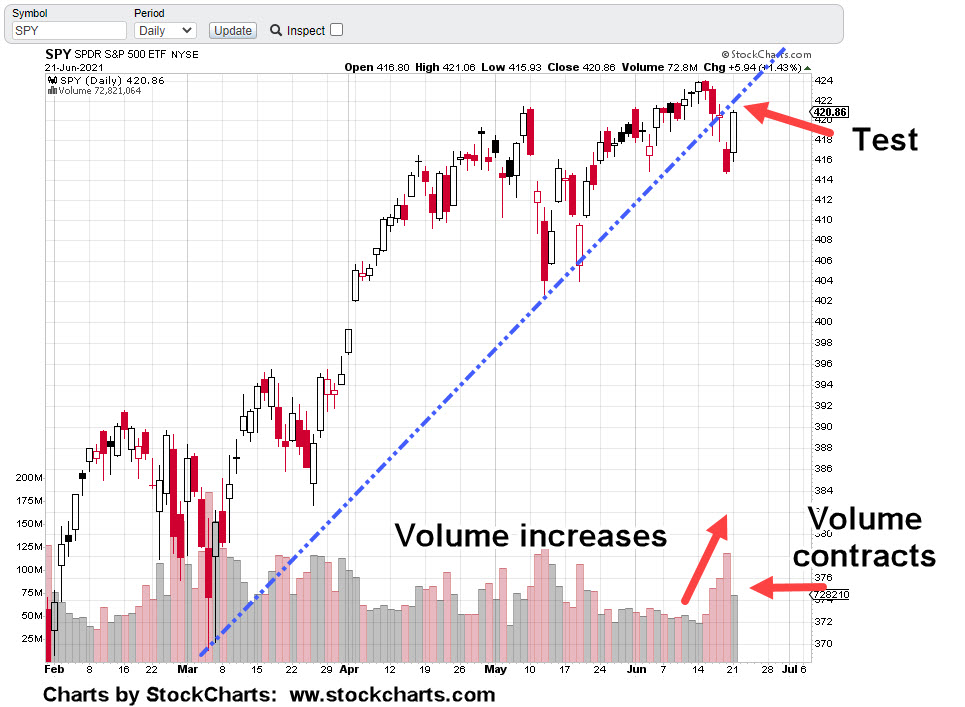
Wide bars tend to get tested. There could be some kind of rally in the coming week but it’s not required.
The Fibonacci projections highlighted as the orange bars, go all the way down to 161.8%. That’s equivalent to GLD at ~ 118.65, or the futures market somewhere around $1,300 – $1,350.
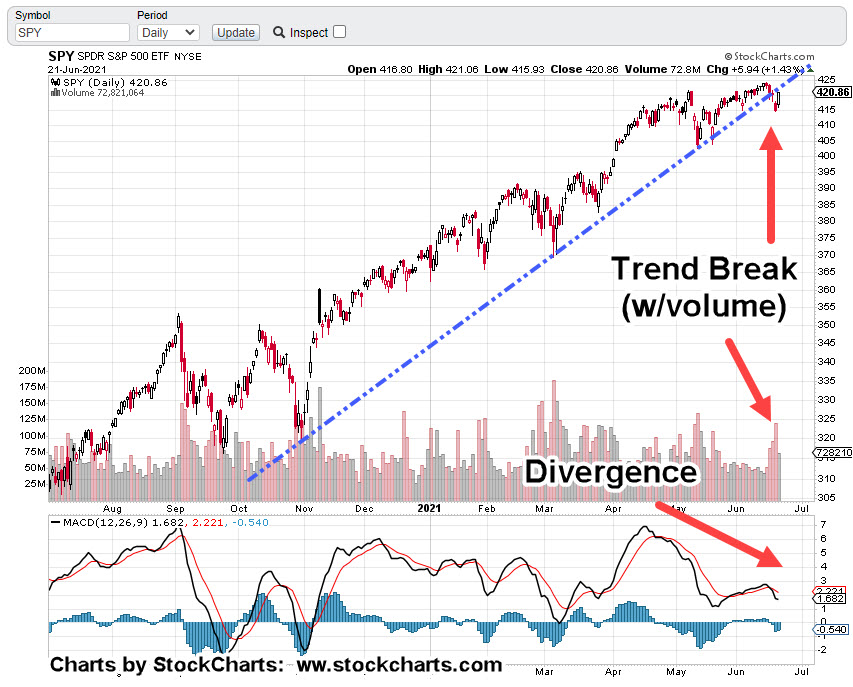
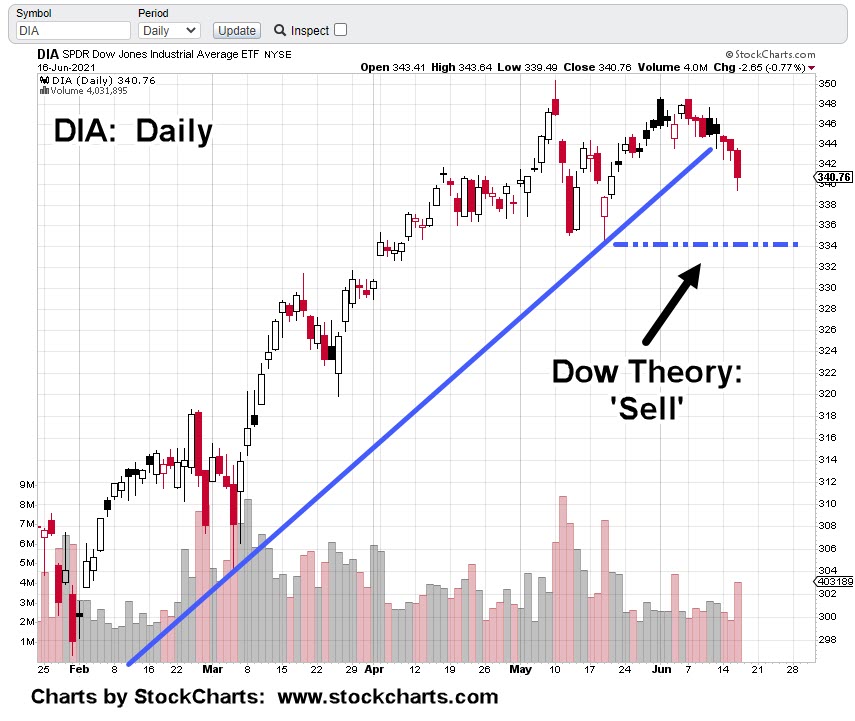
With the Dow 30, (DIA) penetrating and closing below the 336, support levels on Friday, we have a Dow Theory Sell Signal (not advice, not a recommendation).
The markets appear to be rolling over.
The last market reversal in February – March, of last year, had GLD dropping over – 14.5%, in two weeks.
Fast forward to now; GLD, is already down over – 15.2%, from its August 2020, highs.
Stay Tuned.
Note: Posts on this site are for education purposes only. They provide one firm’s insight on the markets. Not investment advice. See additional disclaimer here.
Several times in these updates the word ‘collapse’ has been used to describe the potential for biotech.
The monthly chart below shows a Fibonacci projection based off current price action.
Note how projected levels match up with support and resistance areas:
Obvioulsy, this is a long term projection.
It may work out the short position in biotech via LABD, (not advice not a recommendation) will have to be exited and re-entered several or many times if/when the sector heads for the bottom.
Stay Tuned
Bonus:
The hourly chart of IBB below, shows Wednesday’s price action touching, then bouncing off the first Fibonacci projection.
Note: Posts on this site are for education purposes only. They provide one firm’s insight on the markets. Not investment advice. See additional disclaimer here.
Note: Posts on this site are for education purposes only. They provide one firm’s insight on the markets. Not investment advice. See additional disclaimer here.
LABD inverse fund (3X inverse SPBIO), marked with time pivots and potential channel.
The plus or minus one-day on the Fibonacci counts, is well within acceptable limits.
There’s been so much focus on biotech because of the opportunity.
Trading congestion equals directional potential.
A good way to show that (downside) potential, is with the P&F chart of biotech IBB, below:
The initial projection targets the 120-area which is below the support levels at, 143 – 145. If penetrated, those support levels would likely become resistance to any upward retrace.
We’re about an hour to go before the regular open. LABD is trading flat to slightly higher.
Note: Posts on this site are for education purposes only. They provide one firm’s insight on the markets. Not investment advice. See additional disclaimer here.
The two hits on the right side channel line provide confirmation of the trend.
An expanded version of the daily is below:
So far, we’ve had the blockage of the Suez Canal. Auto parts being sent to the bottom of the ocean off Japan. ‘Mysterious’ grain silo fires destroying harvested crops.
If transportation is shut down as a result of cyber attack, fuel pipelines off-line, no grease to lubricate the wheels or any number of other (planned … and don’t think there’re not) events, the last thing that’s going to help get anyone through, is a ‘stack’ of inedible metal.
It’s no secret this site’s been using the Biblical precedent of Genesis 41.
That is: Grain and Corn come first … then gold and silver.
The ‘stacking’ public has got this message reversed. Of course, this is not advice or a recommendation.
However, for those that can see, it’s so obvious the goal is ‘controlled demolition’ of the supply chain. All of it.
We’ll put everything back to ‘normal’ if you just get injected.
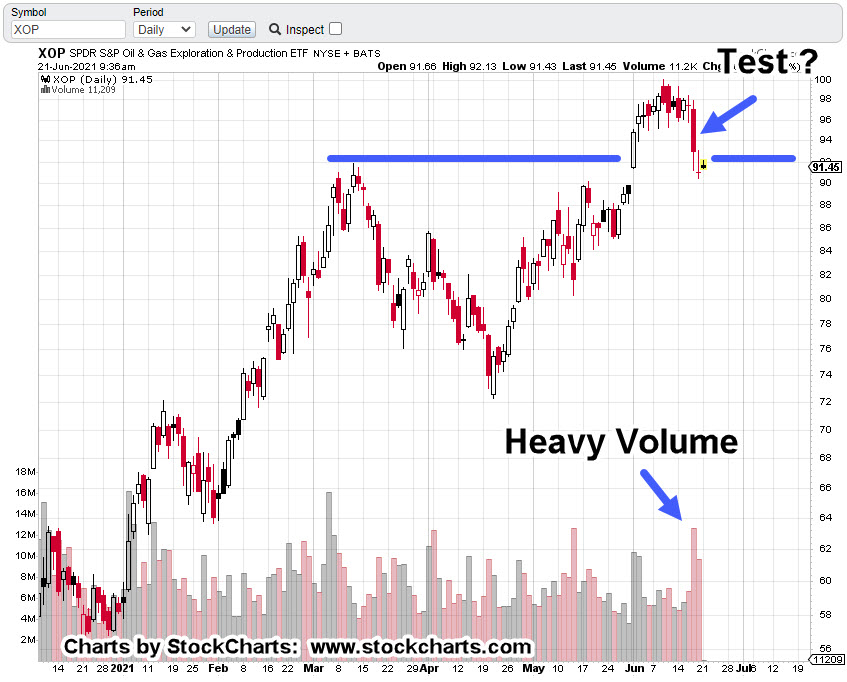
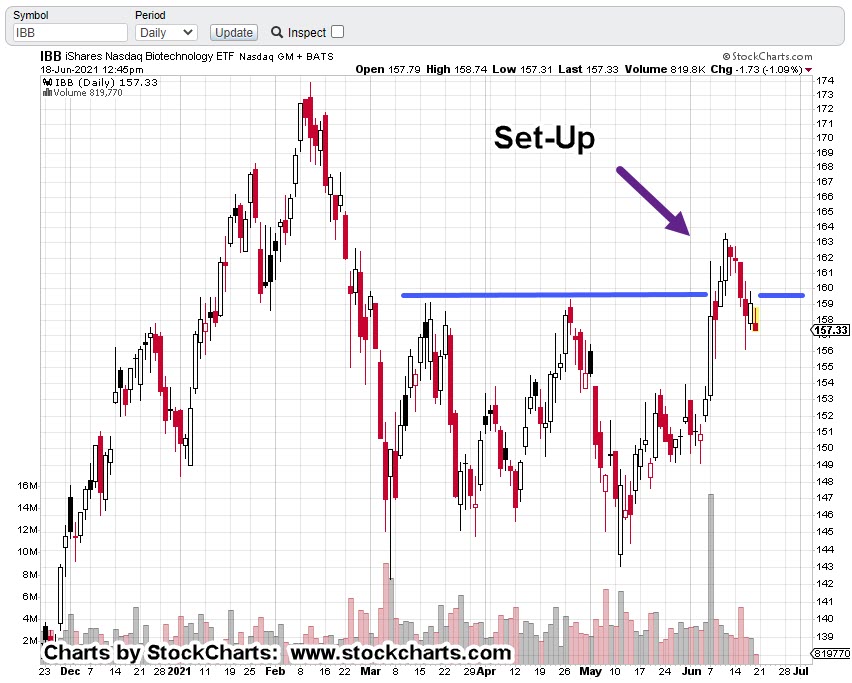
Meanwhile, biotech IBB, and SPBIO, have both posted a new daily low.
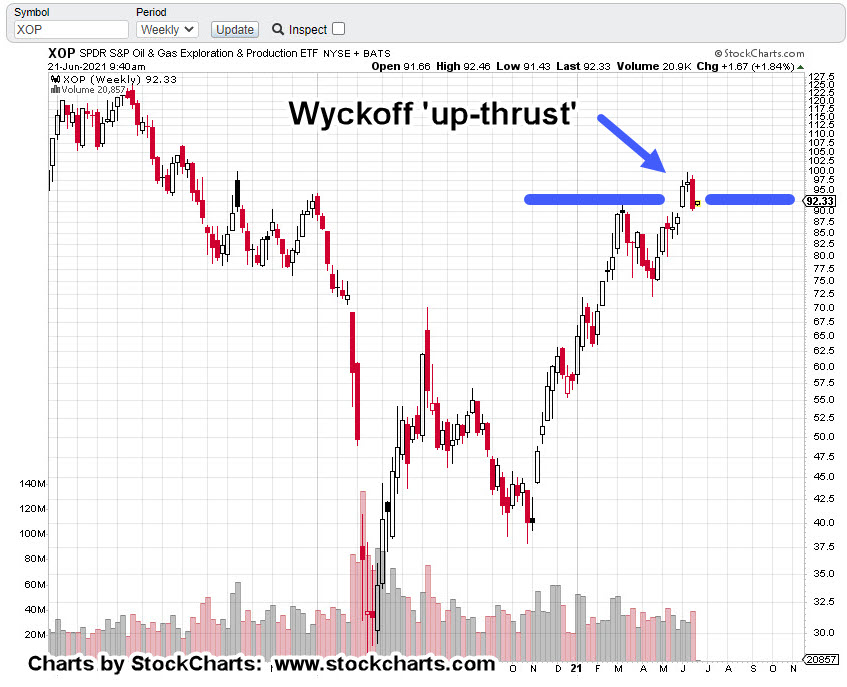
IBB is poised to penetrate the resistance area identified in this update, and come back to test the wide bar.
If that happens, we have a Wyckoff up-thrust in play. More analysis of biotech to follow.
Note: Posts on this site are for education purposes only. They provide one firm’s insight on the markets. Not investment advice. See additional disclaimer here.
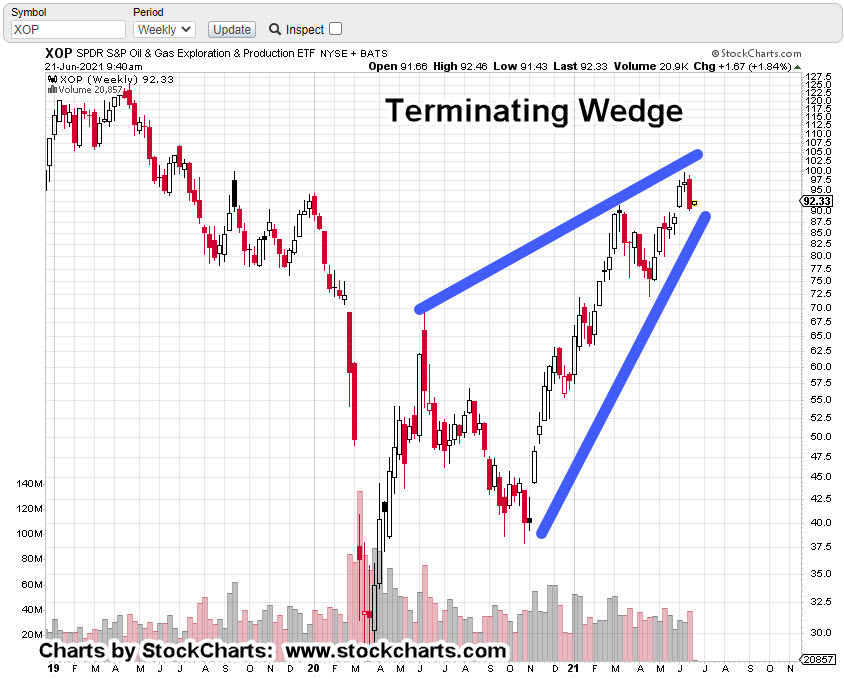
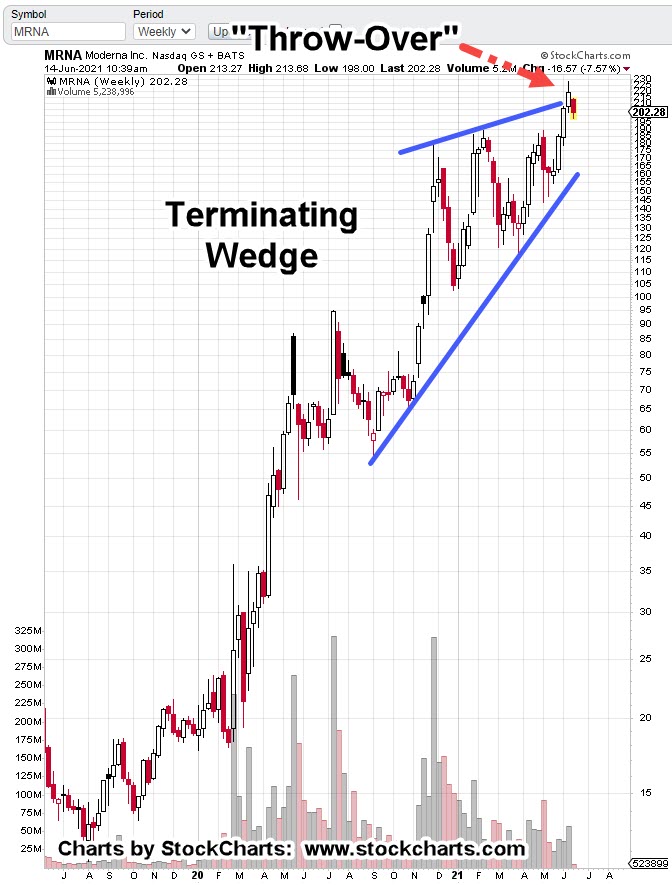
In a situation that’s straight out of any typical trading text: ‘When a market goes into a throw-over and then enters back into the range, it’s a classical analysis sell signal’ (not advice, not a recommendation).
That’s where Moderna (MRNA) is now.
Moderna’s the ‘chief cook and bottle washer‘ for the world-wide kabuki theater. So, we’re using it as a proxy for the biotech sector as a whole.
Separately, biotech index IBB, is retracing but has not posted a new daily low.
Inverse SPBIO fund LABD, has formed an hourly reversal bar and looks to be forming a daily reversal bar. As of this update, it has yet to post a new daily high.
Note: Posts on this site are for education purposes only. They provide one firm’s insight on the markets. Not investment advice. See additional disclaimer here.
Note: Posts on this site are for education purposes only. They provide one firm’s insight on the markets. Not investment advice. See additional disclaimer here.