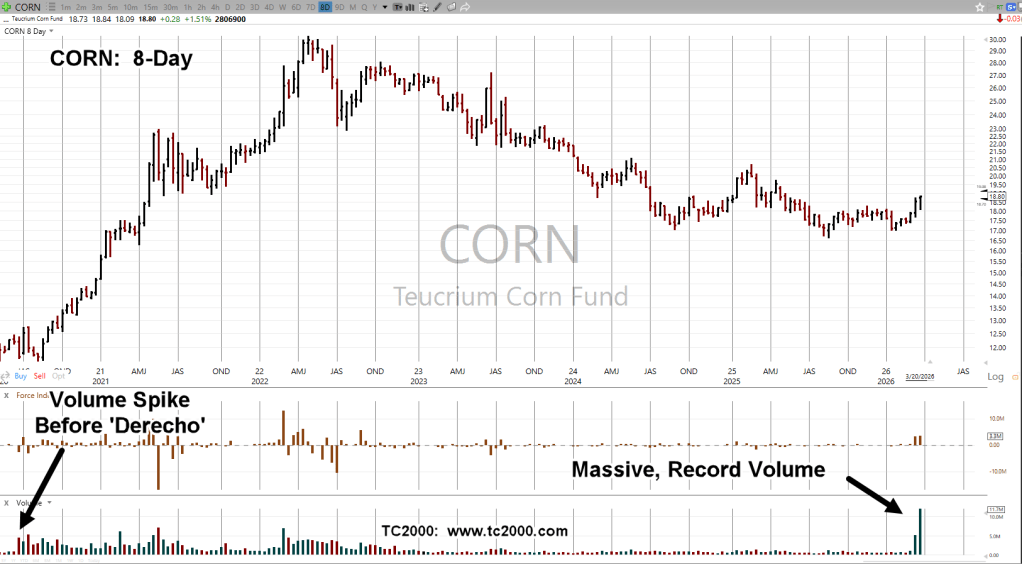
There’s massive volume in the Teucrium CORN, tracking fund.
The chart at left, is a Fibonacci 8-Day, with four more days to go before the current bar is complete.
The last time there was volume anywhere close to this, was back in June of 2020, several weeks before 10% of the U.S. corn crop was wiped out by an inland ‘hurricane’.
That incident launched a rally in CORN, lasting into the early part of 2022, gaining over 160% (not advice, not a recommendation).
Note: Posts on this site are for education purposes only. They provide one firm’s insight on the markets. Not investment advice. See additional disclaimer here.
Note: Posts on this site are for education purposes only. They provide one firm’s insight on the markets. Not investment advice. See additional disclaimer here.
Note: Posts on this site are for education purposes only. They provide one firm’s insight on the markets. Not investment advice. See additional disclaimer here.
Note: Posts on this site are for education purposes only. They provide one firm’s insight on the markets. Not investment advice. See additional disclaimer here.
CORN had been moving steadily higher for nearly two years.
Using Wyckoff and Fibonacci, the (potential) top and retrace was identified one week before it actually happened.
The last update on CORN, with chart analysis was here.
Fast forward to this post; commodities pivoted, and appear to be moving higher in relative unison.
So, what happens now?
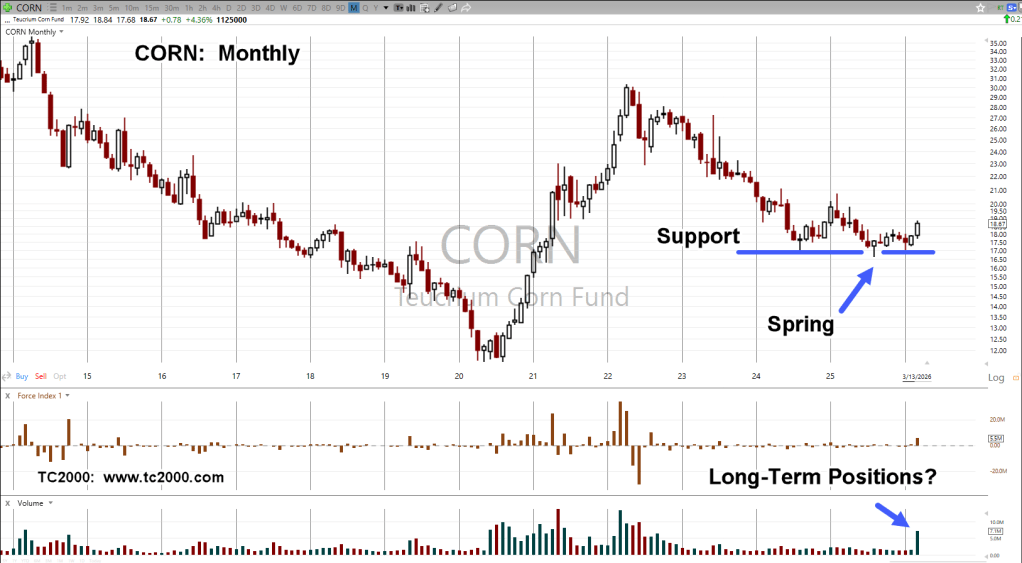
Teucrim Fund, CORN, Monthly
The ‘magenta’ arrow shows the location of the April post.
Moving on to the right-side, CORN held below support for seven months before pivoting higher.
If the labeling is correct, we have what looks to be a Wyckoff ‘spring’ set-up (not advice, not a recommendation).
That amount of time below support seems a bit of a stretch for labeling it as a ‘spring’.
Has that ever happened before?
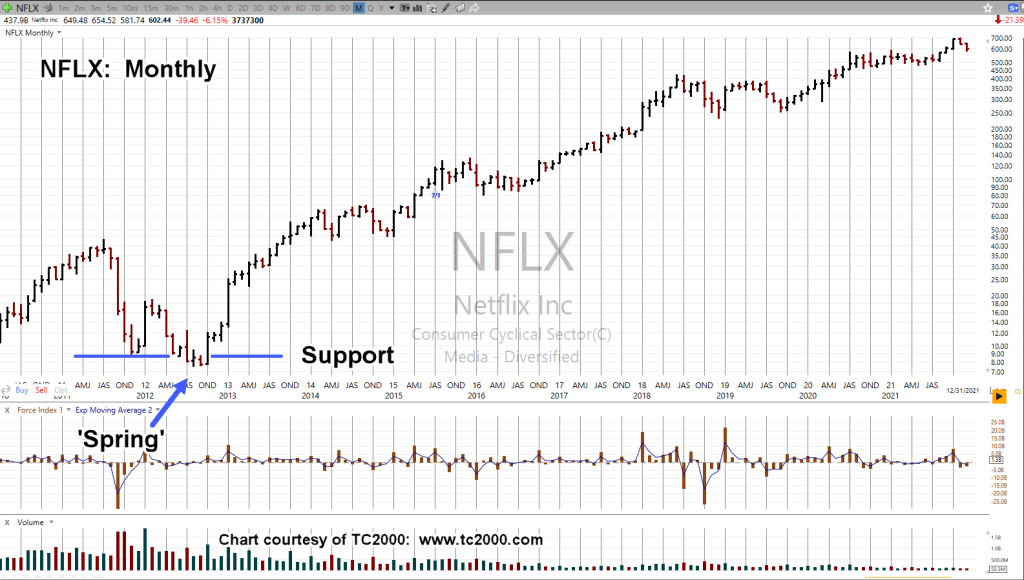
Case in point, Netflix
Netflix NFLX, Monthly
Depending on how it’s measured, back in 2012, NFLX, printed below support three-to-five months, before moving higher … in a big way.
With the chart of CORN, it’s unknown if we’ll get a ‘test’ of the breakout (purple oval).
At this point, there’s so much uncertainty in the financial markets as well as commodities, one needs to at least consider the possibility of a ‘test’.
Note: Posts on this site are for education purposes only. They provide one firm’s insight on the markets. Not investment advice. See additional disclaimer here.
Note: Posts on this site are for education purposes only. They provide one firm’s insight on the markets. Not investment advice. See additional disclaimer here.
Insane, delusional valuations, high interest rates, no rate cut.
What could go wrong?
Visitors to this site already knew that ‘something’s up’.
Fully documented well in advance of today, was the A.I. bubble reversal, silver reversal, biotech reversal, and commodities like corn and Nat-Gas continuing their sustained decline.
Now the market hysteria is resulting in the typical knee-jerk, ‘flight to safety’ to the bond market (not advice, not a recommendation).
Surely, with all of that, the Fed will cut rates, right?
For the (potential) answer to that question, let’s look at the bond market.
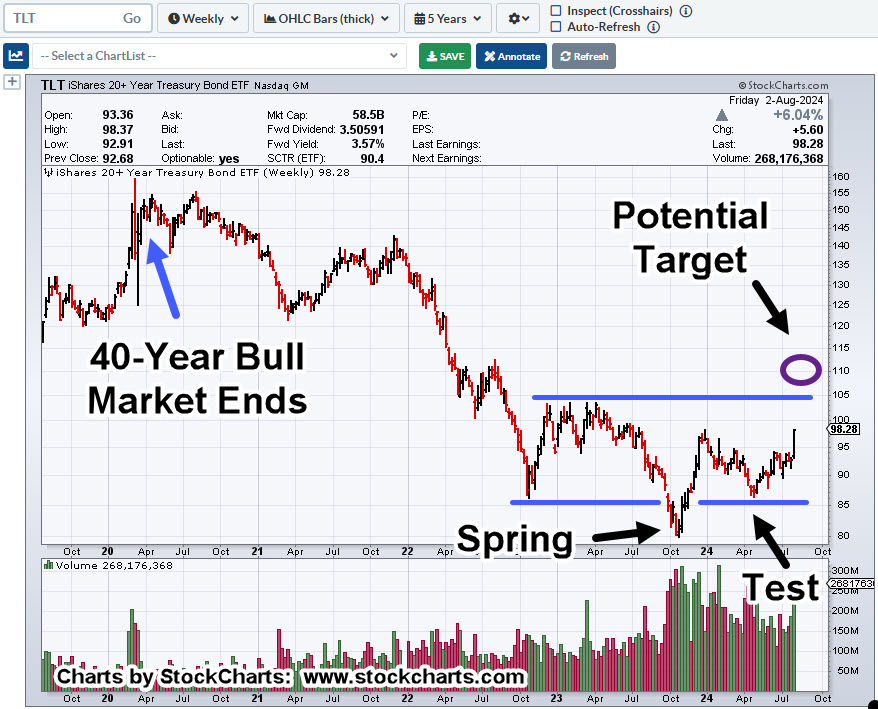
Long Bonds, TLT, Weekly
Already proposed on this site, the Fed does not lead the bond market and interest rates, it follows it (not advice, not a recommendation).
So, what’s this chart telling us?
If the market continues its decline in the coming weeks, TLT price action itself shows a potential for higher bond prices (lower yields).
We’re just over six-weeks away from the next Fed meeting.
Fed Follower?
If the Fed is still a follower, not a leader and if bond (TLT) prices reach the target just as the September meeting is held, then, one would expect a rate cut (not advice, not a recommendation).
Important to note, if TLT gets to the target area, it’s in Wyckoff Up-Thrust (potential reversal) position.
Economic Air-Pocket
If there is a rate cut as a result of the leading action of the bond market and then it reverses to the downside (rates higher), that’s when it would get real interesting.
Correction or crash; we may have to wait until September to find out (not advice, not a recommendation).
Note: Posts on this site are for education purposes only. They provide one firm’s insight on the markets. Not investment advice. See additional disclaimer here.
Penetrating and holding just below support, we know what that means.
CORN is at The Danger Point®, in spring position (not advice, not a recommendation).
The chart below covers over four-years of price action; within that, we have at least three technical items to cover.
Somebody Always ‘Knows’
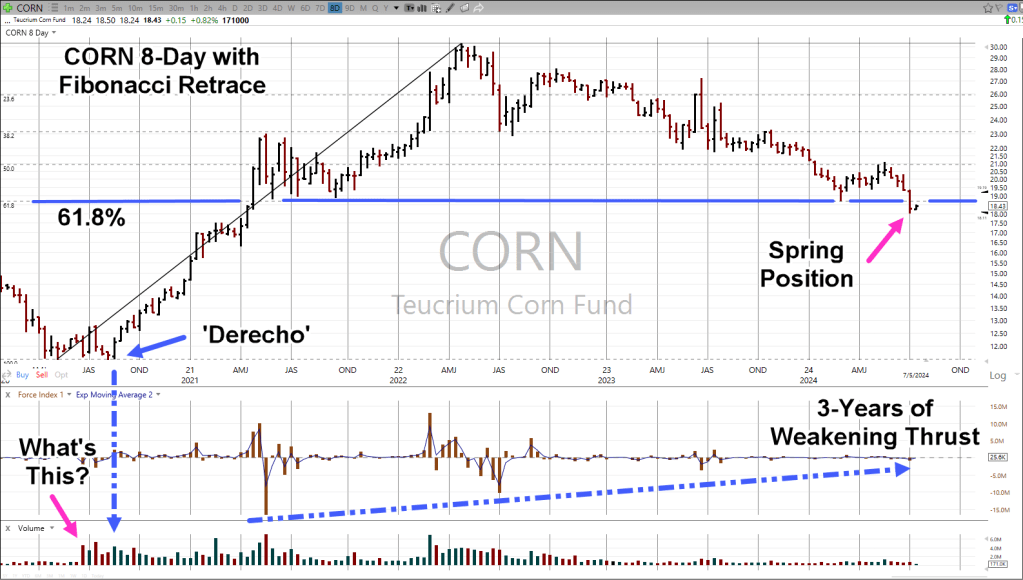
First, how does volume in CORN, go from basically nothing, to increasing over 400%, six weeks before, the perfectly timed and positioned (in the corn belt), ‘Derecho‘.
That location is identified as ‘What’s This?’
As Wyckoff said a century ago: ‘Somebody always knows something and that ‘something’ shows up on the tape’.
CORN Fibonacci, 8-Day
Second, is the successive decrease in downward thrust over the past three-years; at this point, nobody’s watching.
All of that brings us to the third technical point.
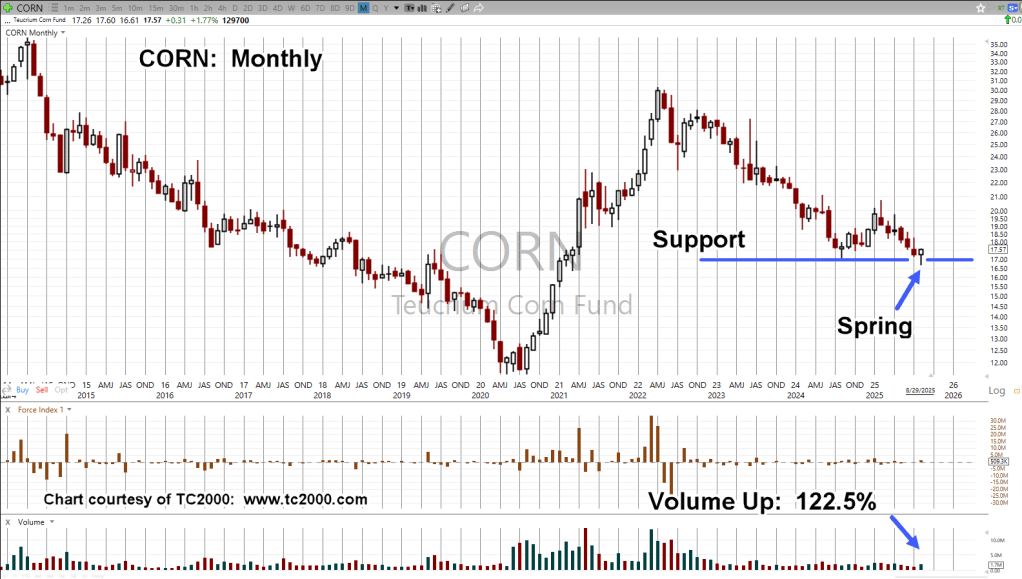
CORN has retraced to support (blue line) which just happens to be a Fibonacci 61.8%, level; penetrates that support and so far, has stopped dead.
Note: Posts on this site are for education purposes only. They provide one firm’s insight on the markets. Not investment advice. See additional disclaimer here.
Since Wyckoff analysis doesn’t care about the press, we’ll use it to discern the (potential) truth.
Let’s see how it did in the recent past. The Nat-Gas (UNG) low, was identified to-the-day,link here.
From that post, was this:
“Downward thrust in Nat-Gas UNG, appears to be exhausting itself after a 20-month, bear market.Risk is never zero, but currently appears to be at a low … “
So, it was. Afterwards, UNG bounced near, but never touched that low.
Twelve trading days later (Fibonacci 13 days, from low), it reversed decisively to the upside.
The Same, But Not
On the medium, to long-term, CORN action is the same as biotech (XBI), but opposite.
Instead of an up-thrust two-years in the making, we may have a spring set-up, taking just as long if not longer.
Note: Posts on this site are for education purposes only. They provide one firm’s insight on the markets. Not investment advice. See additional disclaimer here.
“What we’re looking for here, is some kind of Jimmy Carter type stunt where corn exports are halted in the name of ‘national security’ or some such thing.”
Corn Tracking Fund CORN, Weekly
Two Fibonacci projections are overlaid on the chart.
First, a simple retrace starting near ‘Derecho’ lows, to highs set during the week of April 29th, 2022.
Second, a counter-trend projection from those highs to the intermediate lows set during week of May 19th, 2023 and highs of June 23rd, week, the same year.
CORN has retraced 61.8%, which is also the 1:1 counter-trend projection. In addition, it’s the measured move from the wedge break.
The market has effectively confirmed the support area.
Oil Goes Negative … And Corn?
Remember that ‘anything can happen’. Oil futures made history by going negative.
We’re in a new construct, a new paradigm, our strategy should match accordingly.
Everyone has their own perspective and plan for the markets; fair enough.
From here, CORN could continue to new, all-time highs.
However, for my accounts, I’ll wait until such time it appears the downside risk is removed as much as possible.
One potential area for that ‘removal’ is the 76.4%, retrace in the vicinity of CORN @ 16 (not advice, not a recommendation).
Note: Posts on this site are for education purposes only. They provide one firm’s insight on the markets. Not investment advice. See additional disclaimer here.