There are sure to be plenty of post-mortems over the weekend; usual suspects giving us their assessment on what’s already happened. 🙂
Sometimes the question, is not ‘what’s happened’, but ‘what has not happened’.
That’s where the opportunity may lie.
Market Implosion
Over the past week, there were wide price bars, with action unstable in all major indices (ETFs): DIA, IBB, IWM, IYM, IYR, QQQ, SOXX, SPBIO, SPY, XLF, and XOP.
However, what did not implode (completely), are the car dealerships; specifically, CarMax and Carvana.
For this update, we’ll look at CarMax.
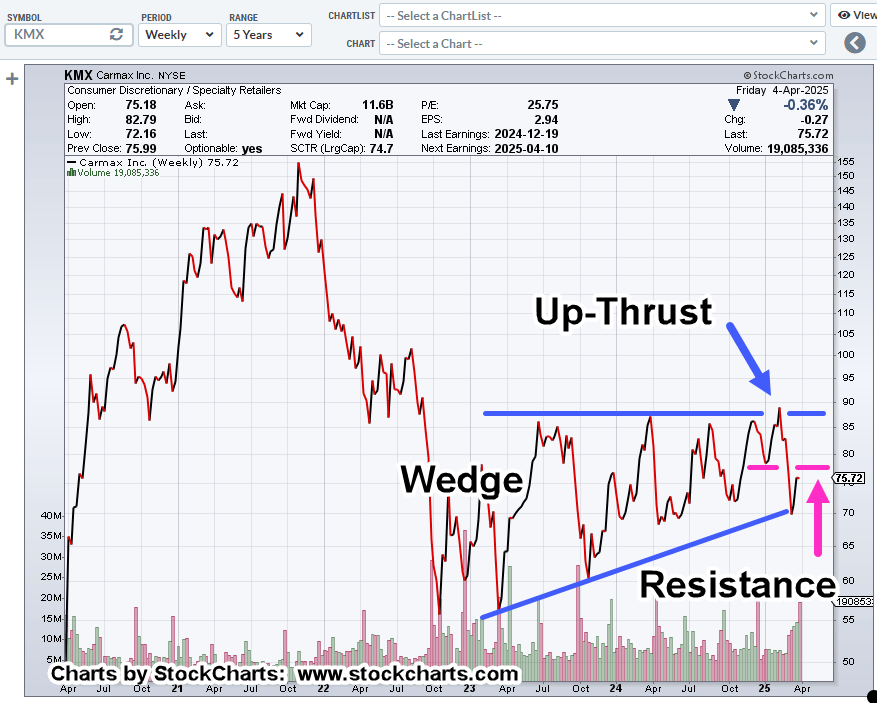
CarMax, KMX, Weekly Close
On a close basis, KMX, has bounced off the lower wedge boundary and is near the resistance area (magenta line).
Price action could be positively biased in the coming week as a result of ‘tax refund’ car buying (not advice, not a recommendation)
Note: Posts on this site are for education purposes only. They provide one firm’s insight on the markets. Not investment advice. See additional disclaimer here.
The Good: Only the Senior Miners, GDX, have managed to claw their way past the highs set nearly five years ago in August of 2020.
The Bad: Junior Miners GDXJ, remain below that August ’20, level.
The Ugly: Silver Miners SILJ, are the worst, having their peak a bit later in February of 2021; they remain over -35%, below their highs.
The Market Rolls Over
Yesterday, Friday, was a down day for the Dow, S&P, The Qs, Transports, Airlines, Semis, nearly everyone.
For some of these indices, their all-time highs were posted months, if not years ago.
There may be some (bidding) ‘defensive’ action with gold (GLD) continuing higher; as said in earlier posts, the rest of the monetary metals are far below their highs.
Let’s look at the weakest; the silver miners, as they are likely going to be the ones most affected by an economic decline (not advice, not a recommendation).
Silver Miners, SILJ, Daily
We’re at an interesting spot.
Friday was a down day that pushed below existing support, shown in zoom area.
We have simultaneous action.
Once resistance was penetrated on March 18th, it could not hold. After eight trading days, on Friday, it posted lower on heavy volume.
However, we can see that SILJ, is now in (a minor) Wyckoff ‘spring’ position. So, the question is, what happens next?
Note: Posts on this site are for education purposes only. They provide one firm’s insight on the markets. Not investment advice. See additional disclaimer here.
Note: Posts on this site are for education purposes only. They provide one firm’s insight on the markets. Not investment advice. See additional disclaimer here.
Note: Posts on this site are for education purposes only. They provide one firm’s insight on the markets. Not investment advice. See additional disclaimer here.
Note: Posts on this site are for education purposes only. They provide one firm’s insight on the markets. Not investment advice. See additional disclaimer here.
Well, another financial media lie has come and gone.
As Jerrimiah Babe says, time stamp 6:05, at this link:
“The good times are over.”
The Dow Jones was down over 1,000 points on the day and finished (along with the S&P, NASDAQ) right at the session lows.
Typical action for the markets under such conditions, is a follow-through at the next trading session, Monday.
Recall, it’s been presented many times on this site (Holiday Turns), major reversals tend to occur just before, during, or just after, a holiday week.
The 2008, countertrend reversal took place on the Monday (5/19/08), leading into Memorial Day Weekend. The big one in 1929, was the Tuesday (9/3/29) following the Labor Day Weekend.
The current reversal (discussed below), if it holds, has come a couple weeks early in the ‘holiday’ window.
It’s possible because of the massive size of this monster, that a week or two does not make a difference.
Let’s look at the Dow 30 and its perfect Wyckoff Up-Thrust, Reversal, and Test.
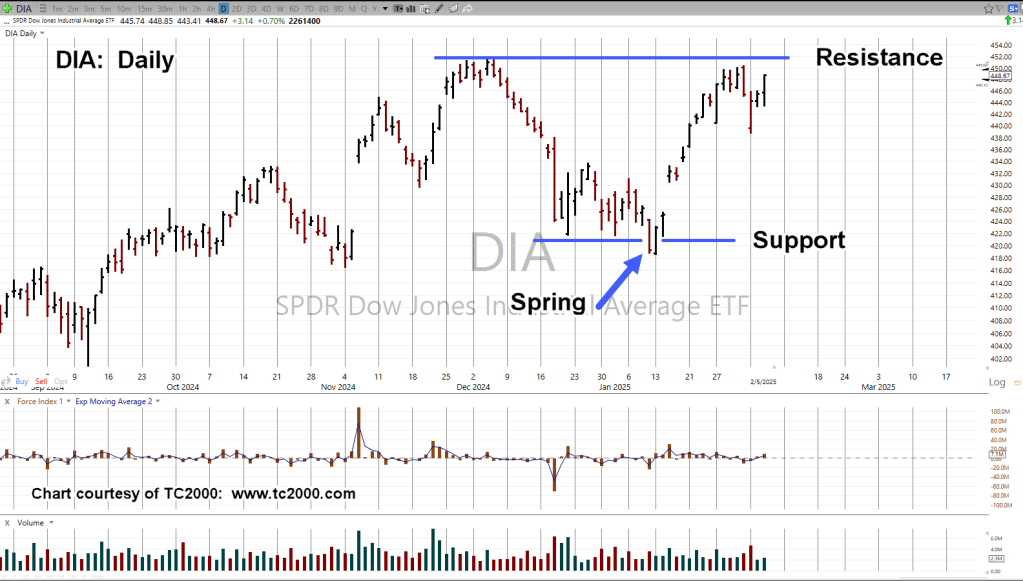
Dow 30, DIA Daily Close
Daily Close with Fibonacci retrace levels identified.
A close-in look on the reversal area.
Looking at the zoom-chart above, we had a Wyckoff Up-Thrust that touched 61.8%, then declined sharply before coming back to test at 50%.
After the test was another sharp decline. One can make the case, the up-thrust has been tested.
Continued (overall) downside is the higher probability with a ‘no Fed pivot’ providing the tailwind.
Note: Posts on this site are for education purposes only. They provide one firm’s insight on the markets. Not investment advice. See additional disclaimer here.
This just out from Activist Post, shows we’re in yet another ‘never before seen’ event.
One of the references in the article can be found at this link.
Many times on this site, the ‘reduction in size’ has been discussed.
Now, the official numbers are starting to show-up. The bottom line? Retail demand is going to evaporate.
As a side note, it’s interesting that YouTube now has videos on how to spot Myocarditis …. something we’ve (in the serfdom) have never heard of … until now.
While everyone seems to be focused on the overall markets, S&P, Dow, and QQQ, underneath the radar, gold and the miners continue to rachet themselves lower.
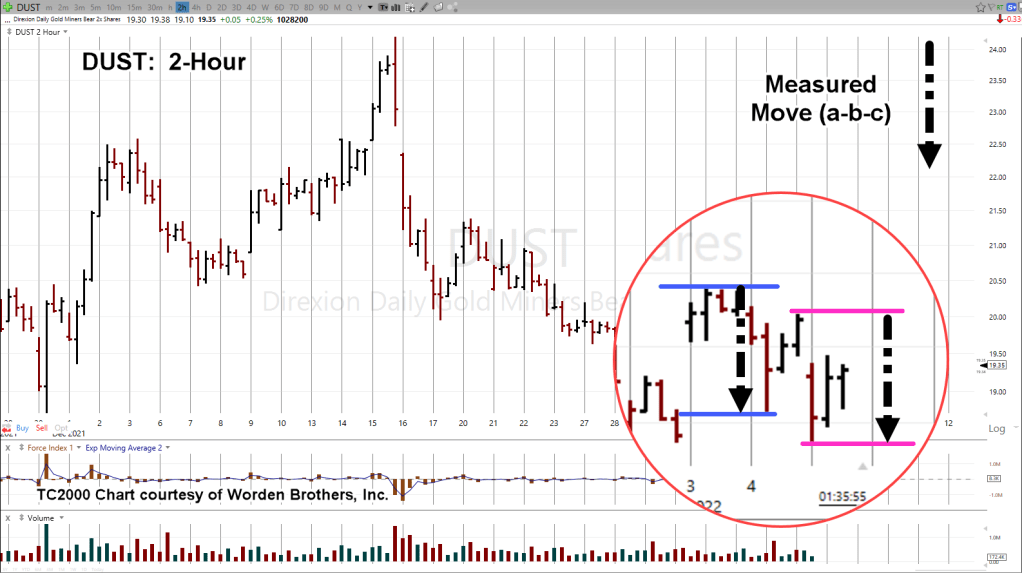
Senior Miners, GDX & Inverse DUST
The 2-Hour chart of inverse fund DUST shows we’re still at the danger point discussed yesterday.
The zoom chart (below) has an interesting distinction.
The distance between the blue-line trading range and the magenta-line trading range, is the same. The black-dashed arrow is equal length.
This implies that yesterday’s move, along with today’s may be an ‘a-b-c’ correction. A counter-trend move.
If so, the main direction has changed from down to up (for DUST).
Summary:
Still at the danger point, we remain short this sector (not advice, not a recommendation).
The good part, if price action reverses in DUST and begins to pressure the most recent lows, it’s an indication something else is afoot and the trade is failing.
Note: Posts on this site are for education purposes only. They provide one firm’s insight on the markets. Not investment advice. See additional disclaimer here.
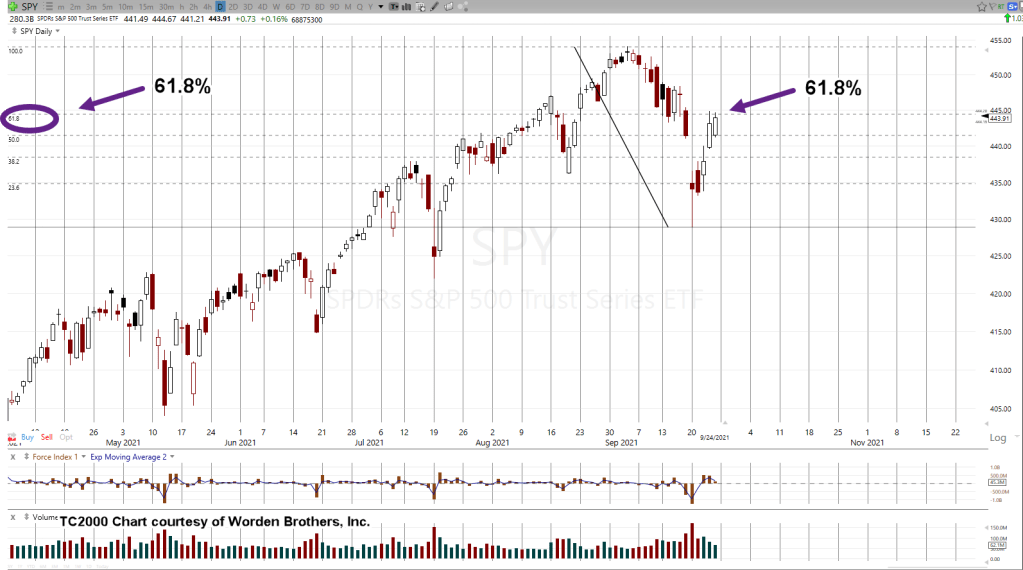
Actually, all three of the major indices, the S&P, The Dow, the NASDAQ have each retraced to (at or near) a Fibonacci 61.8%, level.
The daily SPY is shown above.
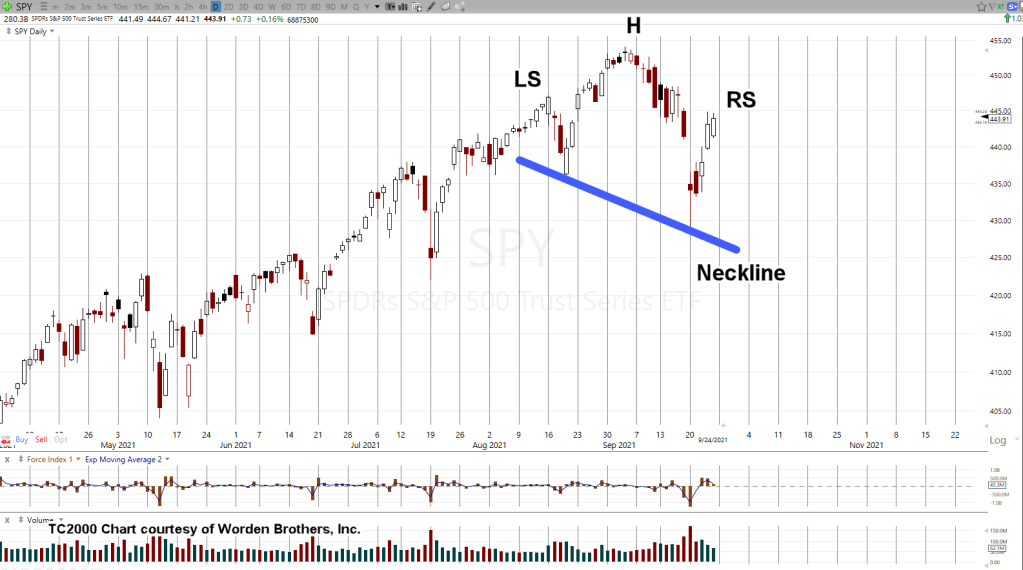
Taking away the Fibonacci retrace levels, then adding notations gives us the following:
It appears we could be at the right side of a Head & Shoulders top.
Price action rolling over from here, then bouncing around the neckline (before breakdown) would let us know, we’re in a significant reversal (not advice, not a recommendation)
Stay Tuned
Note: Posts on this site are for education purposes only. They provide one firm’s insight on the markets. Not investment advice. See additional disclaimer here.
Three markets with key reversals and the biotech sector (SPBIO) posting an inside day.
One other (less followed) market of note with outside down, was basic materials (DJUSBM).
Gold’s (GLD) upward thrust from Thursday the 29th, continues to erode.
One gets the sense that it’s slipping away for the bulls.
SPBIO price action shows the most probable direction is lower.
Expectation for the next session, is for some kind of downside follow-through along with lower market action overall.
Positions:
Current positioning remains unchanged (not advice, not a recommendation) being short the biotech sector via LABD.
Market updates for the week will be limited (as the result of travel) and will resume with technical discussions by the week-end.
Stay Tuned
Note: Posts on this site are for education purposes only. They provide one firm’s insight on the markets. Not investment advice. See additional disclaimer here.
‘If you can’t completely ignore the news and the financial press, you will never be successful in the markets’ (emphasis added).
In line with that, we have this: The very first sentence from this article out of barchart is questionable to say the least.
First:
There is no rapid ‘re-opening’. There never was. There is no ‘pent up’ demand.
Massive credit card usage shows the U.S. consumer has been decimated; using credit just to survive.
It should be (but somehow for some, it’s not) obvious we’re in a controlled demolition of the economy (including the food supply) on a world-wide scale.
Second:
Price increases are the result of supply chain (also, controlled demolition) shutdown not inflation.
Uneducated Economist has probably done the best job of ‘boots on the ground’ work to completely dispel the inflation false narrative.
He called the current and now waning lumber price spike two years ago. That’s how you know who to trust or believe. Take a look at their past analysis and see how it ‘aged’.
Third:
The U.S. population collectively, has never experienced real hardship. Those who made it through the Great Depression have all but died off.
There is no one around to give said population a swift kick in the pants and tell them to ‘suck it up’.
Northman Trader
Sven Henrich has come out with an excellent market update, linked here.
Towards the end of his analysis he states; ‘when the break comes, it will be quick, deep, keep going and most (if not nearly all) will be psychologically unprepared.’
Which brings us to biotech.
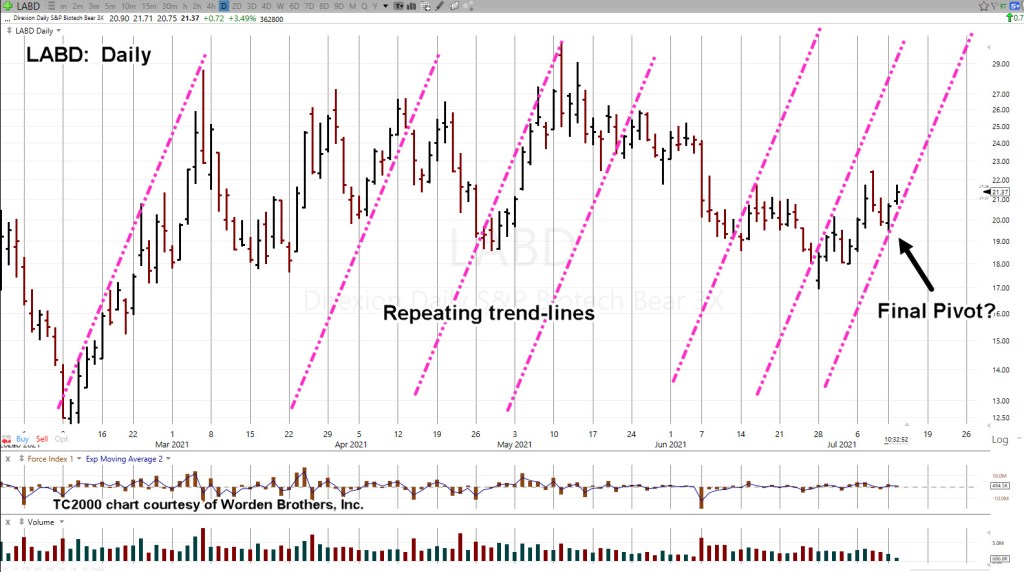
LABD Analysis:
Biotech SPBIO, is back as downside leader: Down just over -25%, from its highs in February, this year.
The daily chart of (inverse fund) LABD is below. The market itself is showing us it wants to follow the repeating pattern of trendlines (not advice, not a recommendation).
If the entire structure (from the February low) is actually a trading channel, it’s hard not to overuse the word ‘massive’.
Non Confirmation:
As of this post, the Dow, the S&P and the Composite are unchanged to slightly higher. Yet biotech SPBIO, is down -1.2%.
We won’t know until it’s all over … but it looks like biotech could somehow be the catalyst (along with the dollar and gold?) that precipitates the final reversal in the overall market.
Stay Tuned
Note: Posts on this site are for education purposes only. They provide one firm’s insight on the markets. Not investment advice. See additional disclaimer here.