Unraveling, Quickly
This just out on ZeroHedge:
An Epoch Times article, using excerpts from a Lancet Report, linked here.
It’s best to let the reader sort out what it all means, arriving at one’s own conclusions.
Of course, the obvious problem, the ‘elephant’ is not addressed directly.
However, VAERS is quoted in The Epoch Times article, thus giving it legitimacy.
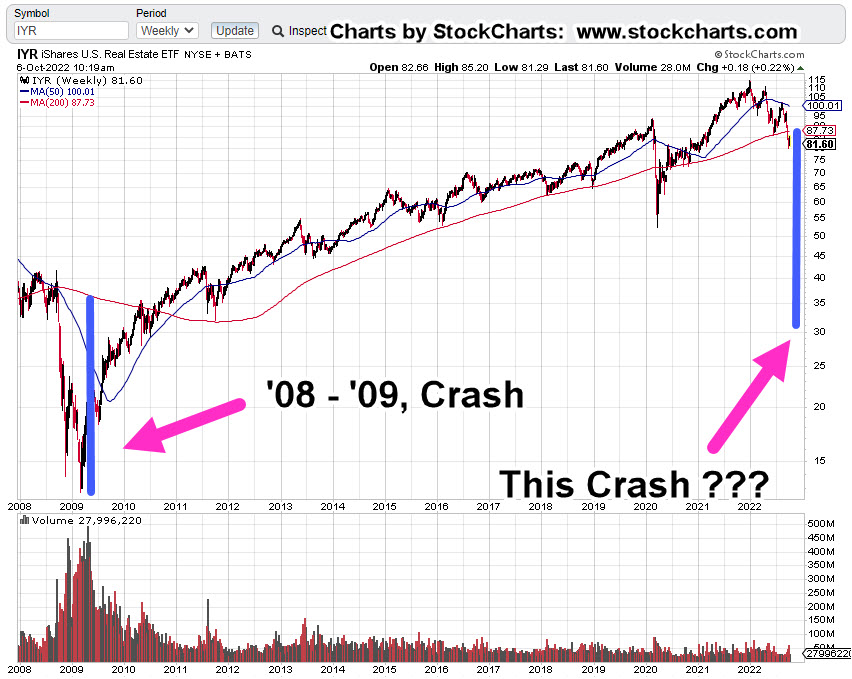
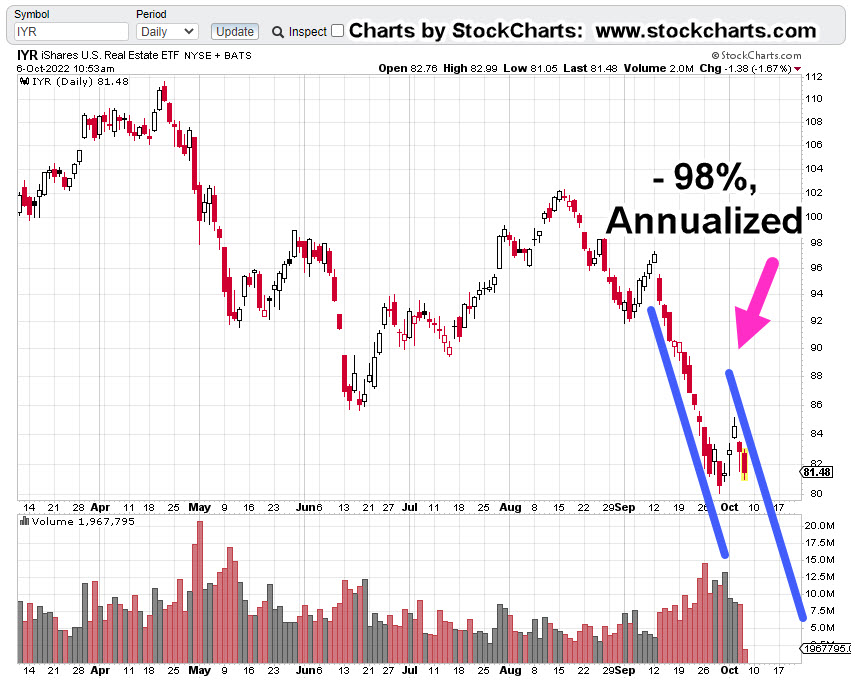
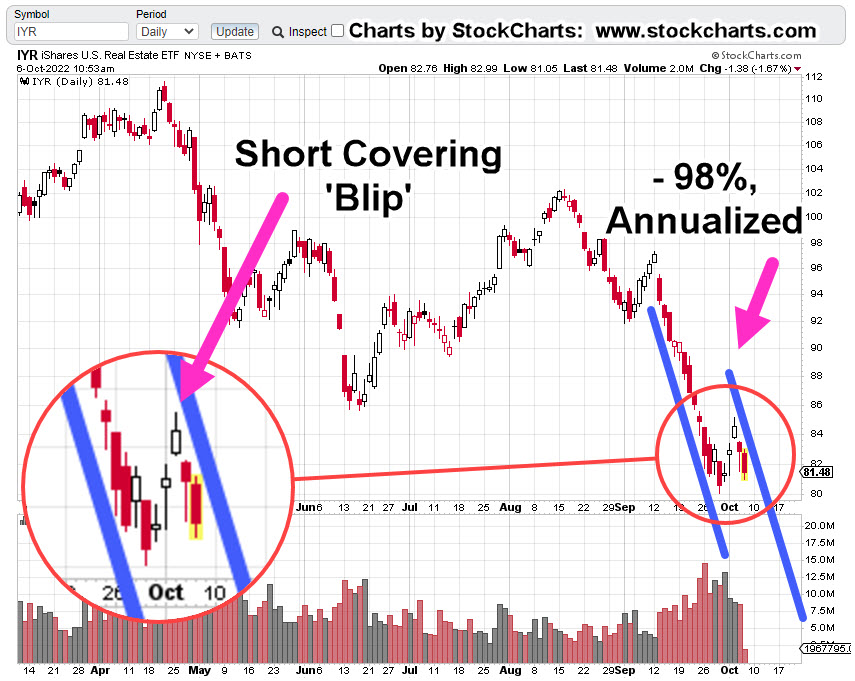
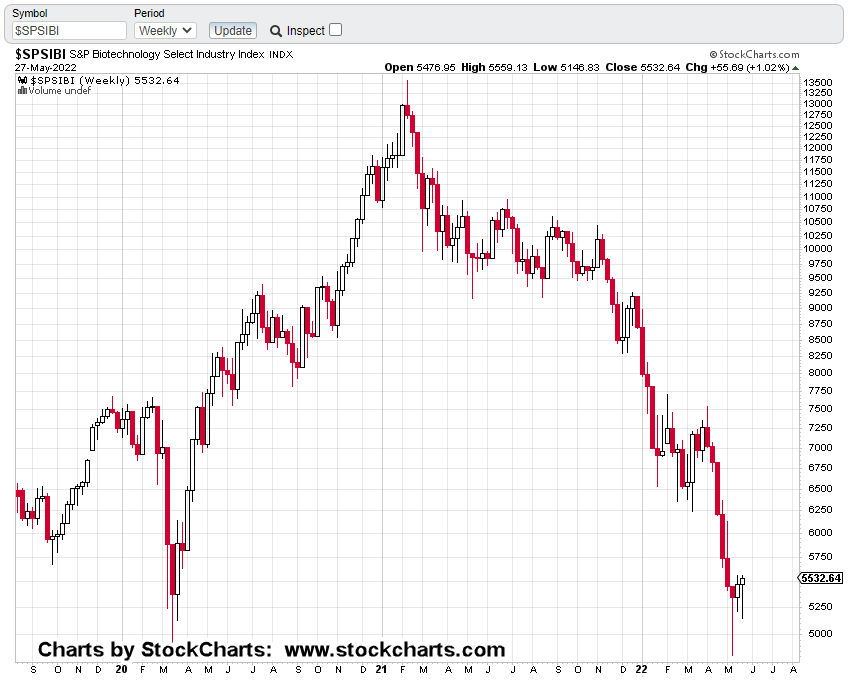
Leading The Downside
For some time, this site’s highlighted, biotech (SPBIO), as unique to all other indices save GDX, and GDXJ.
That is, it’s down the most since the bear market started.
As of today’s close, it’s down over – 54%, from all-time highs while the S&P is down only – 23.7%.
As documented over several years, the sector’s unique; it’s at risk (more than other indices) to implosion.
With today’s close, it looks like we’re at a critical juncture.
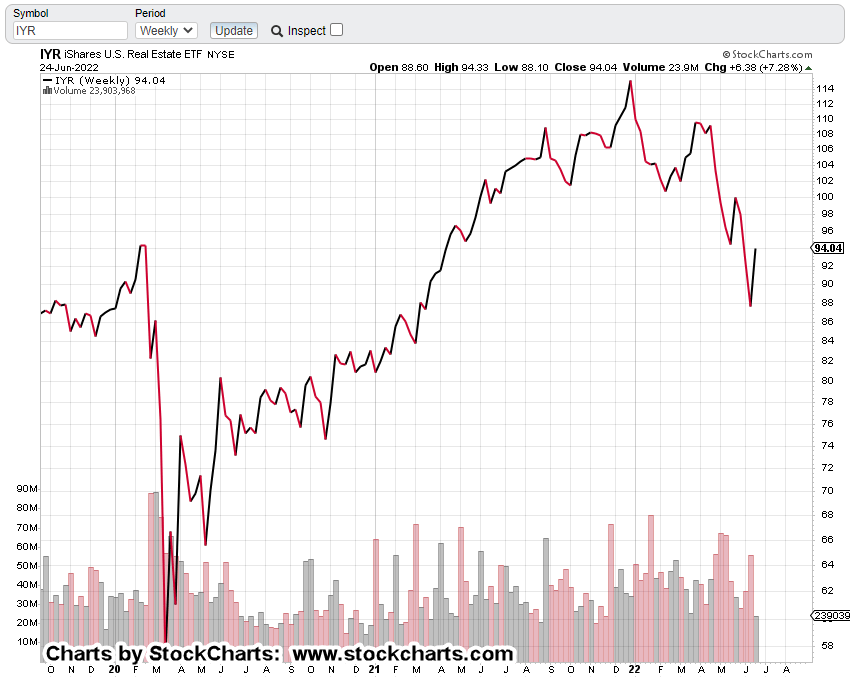
Biotech SPBIO, Weekly
The unmarked weekly chart
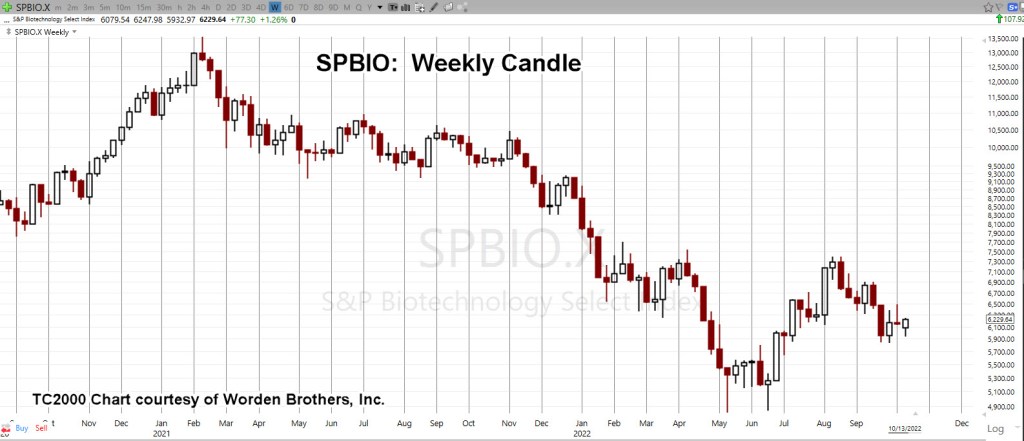
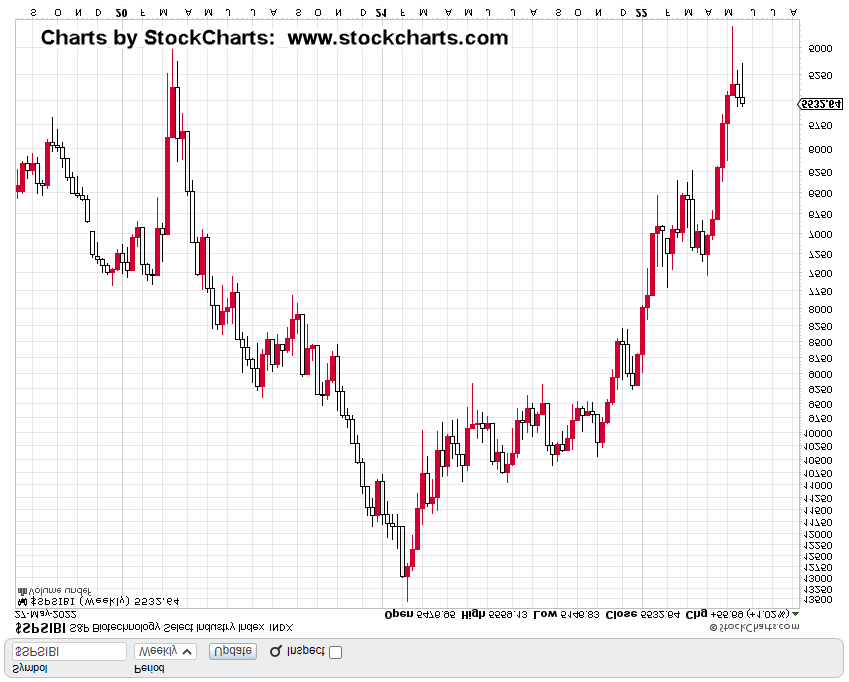
Compressed, with added trendlines.
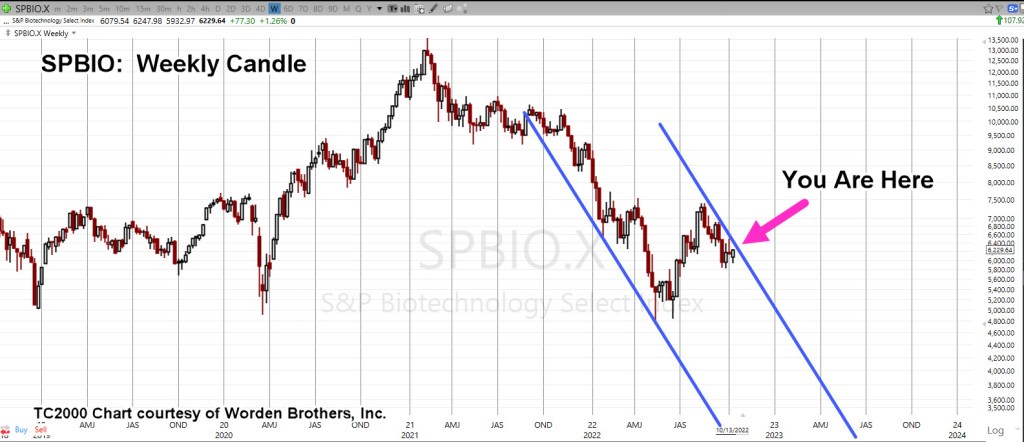
It’s an obvious trading channel of immense size … but so is nearly everything else concerning these markets. We’re operating at unprecedented scale in unprecedented times.
But wait, there’s more.
The trading channel has Fibonacci time correlation(s).
We’ll expand the weekly chart for more clarity.
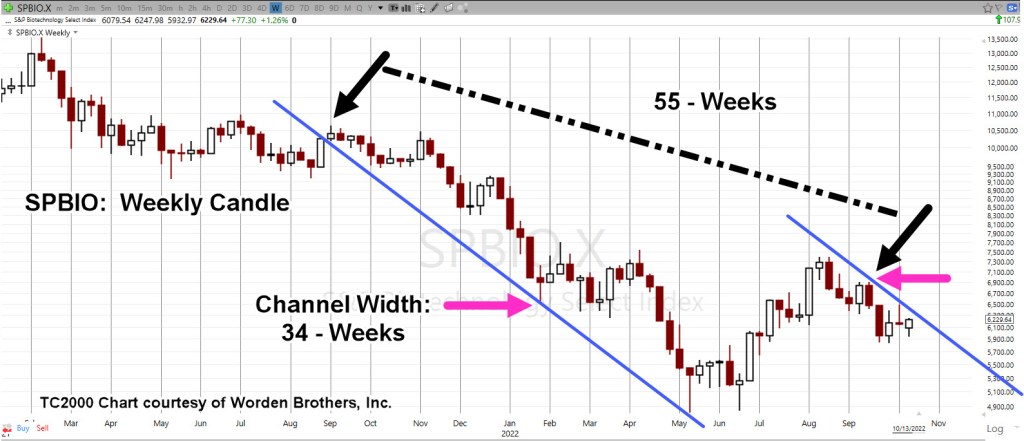
From channel entry, week ending 9/3/21, to the right-most contact point (week ending 9/16/22), is Fibonacci 55-Weeks.
Channel width measured from week ending 1/28/22, to the same contact-point, week ending 9/16/22, is a Fibonacci 34-Weeks.
We’re at The Danger Point®
Positions & Current Stance (courtesy only, not advice).
The following is the positioning of my firm’s main (largest) account.
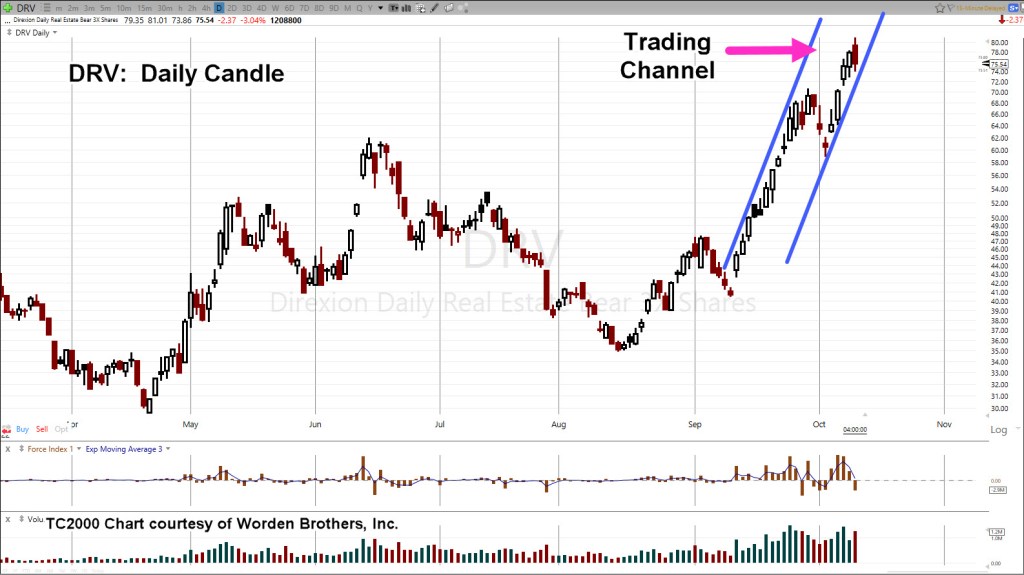
DRV-22-04:
Entry @ 66.463, Stop @ 63.98
Discretionary exit (today) @ 75.96***
Trade Closed
LABD-22-08:
Entry @ 25.1278, 24.735, 26.025***, 22.99***, Stop is Open (to be set at next session)
***, Indicates change
Note: Positions may be increased, decreased, entered, or exited at any time.
Stay Tuned
Charts by StockCharts
Note: Posts on this site are for education purposes only. They provide one firm’s insight on the markets. Not investment advice. See additional disclaimer here.
The Danger Point®, trade mark: No. 6,505,279