Gold’s ‘Maginot Line’

Strong Resistance, Built In

Unbeknownst to many, we’re witnessing a once-in-a-century opportunity and public service.

Those from the era of The Great Depression, are all gone now.

So, the same playbook can be run without anyone (alive) knowing we’ve been here before.

The public service presented to us, the massive on-going exposure of the financial charlatans and grifters.

You can be ‘certified’ and still be a certified (market) dolt.

Neil McCoy-Ward, points this out in his recent update linked here. Go to time stamp 8:40;

“Clueless” … “Completely Asleep”

Anyone who’s worked in the corporate world (in any sector), especially now, knows it’s near impossible to think or act independently.

So, it is with gold.

Gold & The Grifter Bandwagon

Where was everybody back in 2001, when gold was bottoming in the area of $270/oz., after a multi-decades long bear market (from 1980)?

The fact we have nothing but breathless panic from grifters and hangers-on, about rampant inflation should at least give one pause, we could be at a temporary or major reversal (not advice, not a recommendation).

At least with the analysis below, there’s a decision point that will let us know if we’re due for another leg higher, or if there’s a Sovereign debt crisis about to break that would kick-off massive selling of all assets including gold.
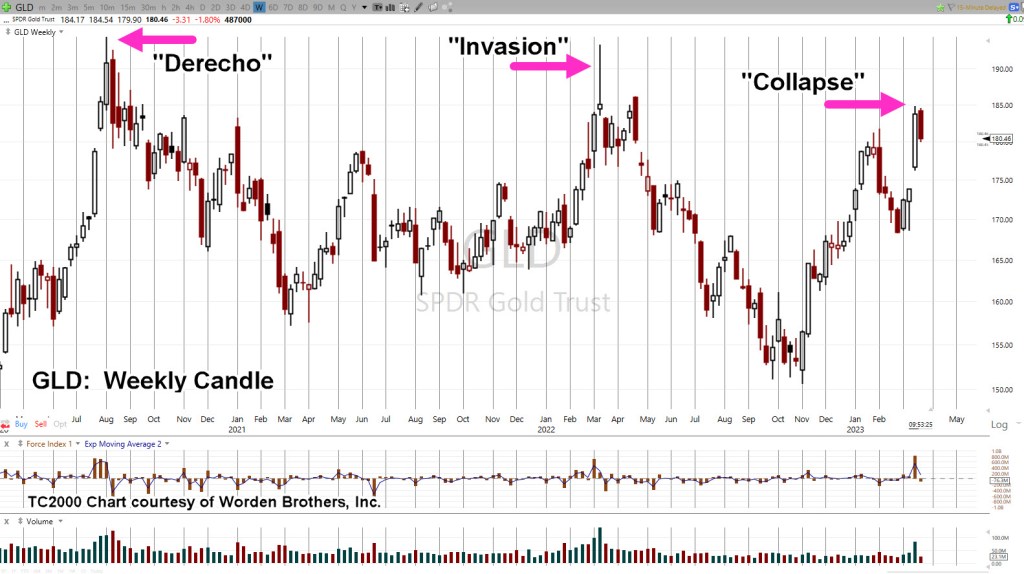
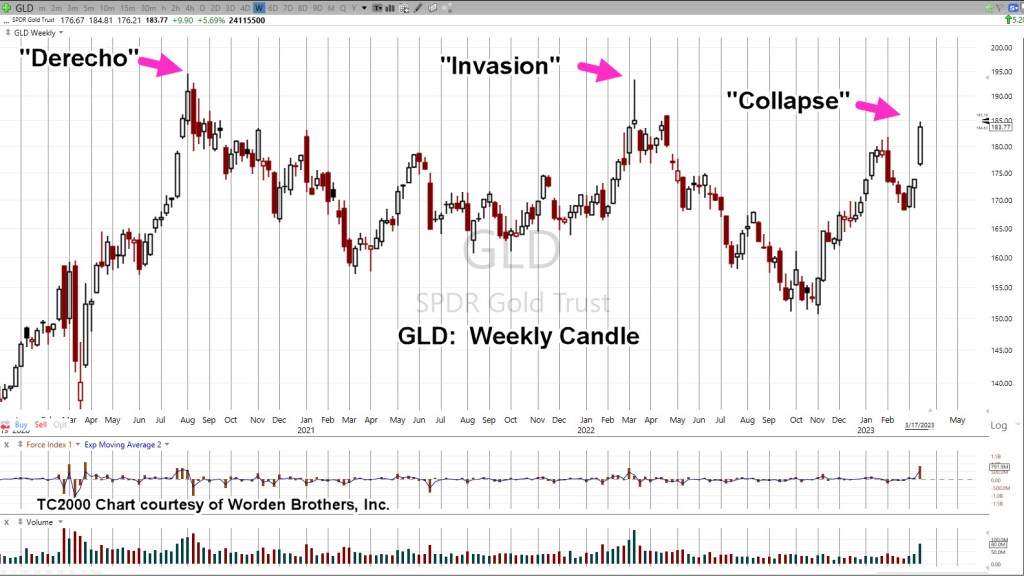
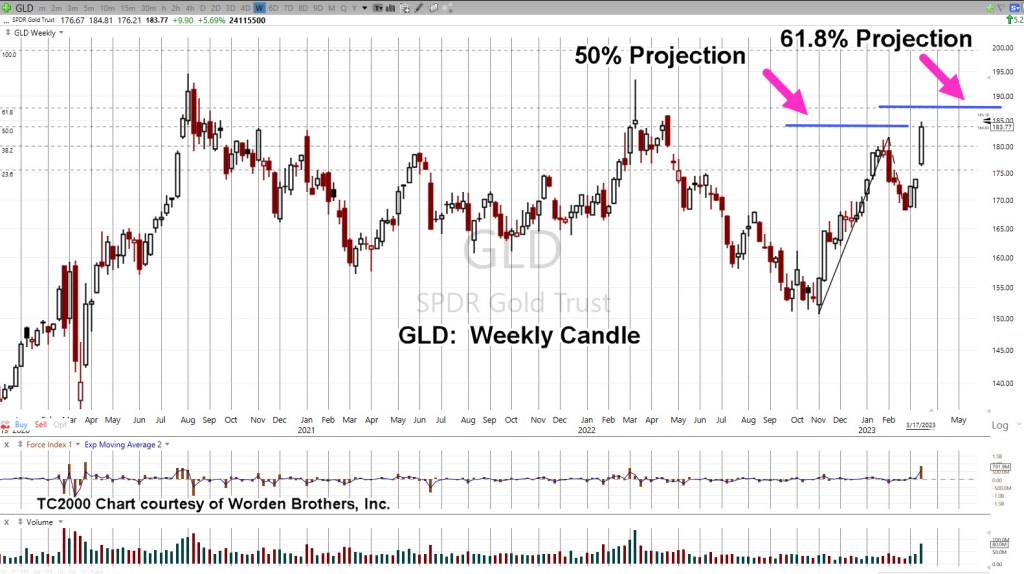
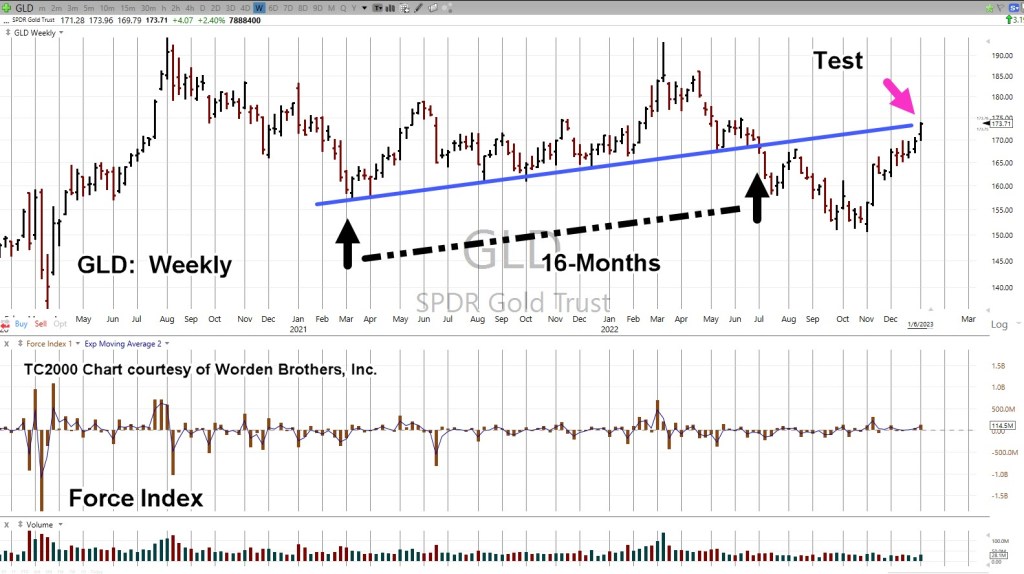
Gold GLD, Weekly

As the title says, we’ve got something akin to a ‘Maginot Line’ for gold. What looks like insurmountable resistance that could still be breached … but for now, is holding.

With each (manufactured) crisis, gold’s momentum in the form of price and volume, is declining.

From a Wyckoff analysis standpoint, the bulls (for now) are running out of steam.

The ‘terminating wedge’ in gold’s price action has already been discussed, link here.

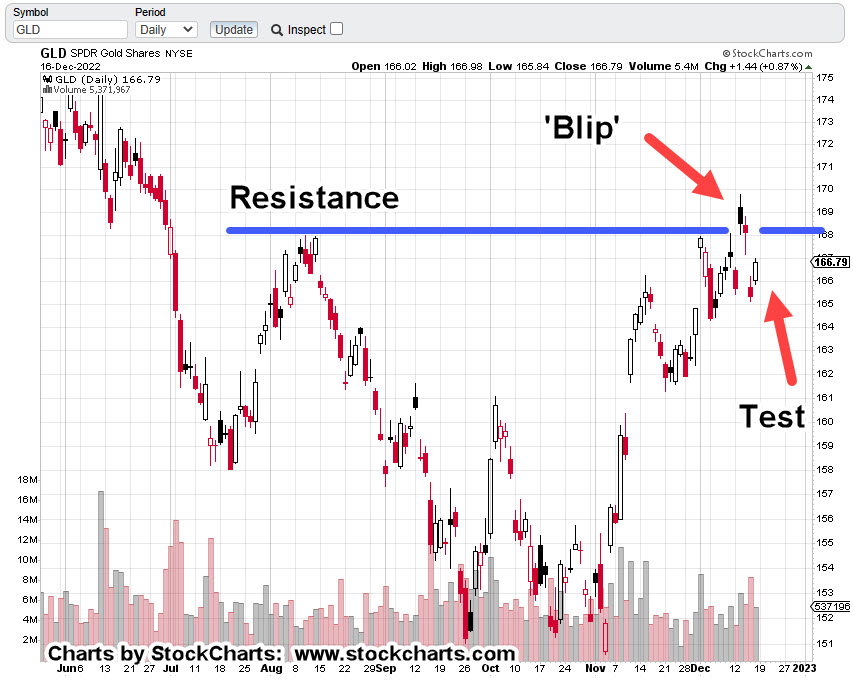
Looking at the action in another light, we see a Wyckoff Up-Thrust in the works. Price action has penetrated a previous high and is currently struggling.

If gold (GLD) is able to significantly penetrate the resistance and hold, then we’re likely on to the hysterical predictions of the masses.

If not, and we get a reversal, it’s going to be big surprise for many. They’ll be stunned, unable to move and eventually provide more fuel for the downside as they sell in panic.

Downside Drivers

What could possibly be a downside driver for gold?

One has already been mentioned, a Sovereign debt crisis. It’s a likely event considering the record-pace rise for interest rates and subsequent bank failures.

Another is an ‘executive’ decision that gold ownership is outlawed. It’s happened in the past and those who got through that event are no longer with us.

Moving on, we’ve already been told there will be a ‘cyber-attack’.

What’s going to happen to gold, when there’s no electricity, fuel or food shipments?

As survivalist author Ron Foster says, in this interview, (time stamp 27:20), during a grid-down situation, he’s not giving up his food. He says, during such an event, precious metals are “meaningless”.

Stay Tuned

Charts by StockCharts

Note:  Posts on this site are for education purposes only.  They provide one firm’s insight on the markets.  Not investment advice.  See additional disclaimer here.

The Danger Point®, trade mark: No. 6,505,279

Gold … Analysis for Engineers Only

It’s Not About ‘Right’, or ‘Wrong’

For the typical engineer, this is probably the most difficult concept to grasp and overcome in the markets:

‘It can’t be calculated’.

Of course, being engineers, they’ll argue about ‘Quants’, ‘Artificial Intelligence’, and the now long forgotten, ‘Watson’.

What ever happened to that so-called computerized answer?

Back in the day, another engineer told me for months on end, how ‘Watson’ was going to change everything.

The ‘machine’ was going to affect my trading. Naturally, he could not say how (when asked), just that it was.

As far as I know, Watson has not been in the news for years.

Enough said.

So, the typical engineer might look at the previous gold updates (here and here) and gesticulate, “It’s wrong!”.

That type of thinking is called a ‘Mind-Trap‘. It’s not about ‘right’ or ‘wrong’.

It’s The Ephemeral ‘Probability’

For gold at this juncture, there’re so many moving parts with some known, and likely many more, unknown.

However, from a strategic standpoint, the probability is we’re at The Danger Point®

As we speak, there’s a panic into the metal that’s not being confirmed by the other monetary metals, Palladium, Platinum, and Silver.

Yet, even with the ‘panic’, gold (GLD) remains below the previous ‘Invasion’ spike high, shown below.

Gold GLD, Weekly

Each market ‘extreme’ (so far) is lower than the last.

As can be seen by the blue line, we’re right at resistance and the ‘test’ of the prior spike high.

The chart below paints a more ominous picture (for the downside).

If GLD, can’t push higher from here and begins to retrace, it potentially confirms the wedge pattern.

A ‘terminating wedge’ is typically the last part of a move before reversal.

Why A Reversal?

As mentioned, there’re a lot of moving parts. There’s also an unprecedented amount of debt world-wide that’s now coming under strain to say the least.

The SVB collapse and others, likely set events in motion not yet fully revealed to us in the serfdom.

Sovreign nations have sold gold to pay off debt in the past like this example.

How much more debt do we have now, versus then?

The Big Surprise

So, it’s not about right or wrong or getting the top tick before reversal. It’s about the probability.

That probability says we’re at a confluence of debt, interest rates, price resistance, market patterns and (potential) sentiment extremes.

No one expects a major downside reversal in gold. It would be a massive surprise, if it happens.

Stay Tuned

Charts by StockCharts

Note:  Posts on this site are for education purposes only.  They provide one firm’s insight on the markets.  Not investment advice.  See additional disclaimer here.

The Danger Point®, trade mark: No. 6,505,279

Gold … The ‘Bubble’ Wins

At Least, For Now

The rabid gold bulls … foiled again.

From the last update (emphasis added):

“Gold (GLD) either reverses from here or moves slightly higher to the 187.50-area before reversing.”

Immediate reversal is exactly what happened.

Actually, gold did go higher to the targeted (GLD 187.50) area in the overnight session; then reversed before the regular session open.

So, it did both of the forecasted moves. 🙂

The ‘Real’ Unemployment

By now, anyone with two pension-plans rubbing together, knows the numbers … that is, any ‘official’ numbers are complete propaganda (not advice, not a recommendation).

For example, the ‘real’ unemployment here, is likely closer to 25%, rather than the ‘official’ level below 4%.

Keep that in mind, as we continue on.

Gold GLD, Weekly

The GLD, weekly has the three major tops with the current (potential) one included.

The second chart (the daily) focuses on the reversal; in technical terms a ‘Wyckoff Up-Thrust‘.

Gold GLD, Daily

Right now, we’re at the test or The Danger Point®; it won’t take much force to move price action either way.

Pointing probabilities to the downside, we have a repeating pattern of ‘Spring to Up-Thrust’.

It’s an observed empirical phenomenon, markets tend to go from a Wyckoff ‘spring’, straight into an ‘up-thrust’.

The New ‘Paradigm’

Well, we probably to have a new paradigm but it’s not in gold (not advice, not a recommendation).

That new paradigm is what no one will discuss.

In the opinion of this author and contrary to what is presented here and here (remember our ‘unemployment’ numbers) we’re in a full-scale demand and population collapse.

The ‘inflation’ for possibly a large part, has been manufactured.

You can’t have over one-hundred food processing plants mysteriously burn down (bug, insect factories not affected) with millions upon millions of egg laying hens destroyed, cattle herd at 1962, lows and not affect the price.

For whatever reason, the mainstream has decided to reveal to the masses what’s been known for years to those who are awake.

Of special interest, Tucker Carlson interview, linked here.

Going Forward

Gold’s at The Danger Point®.

If it can’t make it higher from here on so much apparent and ‘rampant’ inflation, there’s a real risk of it being affected by some kind of Sovereign default … somewhere.

A default would potentially lead to a massive asset sell-off; including everything that’s not nailed down … i.e., gold.

Stay Tuned

Charts by StockCharts

Note:  Posts on this site are for education purposes only.  They provide one firm’s insight on the markets.  Not investment advice.  See additional disclaimer here.

The Danger Point®, trade mark: No. 6,505,279

Gold … Bubble or Breakout ?

We’re About To Find Out

As this post is being created the Credit Suisse battle, rages on.

Recent updates are here and here.

Of course, it’s all planned chaos … but that’s a discussion for another time.

The apparent response from gold (GLD) over the past week, was to move sharply higher.

As expected, the gold bulls are in their brain-stem mania.

Once again. It’s a ‘new paradigm‘.

With that, let’s not forget the last time we had a ‘new paradigm’. Gold has not been higher, since.

Trading opportunity? … Maybe.

New ‘Paradigm’? … Probably, not.

Different, This Time?

As we’ll see below, there are potentially two outcomes for the price of gold (not advice, not a recommendation).

First: Gold (GLD) either reverses from here or moves slightly higher to the 187.50-area before reversing.

… OR …

Second: GLD, pushes higher, just shy of the 200.00, mark, while getting itself into a Wyckoff up-thrust condition.

The first chart shows the extremes as of Friday’s close (Sunday futures, yet to open).

Gold GLD, Weekly

Concerted effort to destroy (or pollute) the food supply began with the Derecho. That effort continues to this day.

Secondly, we have the ‘invasion’ of Ukraine. Note the GLD spike is lower than the Derecho.

Now, we have the banking ‘collapse’. Once again (so far), the upward spike is lower than previous.

Looking at the second chart, we see a Fibonacci projection to 50%, the GLD 183.77-level; exactly where GLD, closed on Friday.

Empirical observation over many years has revealed, if price action gets to a 50% projected level, it’s typically on its way to higher levels.

A Lower Peak

Even if GLD moves up to the 61.8% projection as shown, the GLD 187.50-area, it’s still below the prior ‘Invasion’ peak set at GLD 193.30.

If GLD, moves significantly past these levels, then it’s likely on to new, all-time-highs and a potential Wyckoff Up-Thrust (reversal) condition.

If it happens, we’ll address it at that time.

Stay Tuned

Charts by StockCharts

Note:  Posts on this site are for education purposes only.  They provide one firm’s insight on the markets.  Not investment advice.  See additional disclaimer here.

The Danger Point®, trade mark: No. 6,505,279

Oil … Gas … Gold & Newmont

Markets, At Critical Juncture

Nemont Mining (NEM), Gold, and the Oil & Gas Sector are at a critical juncture.

The rest of the major indices, Dow, S&P, QQQs, real estate (IYR), and so on, are in a similar position.

For this update, we’ll focus on Newmont (NEM), as it’s the largest cap in the Senior Mining Sector GDX, and a general representative of the commodities markets.

Financial collapse is a process, not an event.

Newmont topped-out in April, of last year. Exxon, the proxy for the Oil & Gas sector, may have reached its highs this past November.

Where’s The Inflation?

As Michael Cowan has just reported, banks are absconding with depositor’s money under the guise of ‘bail-in’.

If the fiat cash is so worthless, why are banks seizing it?

As Robert Prechter Jr., said years ago, ‘all fiat cash ultimately goes to zero’; the end game (most likely) for the dollar. However, it could be months, years, or even a decade before that happens.

For right now, today, this minute, the data is showing us, the banks want the money; ‘Show me the money‘.

With that, let’s look at the non-existent ‘inflation’ in the mining sector.

Newmont Mining NEM, Weekly

The first chart identifies the heavy volume and then test of wide price bars. This behavior is common in the markets; they tend to come back and test wide high-volume areas.

Next, we see there’s a terminating wedge developing as volume declines; the inference, is lack of significant commitment at these price levels.

We’ll get close-in on the wedge; last week printed a lower weekly low and closed lower for the week.

There’s no breakdown of the wedge … yet.

At this juncture, it’s up to the bulls to show they’re still in control.

Inflation vs. Scarcity

We have without a doubt, the effects of the event from the past three years gaining momentum. Whether or not those effects reach a peak this year, is unknown.

A lot of the mainstream and YouTuber’s alike talk about the upward move in gold as the result of ‘inflation’.

Here’s a little bit of insight you’ll not find anywhere else; how about gold rising because the above mentioned ‘effects‘ are causing production volumes to decline?

Maybe it’s because of scarcity (along with nearly everything else) that’s causing the increase in price.

Just to drive that idea home, the latest total gold production numbers, listed here.

Gold production for 2020 dropped -8.2%, from the year prior. Year 2021 was down -1%, from 2020.

From 2010 to 1019, gold production increased or was flat year over year … that is, until 2020.

Stay Tuned

Charts by StockCharts

Note:  Posts on this site are for education purposes only.  They provide one firm’s insight on the markets.  Not investment advice.  See additional disclaimer here.

The Danger Point®, trade mark: No. 6,505,279

Precious Metals … Silver & Gold

The ‘Non-Confirmation’

Something’s not right in the precious metals sector.

Gold’s just off -8%, from its highs while other monetary metals (Palladium, Platinum, Silver) are far below their highs; silver’s off a whopping -51.75%, from its 2011, highs.

In addition, as we’ll see below, silver (SLV) is just now contacting the right side of a trend line and potential downward channel structure that goes all the way back to the lows of 2015.

The ‘Squeeze’ of 2021

Below on the weekly chart of SLV, is a point labeled “1”.

That’s the location of what turned out to be a right-side trend line contact. Back then, an update on the ‘squeeze’ was posted, linked here.

Taken from that update was the following (emphasis added):

Those attempting garner forces (the little guy) to move the markets, such as silver, will find out soon enough who’s in control … and it’s not them.

It’s unlikely silver is going higher any time soon. There could be some upward spasms as the crowded trade exhausts itself; it’s likely we’ve seen the SLV highs for quite some time.

So, here we are nearly two years later; SLV never posted higher than the February 2nd, squeeze of 2021.

So, what’s next? Is there something else going on?

We’ll look at that question after the charts.

Silver SLV, Weekly

First, is the un-marked chart.

Next, we see a pattern that’s not so clear without mark-up.

For SLV, to break out, there needs to be an absence of motivated sellers (prices drift higher) or sufficient buying demand to overcome the downward trend.

Inflection Point

For an idea of what’s likely to happen next, we’re going to go to an unlikely source; Daniela Cambone and Gregory Mannarino.

It’s not about ‘controlling’ inflation and it never was, going all the way back to 1913. It’s about the ‘end game’, as discussed by Mannarino.

“Eliminate The Middle Class” (time stamp 11:40)

The sticky wicket is the ‘debt bubble’ and the ‘elephant’.

The Elephant Grows

The chart of silver (and other precious metals) and its non-confirmation with gold, could be an indicator of debt collapse and demand collapse first, before hyperinflation.

Multiple times a day now we have reports like the following flooding into the marketplace:

COVID Vaccines Are “Obviously Dangerous” And Should Be Halted Immediately, Say Senior Swedish Doctors

‘Normalization’ Of Emergency Use Authorizations Concerns Health Experts

CDC Says Stroke Concerns Over Pfizer Jab Warrant Investigation

They Promised “Safe And Effective”; We Got “Sudden And Unexpected”

Pentagon “Exploring” Back-Pay For Troops Kicked Out Over COVID Vaccine Mandate

Multiple Young Athletes And Former Athletes Died Suddenly This Past Month

Doctor Calls For Withdrawal Of Pfizer, Moderna COVID-19 Vaccines Following New Research

The above list is just since yesterday and it’s only 2:00 p.m., Central Time, today!!!

Monetary & Manufacturing

Silver is unique more so than gold, in that it’s an industrial metal as well as monetary.

The collapse in manufacturing demand could be the reason silver’s not confirming gold’s move.

It may also be telling us, as the effects of the elephant take hold, a huge liquidation of all assets could be coming; paradoxically as the need for fiat cash (not precious metals) to pay off debt, increases.

Stay Tuned

Charts by StockCharts

Note:  Posts on this site are for education purposes only.  They provide one firm’s insight on the markets.  Not investment advice.  See additional disclaimer here.

The Danger Point®, trade mark: No. 6,505,279

Gold Bulls … Go Berserk … Again

Testing The Trend

Since the lows last November, to the close this past Friday, gold (GLD) has moved higher by a decent but modest 15.4%.

Naturally, the opportunists are out telling us ‘We’ve been warned’, ‘this is it’, ‘it’s going to the moon’ … yet again.

With that backdrop, we’re going to look at the precious metals facts, not the hype.

‘Precious metals’ because there are only four that have ‘currency code’ classifications, i.e., are classified as an asset with ‘currency like’ monetary characteristics.

Currency Codes

Gold, Currency Code: XAU

Silver, Currency Code: XAG

Palladium, Currency Code: XPD

Platinum, Currency Code: XPT

The Market Itself

Way back over a century ago, Wyckoff discovered the key to understanding the next likely move of the markets was the study the market itself (not fundamentals).

Wyckoff essentially ‘locked himself in a room with just a stock ticker and phone line’.

Months later, when he emerged, ‘Studies in Tape Reading‘ was the result.

We’re going to use his insight from that text.

That is, what’s the market’s saying about itself? What’s the next likely direction?

Off The Highs

For some of the precious metals, they’re off their highs by a significant amount (percentages approximated).

Gold (GLD): Down -11%, from highs

Silver (SLV): Down -55%, from 2011, highs

Palladium (PAH23): Down -47%, from highs

Platinum (PLJ23): Down -53%, from highs

All of the precious metals are down nearly 50% or more, except gold.

In the case of Platinum, it’s near 1980s levels!

So, where’s the inflation?

Oh wait, here it is … one more time.

That’s not saying ‘money printing’ has no effect. There are a lot of moving parts. Intentional destruction of the food supply is just one of those parts.

Old School Analysis

Hypothetically, if you dropped an ‘old-timer’ into the markets at this juncture (without him knowing the ‘hype’), and showed him all four charts of gold, silver, palladium, platinum, and asked ‘what’s happening?’

What’s his response?

After a brief look at the charts, he would likely say:

‘Gold’s move higher is not being confirmed by the other precious metals’.

Note that all four metals peaked together during the inflation spike of 1980.

Ergo: At this juncture, something’s wrong.

Either the other metals are going to ‘catch up’ to meet gold or gold is going to come down to meet the others.

That is of course, unless this time is different … somehow.

With that, we’ll look at the chart of gold to see what it’s saying about itself.

Gold GLD, Weekly

We’re starting with the unmarked chart.

Note: Elder’s Force Index scale is expanded to show the nuances of GLD, price action.

Next, we see we’re at a test of the trendline in place for 16-months before the downside breakout of July, last year.

Moving in closer, we have a wedge formation prior to the up-move last week.

Is this a breakout to the upside or a throw-over?

At this point, it’s unknown.

We can see that Force Index is below where price action entered the wedge during the week of November 11th.

Less force up into resistance (trendline), paints a slightly more bearish than bullish picture.

The ‘Why’ Comes Out

As if on cue and in classic Wyckoff style, we have a ‘why‘ for the move off the lows of last November.

Classic Wyckoff, because he said the ‘why’ of a move comes out after the fact.

There you have it; China buying gold last November and December.

During this move from the recent lows, it was certainly a trading opportunity for the bulls … but from a strategic standpoint, what happens next?

The Non-Confirmation

Non-confirmations can last a long time.

For example, the Oil & Gas sector XOP, declined for eight months, from April 2019 to January 2020, before the price of oil (USO) finally broke lower.

With the ZeroHedge article just released a few hours ago, we can expect at least a blip higher at the next GLD, open.

After that, we’ll see.

Stay Tuned

Charts by StockCharts

Note:  Posts on this site are for education purposes only.  They provide one firm’s insight on the markets.  Not investment advice.  See additional disclaimer here.

The Danger Point®, trade mark: No. 6,505,279

Gold … Repeating (Short) Set-Up

At The Extreme

Gold is at the extreme … again.

It’s also posting a repeating pattern; indicating a short set-up (not advice, not a recommendation).

As presented over a year ago, that set-up is defined as what’s called (in Wyckoff terms), a spring-to-up-thrust.

Meaning, price action has a repeating tendency to go from one trade set-up to another.

We’ll go to the daily chart.

Gold GLD, Daily

The Changing of Hands, is included because as of yet, that (downside) reversal has not been decisively negated.

There’s no downside capitulation volume; indicating we’re on the other side (bullish side) of the current downtrend.

Now gold is at The Danger Point®. The ephemeral place where risk is least; price action can (easily) go either way.

So The Question Is, Which Way?

Here’s one perspective that’s reasonably balanced.

The theory is all about Central Banks … ok, if it works.

From a personal (trading) standpoint, the fundamental approach was abandoned years, if not decades ago.

Moving closer-in on the daily, we have the following.

Price action is struggling at resistance (upper blue line).

As stated in a prior update, if GLD, can’t hold and move above this level, it’s an indicator of potential serious trouble to the downside.

Of course, it goes without saying, the miners, GDX, GDXJ, are at similar danger points.

Stay Tuned

Charts by StockCharts

Note:  Posts on this site are for education purposes only.  They provide one firm’s insight on the markets.  Not investment advice.  See additional disclaimer here.

The Danger Point®, trade mark: No. 6,505,279

Gold … The Five Stages of Reversal

First, is Denial

We’re about to find out the truth of gold’s direction.

The last update showed a ‘blip’ above known resistance.

It’s been three trading days since then and gold (GLD), has yet to close above last Tuesday’s level.

Gold could head straight lower from here. However, the more likely outcome is a test of resistance.

The test, if it happens, may be the defining moment for gold on a go-forward basis.

Just to add some intrigue, we have yet another bullish forecast for gold.

How GLD, handles the test may let us know if it’s going to act just like the rest of the market. i.e., potentially head much lower.

Going back to the bullish article, it’s interesting the author references the Maginot Line.

In an odd ‘predictive programming‘ kind of way, referencing that support area in such a way, may actually put it into play.

That Was Then …

The Maginot Line was built (like most government projects), to handle a catastrophic event after the fact.

World War I had already happened. Whatever comes next (WWII), won’t be like what came before.

The same is true for the markets. It’s called the ‘rule of alternation’.

However, in the markets, anything can happen.

With that, let’s take a look at the most probable outcomes for gold.

Gold GLD, Daily

As of Friday’s close, GLD, is sitting right at the 38.2%, retrace from the ‘blip’ high posted on Tuesday, the 13th.

Getting all the way up to the resistance (blue line) would put GLD, at 61.8%, retrace.

Of course, powering through resistance changes the character of the action. If that happens, then maybe we really do have a bull market continuation.

Stay Tuned

Charts by StockCharts

Note:  Posts on this site are for education purposes only.  They provide one firm’s insight on the markets.  Not investment advice.  See additional disclaimer here.

The Danger Point®, trade mark: No. 6,505,279

The Netflix Breakdown

Gap Closed & Retrace Complete

Well, ladies and gentlemen, we have a completely discretionary (spending) business, that looks ready to resume its downtrend.

As the American public is forced to figure out what they need and what they don’t, paying for streaming movies can be eliminated from the ‘must haves’, with ease.

We’ll look at the big picture first to see what’s actually happening.

Netflix (NFLX) Weekly

The massive downward thrust (dropping over -35%) on April 20th, this year, created a huge gap on the daily chart.

The weekly shows it took thirty-two weeks to fill the gap, starting from the April lows.

The next chart has a terminating wedge, similar to gold (GLD) as discussed previously.

The daily chart shows the wedge close-up.

The lower trendline has been decisively penetrated and action is currently thrusting lower.

We’re at mid-session, 1:12 p.m., EST.

As NFLX, heads into the close, it’s possible there may be an attempt to rally, testing the lower wedge boundary (not advice, not a recommendation).

Stay Tuned

Charts by StockCharts

Note:  Posts on this site are for education purposes only.  They provide one firm’s insight on the markets.  Not investment advice.  See additional disclaimer here.

The Danger Point®, trade mark: No. 6,505,279