Note: Posts on this site are for education purposes only. They provide one firm’s insight on the markets. Not investment advice. See additional disclaimer here.
‘Sometimes it seems as if the market hangs in the balance by the weight of a feather.’: Wyckoff, circa 1910.
Is this the big reversal to the downside?
Before we get to that answer, let’s review two recent market pivots (including today).
A Day To Remember
Back on May 4th, the post with the same title, linked here, was to be used for reference on a go-forward basis.
The post has a linked article, whose comment section could be surmised as the bourgeois rebuke of a 78-year-old fund manager.
That manager was quoted as saying, “It’s the biggest bear market of my life”; to which the younger crowd responded with derision, effectively saying the old man’s a dolt, an idiot, a doofus and needs to retire.
Now that time has passed, let’s remind ourselves when the quote was published with the daily (IYR) chart below.
Not only did IYR, not close higher after that, it never printed higher either. It was the top of the pivot reversal, to the day.
The 23.6%, Retrace
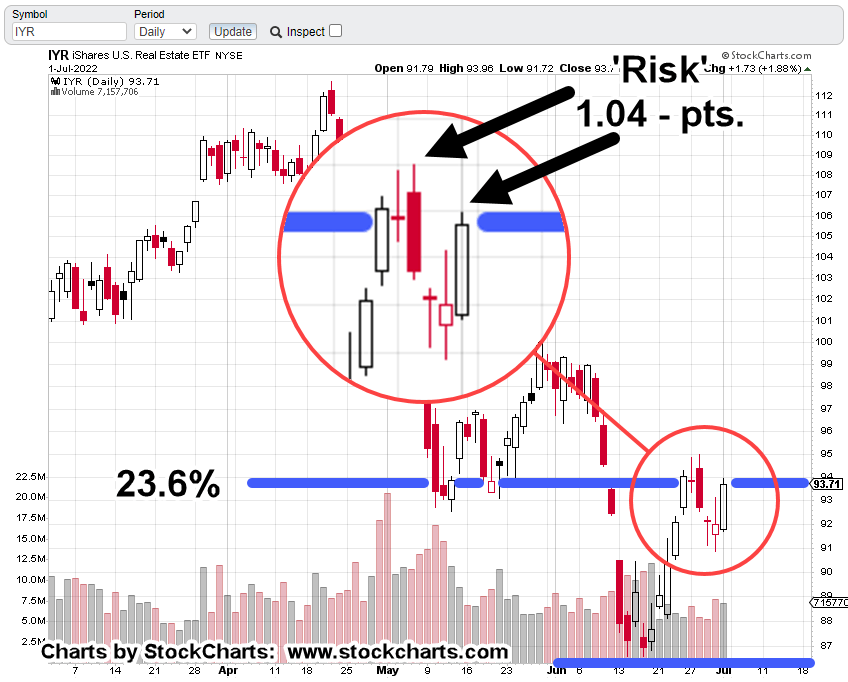
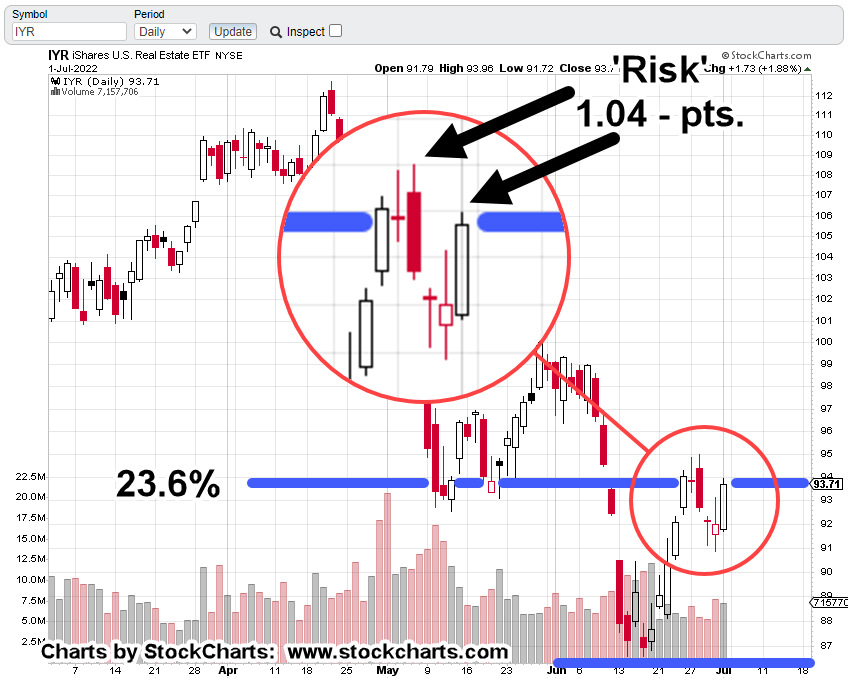
Then we have this report just days ago, showing IYR’s price action coming back to a (very weak) Fibonacci 23.6%, retrace.
The daily chart repeated below, showed the ‘risk’ on a short position as approximately 1.04-pts (not advice, not a recommendation).
Risk Narrows Even More
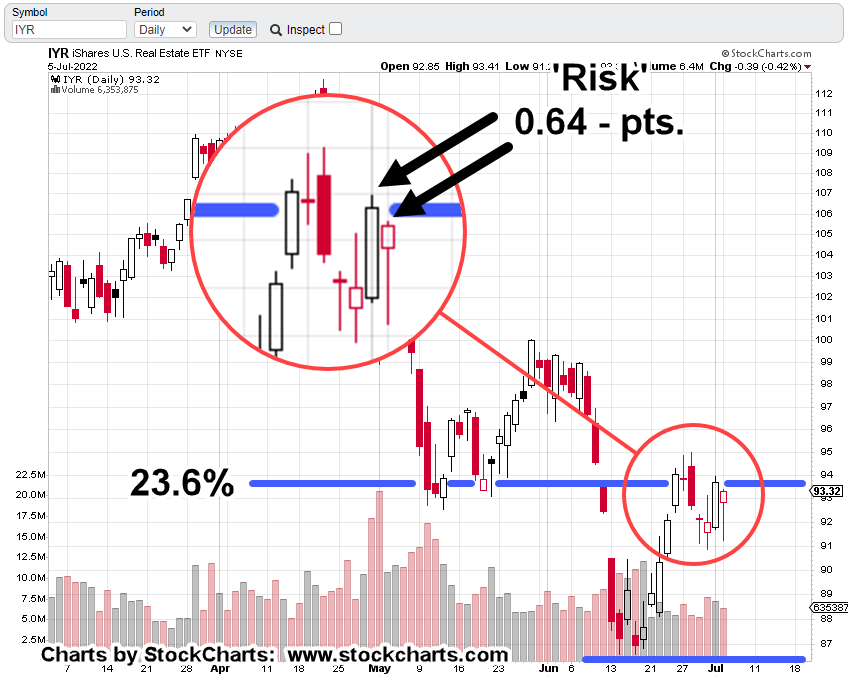
As a result of today’s new daily low and lower close, one can (theoretically) reduce the risk of a short position even further (not advice, not a recommendation).
The risk is now defined as the distance between today’s close (IYR: 93.32) and Friday’s high of IYR: 93.96
A subsequent push above Friday’s high negates the short and would likely indicate a potential move to a 38.2%, retrace.
Subtleties of The Market
A lower daily print and marginally lower close (IYR down just – 0.39-pts.) does not look like anything of consequence.
Could we be right in the middle of a historic crash and not even know it?
Of course, it’s never for sure, until it’s over.
However, if shorting opportunities are being spotted, entered, and managed correctly, probabilities are that one will already be positioned short when ‘the big one’ hits.
Note: Posts on this site are for education purposes only. They provide one firm’s insight on the markets. Not investment advice. See additional disclaimer here.
The Danger Point®, trade mark: No. 6,505,279
Active: Positioned short via SRS (SRS-22-01), with stop at SRS: 16.38
Anyone who thinks the Fed’s going to ‘pivot’ because the numbers are weak, does not understand (or won’t admit to) the real purpose of the entity; but I digress.
The Strategy
Way back in December of 2020, this post was released which discussed ‘Genesis 41’, specifically.
It was an intuitive assessment; we’re in a phase where corn and grain (i.e., the food supply) are potentially more important than ‘stacking‘ silver or gold.
Over the ensuing year and a half, how correct, that has proven to be.
Then, nine-months ago, was this post, presenting the ‘elephant’; a massive population decline whose repercussions would last the lifetimes of anyone reading.
Now, we have this. A report that confirms the elephant.
It’s all starting to hit the mainstream, although the language is still being couched to not cause undue panic. Good luck with that.
So, what’s next?
The Danger Point: Real Estate
While mainstream press and money managers alike struggle to figure out the obvious, we have price action itself telling us the next likely direction of the market.
During an economic downturn there are many places not to be such as semiconductors, airlines and other low margin businesses, restaurants and so on.
However, the most illiquid of all, is real estate. It does not matter how bad one wants to sell, if there is no buyer, there is no sale.
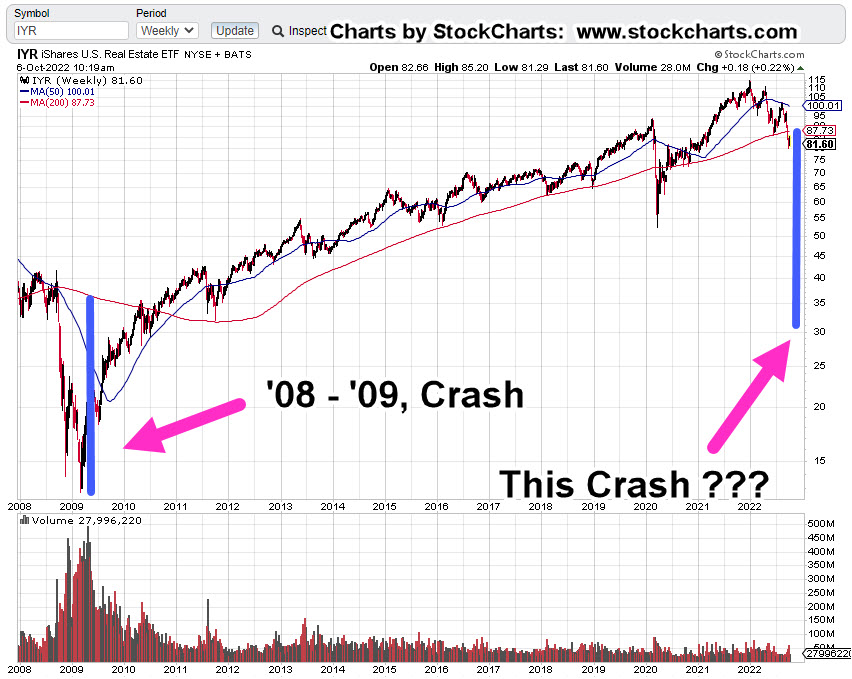
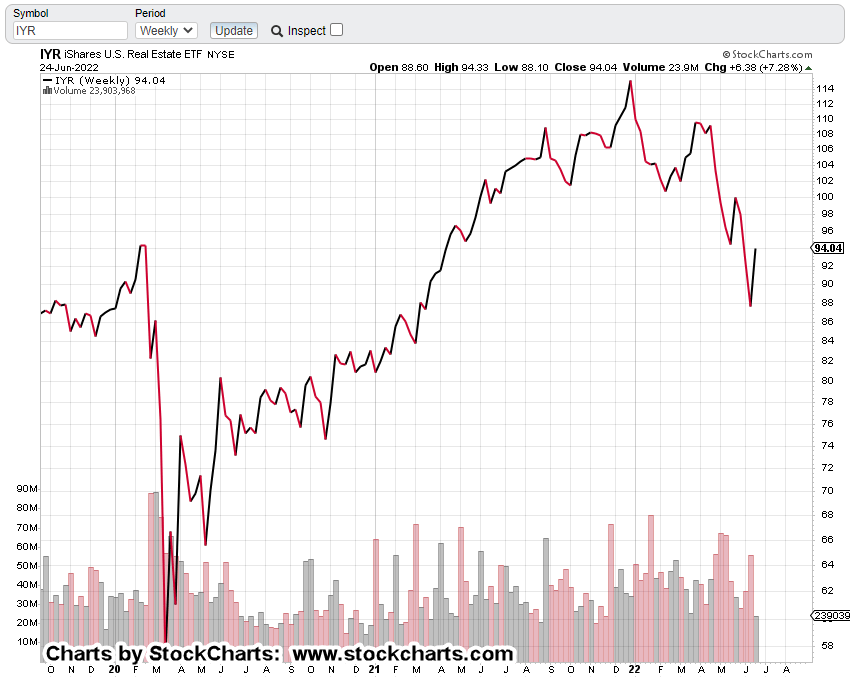
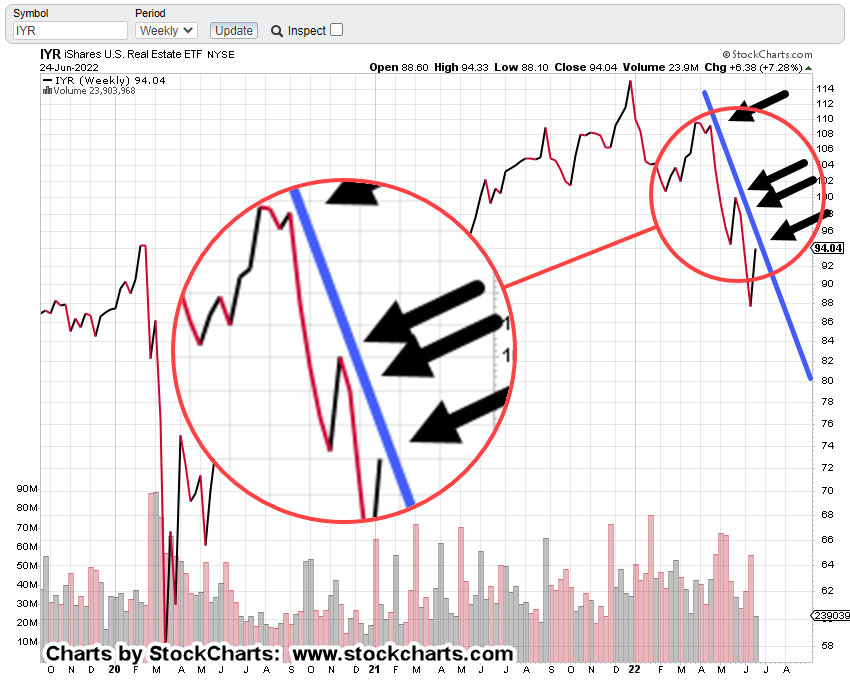
Real Estate IYR, Weekly Chart
Last week, real estate IYR, closed right at the Fibonacci 23.6% retrace as shown.
Getting closer in on the daily, it’s marked up to show the risk from a shorting perspective (not advice, not a recommendation).
Real Estate IYR, Daily Chart
In this case, the risk on a short position is defined as the distance from last Friday’s high (IYR: 93.96) to that same week’s high of IYR: 95.0
Let’s add, Friday’s action saw IYR, retrace a Fibonacci 76.4% (the most available) of the entire move for the week.
The Summary
Amazon (AMZN), ProLogis (PLD), and Real Estate IYR, are joined at the hip.
Now the economy’s imploding, massive warehouse space is not needed.
Ditto that for employees as well.
ProLogis is already down – 31.2%, from its all-time highs set just this past April.
We’ve already shown PLD, has a nasty habit of going straight down during a market route.
Last time, PLD, crashed over – 84%, in just two months.
Note: Posts on this site are for education purposes only. They provide one firm’s insight on the markets. Not investment advice. See additional disclaimer here.
Note: Posts on this site are for education purposes only. They provide one firm’s insight on the markets. Not investment advice. See additional disclaimer here.
That’s the assessment from agents in the field on the imminent real estate implosion.
Interest rates have risen dramatically, applications have evaporated, properties not moving as before, prices are dropping, lenders deploying the last resort; Adjustable-Rate Mortgages (ARM).
When the ARMs, show up in force, it’s over.
Technical & Fundamental
Over the past several days, the real estate situation has been assessed from both a technical (chart) perspective as well as the fundamentals.
The bottom line (below), is so long, it may have to be covered in several posts.
On a weekly and daily close basis, IYR has contacted underside resistance.
On a weekly and daily close basis, IYR has contacted the right side of a downward trading channel.
Multiple gap-fills at IYR, 91 and 94. Volume declines over – 22.5%, on the second gap-fill.
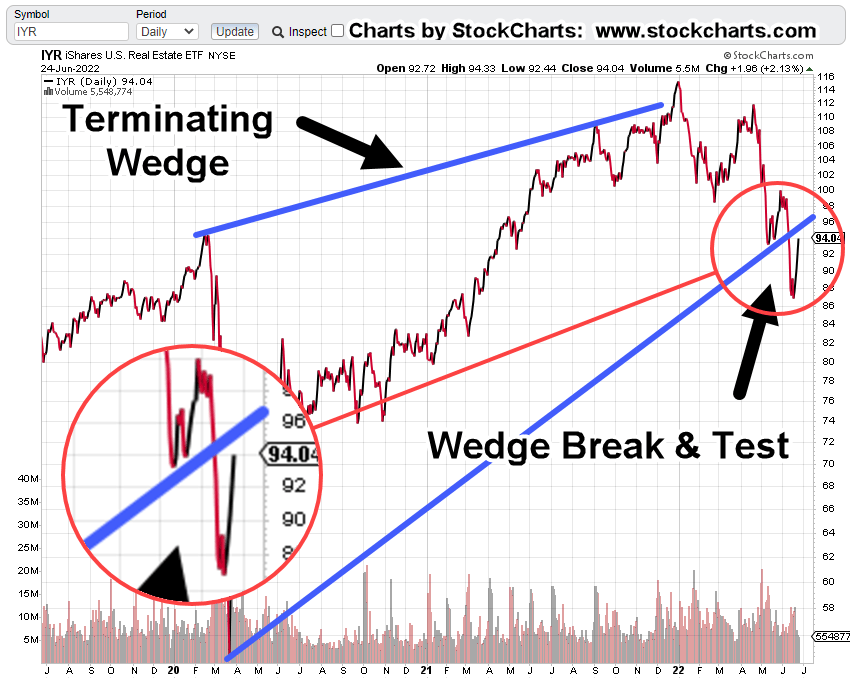
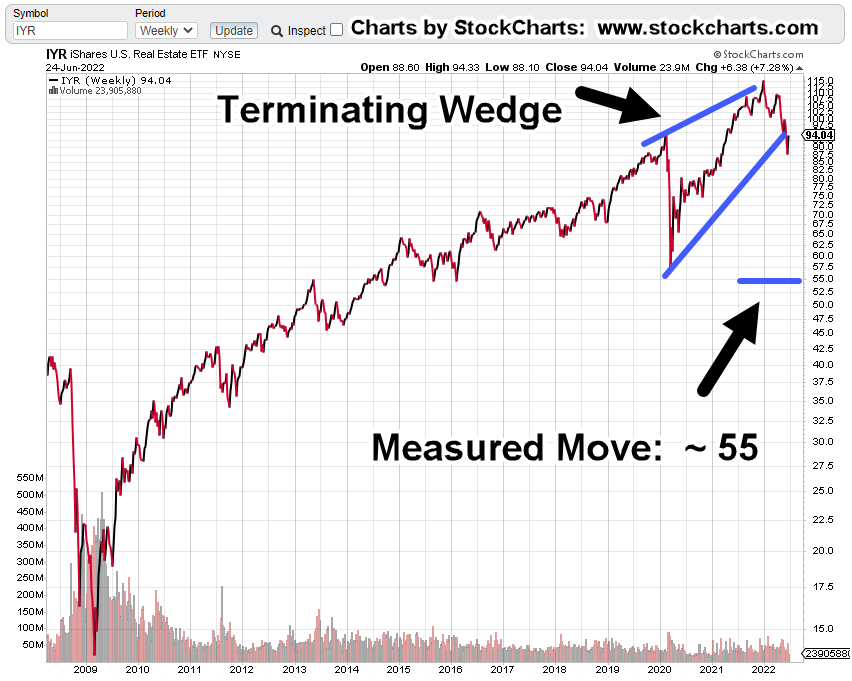
Multiple rising wedge breaks on multiple time-frames signal a potential drop of – 41.5%, from current levels.
Trading volume contracting (as price is rising) on multiple time frames, indicates potential lack of trader commitment to higher prices.
Financial press gets in the game (with several reports), saying ‘now is the time to buy’.
As highlighted above, once the Adjustable Rates dominate, the top is in.
This top may be far worse than ’07 – ’08, as debt levels are much higher, consumer is tapped-out and there is a massive ‘elephant’.
That elephant is now going mainstream with the resultant effect of unprecedented population decline/disablement.
So, let’s get started.
Real Estate IYR, Weekly Close
Un-marked chart.
Test of underside resistance
Zoom of underside contact.
Right side trendline.
Zoom of contact points.
Trading Channel
Wedge Break: Daily Chart
Zoom of break and test
Wedge Break: Weekly Chart
Note:
A measured move to 55-area, gets IYR, back to 2020 lows. That’s a reasonable expectation for an initial leg down.
If we use Prechter’s assessment concerning bubbles (manias), price action eventually retraces every bit (sometimes more) of the entire bubble move.
That puts the ultimate destination of IYR, somewhere in the vicinity of 14.0, or lower, representing a decline of – 88%.
It was going to be $3,000/oz., in months, not years.
Gold-O-Mania was coming. You could even sign up and pay money to read the group-think of the imminent launch.
Well, obviously at this point, $3,000/oz., is nowhere in sight.
Gold (GLD) is even lower now than it was then. On top of that, the ‘changing of hands’ assessment has not been negated; prices continue to grind lower.
Having the financial press cheerlead at the exact wrong time, is an (almost) necessary component to identify a lasting reversal.
As we can see here and here, the financial media’s position is, we’re heading higher. There is ‘real buying’ (whatever that is) for the first time in weeks.
However, from the chart evidence presented above (and we didn’t even get to ‘gap-fills’, ‘multiple wedges’, ‘contracting volume’ … maybe later), it’s hard to present that price action will somehow move significantly higher.
Price action behavior above, appears to point to an immediate or very near-term downside reversal.
Summary
Lastly, we have this from Activist Post: Real estate housing crash in progress.
Be careful. If you read the article, can you see the ruse?
It’s been discussed before on this site. That is, the real purpose of the Fed.
Note: Posts on this site are for education purposes only. They provide one firm’s insight on the markets. Not investment advice. See additional disclaimer here.
As we speak, economic activity is shutting down … fast.
Amazon shipments cancelled, gas stations going dry, banks halt lending, real estate sales collapse.
Meanwhile, the market’s in a short-squeeze.
What happens next?
We’ll discuss real estate and biotech farther down but first the data sources.
Dan from i-Allegedly reports here, he still has a couple of rubes (my word) that think the market just bottomed out.
Good luck with that.
As we’ll show below, the real estate bear market (IYR) rebound, was identified ahead of time.
Next, we have Red Hurricane describing one semi-trailer load after another being cancelled. He hauls for Amazon.
Shipping activity’s contracting, seemingly, by the minute.
Lastly, this link where the D-word, ‘Depression’ is used within the first one-minute, twenty seconds.
Bottom-out in the stock market? Probably not.
So, let’s take a look at real estate IYR, and see where it might go next.
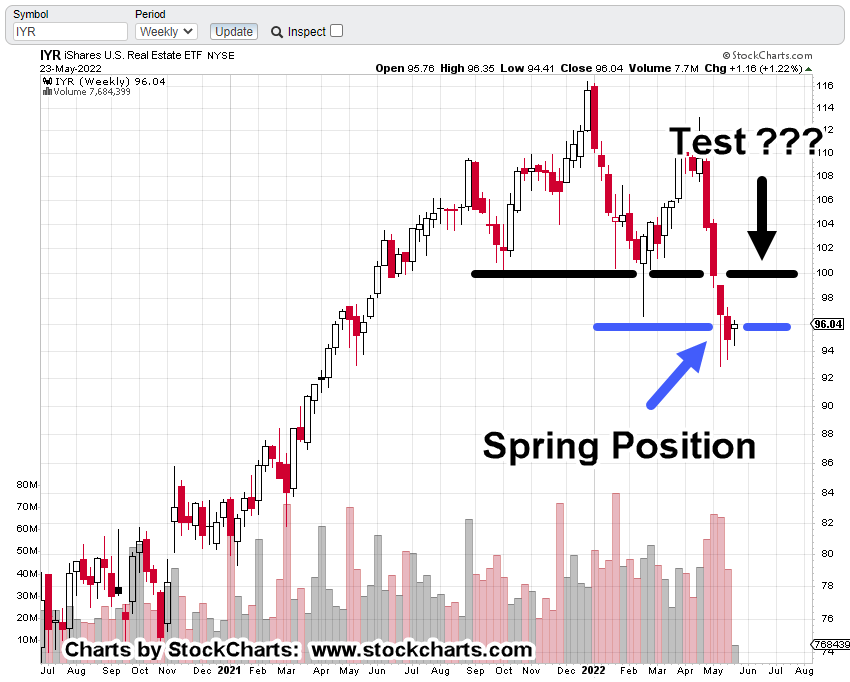
Real Estate IYR, Weekly Chart
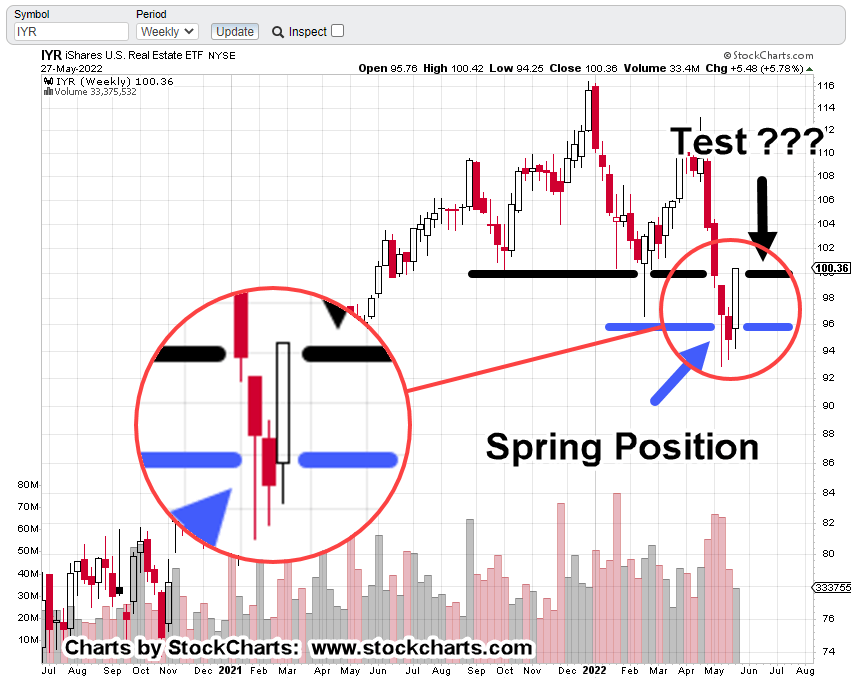
The last update (link, here) showed potential to rise into a test of resistance. That’s exactly what happened.
Back then:
And now:
With zoom
Obviously, the upward test happened much quicker than anticipated … but it was anticipated … no surprise.
Real estate got itself into Wyckoff spring position; so, a rebound (test) is normal market behavior … short-squeeze or not.
If it was a squeeze and if it’s over, we can expect an immediate drop in price action. We’ll analyze that as it plays-out in the coming week.
Now, on to biotech, SPBIO
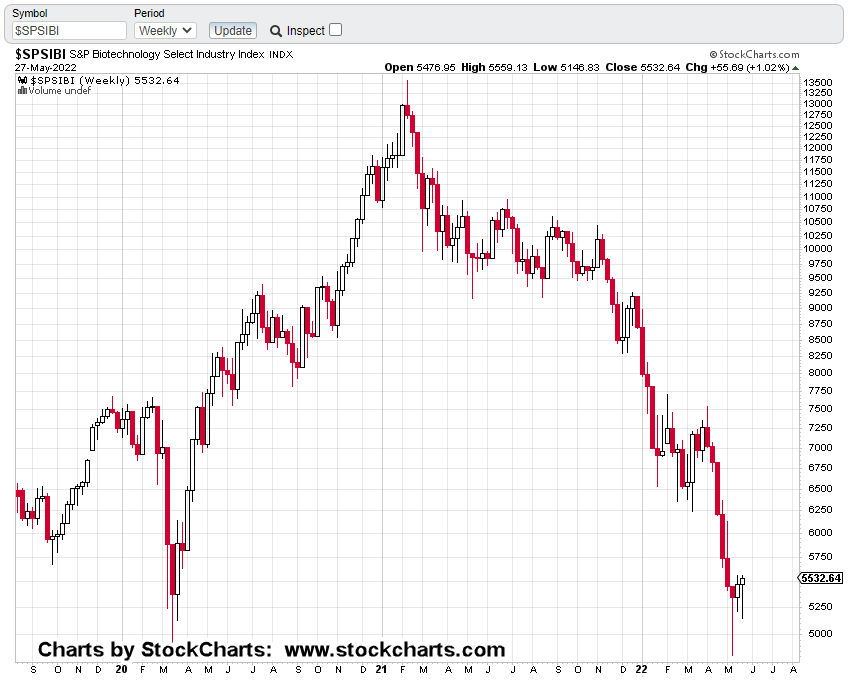
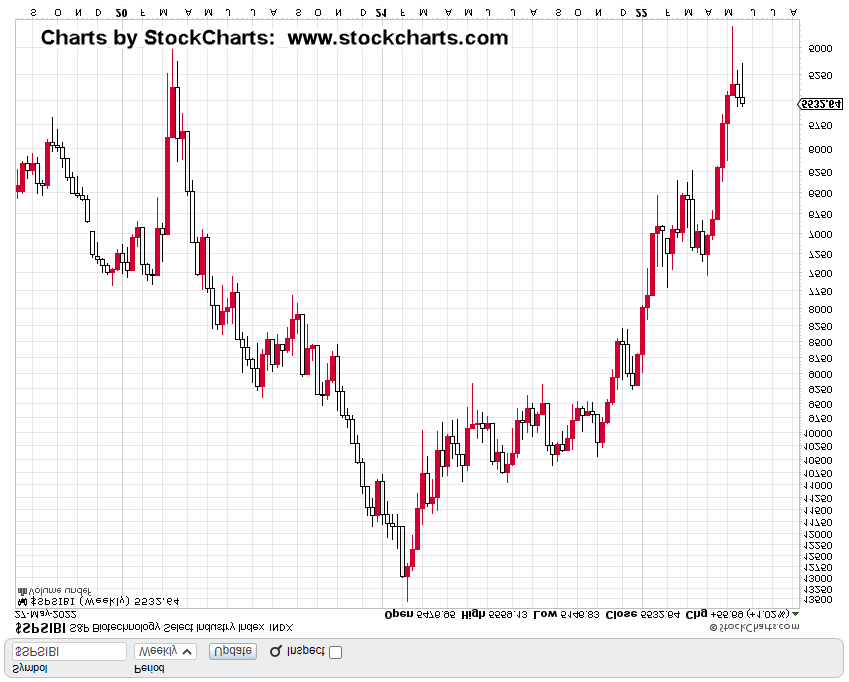
Biotech SPBIO ($SPSIBI), Weekly
Some housekeeping first.
Obviously last week, with being short, more downside action was anticipated resulting in upside for LABD.
On Friday, that did not happen. Biotech was part of the squeeze as well.
The short position via LABD, identified as LABD-22-02, was reduced but not exited completely (not advice, not a recommendation).
At present this is where we are.
First, we’ll start by inverting the chart to mimic the action of 3X inverse, LABD.
Next, we’ll zoom-in and highlight the ‘squeeze’.
Doesn’t look like much when viewed that way does, it?
Next, we’re going to zoom-in, on the zoom
In spite of all the squeeze chaos on Friday, price action could not post a new weekly low (high on the non-inverted).
We’ll see this Tuesday, if that’s important or not.
This post is getting long but let’s end with the rule of alternation. The same chart is marked up below.
If this rule is still in-effect, we’re at a juncture where one can expect a ‘simple’ alternation.
We’ve already had complex action on the prior congestion; so, we can expect current action to be simple in character.
That means, price action’s not likely to stick around at these levels whether it’s going up or down.
Based on the above analysis, the expectation for Tuesday’s open is a gap lower for SPBIO and higher for LABD.
If that does not happen, something else is at work … we’ll report on that as necessary.
Summary
Has the market bottomed out? Not likely.
Those who are at this late stage, still arguing with Jerimiah Babe and Dan (and Patera), that the market’s rebounding, everything’s fine, are in a state of delusion.
The mindless herd following spending with ever newer cars, moving up to the McMansion, opulent vacations, posting it all on Facebook is most decidedly, gone.
It’s finished. It’s Done.
The problem is, as J.B. notes above (time stamp 7:15 and 8:30), those still living that life don’t seem to know it’s over.
For the leaders, the tiny minority and those reading this post, who are, or who have been preparing for years, it means potential huge (life changing) opportunities.
That is, as long as the markets, the banks and other infrastructure stay open; not guaranteed in any way.
Note: Posts on this site are for education purposes only. They provide one firm’s insight on the markets. Not investment advice. See additional disclaimer here.
It’s possible, because price action is always the final arbiter.
Before the rest of the report, some housekeeping.
Real Estate IYR, has broken the down trend lines previously discussed.
A discretionary (not stop related) exit was performed on all positions at approximately DRV 46.45.
Trade DRV-22-02, is officially closed.
If the market turns around and looks like IYR is about to resume its downtrend, the DRV position could be re-established (not advice, not a recommendation).
As it stands, profit on the entire DRV-22-02, was in the vicinity of +19.2%.
That’s not too bad, considering the rest of the population is losing their shirts as reported here.
There were 25 DRV, transactions during the trade.
Where to Now?
Real estate can resume the downtrend, or it can test the underside of support, now resistance (shown below).
Under ‘normal’ market conditions, a test is typical behavior.
However, we’re in a financial collapse so anything is possible.
Real Estate IYR, Weekly
The chart above paints a familiar picture.
The overall trend is down. However, that does not mean price can’t go higher.
In fact, as we all know, the sharpest rallies occur in the middle of bear markets.
Whether we get one now, is unknown. Typical market behavior is to come back to the resistance area (black axis line) for a test.
Summary
From personal standpoint, I’ll take the near 20% gain (not advice, not a recommendation) and stand on the sidelines for a more definitive set-up.
Note: Posts on this site are for education purposes only. They provide one firm’s insight on the markets. Not investment advice. See additional disclaimer here.
No, the update below, is essentially a confirmation of the analysis in that (above) report.
Turns out that Amazon (link here) is in negotiations with chief cook and warehouse bottle-washer, ProLogis (here) about terminating massive amounts of lease space.
The entire affair, is an irrefutable confirmation of the Wyckoff analysis method.
That is, ‘the market itself defines it’s next likely course’.
Those on the inside always know something; that ‘something’ (i.e., their actions) shows up on the tape.
After the initial ‘ProLogis Connection’, a follow-up was posted that identified the largest down-thrust energy in ProLogis history.
From that report was this quote:
“We’re using PLD, as the proxy for the real estate (IYR) sector as it’s the largest cap equity.”
“That’s true for now … but maybe not for long.”
How quickly things change.
ProLogis is now the number two in the IYR market cap and very close to being third.
No. 3
Wealth Confiscation Coming Soon
The first two bullets perceived events before they happened, so let’s make it three-in-a-row.
This one’s pretty much a no-brainer.
During the last meltdown in 2007 – 2009, IRA retirement accounts came within a hairs-width of being confiscated.
The following’s a section of a report written years ago.
It’s even more relevant now.
Begin Report
4/7/19
Government To Confiscate IRAs? It’s Easy
There has been enough time for the American working (and saving) public to take the lessons of the 2007- 2009 meltdown and act accordingly.
One of those lessons would have been to realize, just how close they came to having their IRAs confiscated.
Personally, I’m surprised that any of the following links below are still active. Well, who’s looking at this stuff anyway? Certainly, not the general public:
After reading several of these reports in 2009 and later, it did not take long for me to set the plan in motion to cash out … completely. I took the 10% penalty, while it’s still 10% and liquidated my accounts.
The rest of the population? Not so much.
I think it was Prechter who laid out just how easy it is for the government to seize IRA accounts. It’s basically a two step process.
Step 1. The market drops 50% to 70%. Remember, the drop from 2007 to the bottom in 2009 was 58%.
Step 2. Declare a state of emergency (executive order) for the working population and move in to “save” the IRA accounts from more devastation. The result would involve a stiff withdrawal penalty (say 50%) and to “protect” the accounts from further losses, IRAs can only invest in U.S. Treasuries or Bonds.
It’s that easy.
As stated previously, wealth does not necessarily mean gold and silver. That too can (and has been in the past) be confiscated.
In fact, I and my firm are already operating as if the next crisis is in full swing and asset confiscation is the norm. That way, we don’t have to come up to speed quickly in what may be an extreme stress situation.
End Report
One could propose that (IRA) legislation is already written.
Just like the CARES Act was already written and submitted to committee in January of 2019, nine months before there was any kind of outbreak.
Note: Posts on this site are for education purposes only. They provide one firm’s insight on the markets. Not investment advice. See additional disclaimer here.
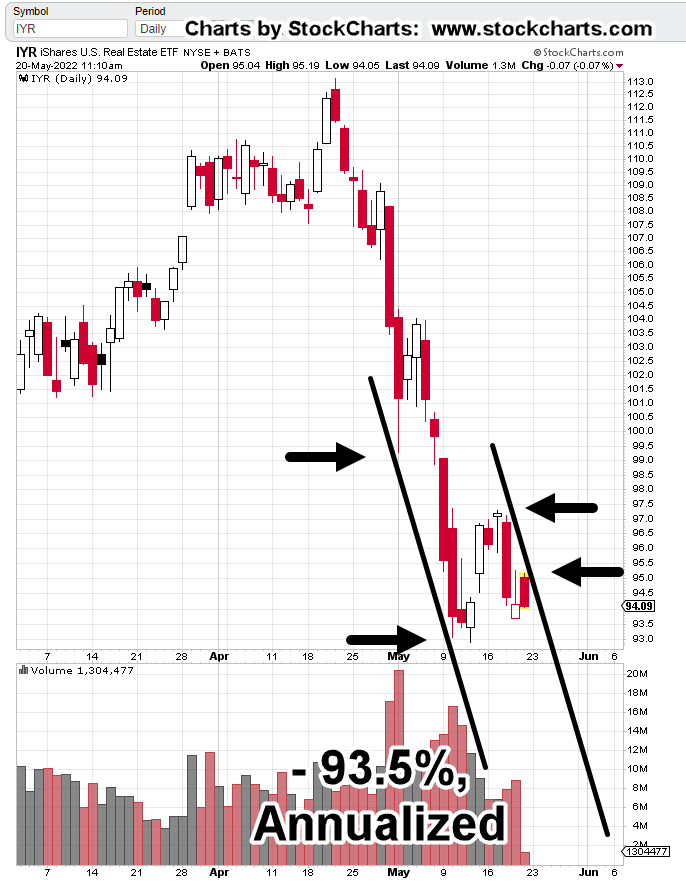
Does it really matter if IYR’s channel is at -99%, or -93.5%?
The sector’s going down fast; that’s the important part.
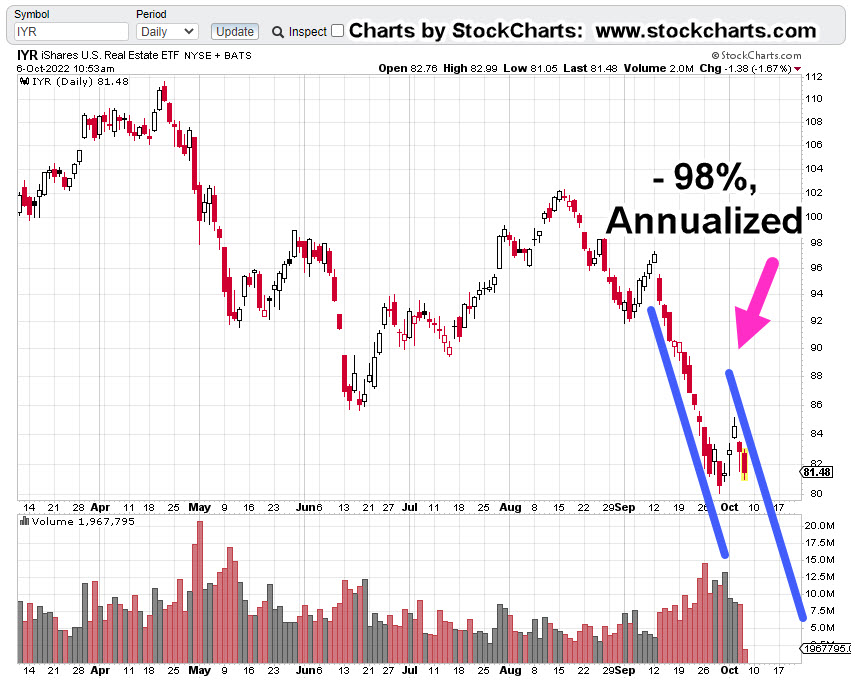
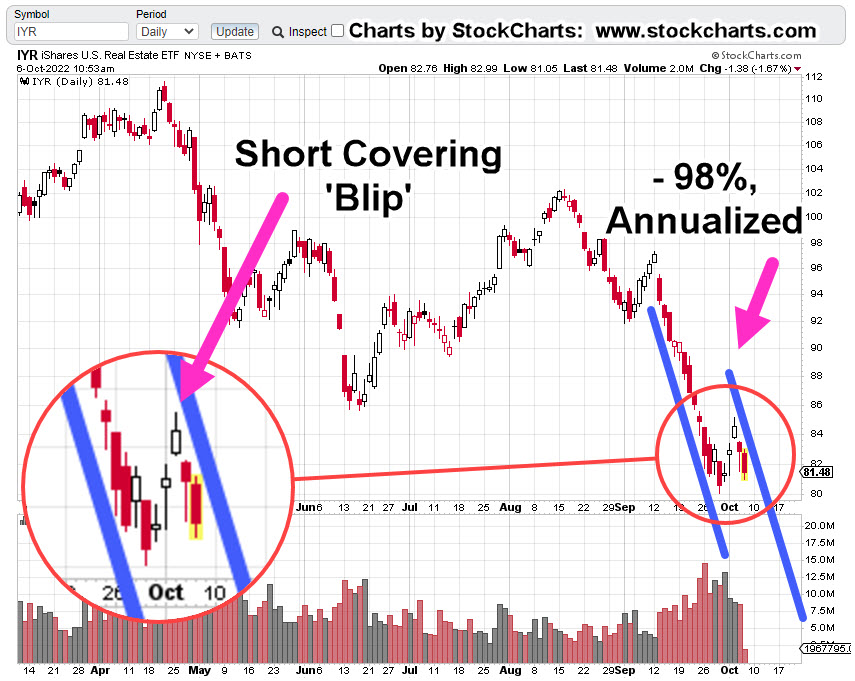
Unless there’s some kind of decisive, high-volume break to the upside, we’ve got IYR in a confirmed trading channel, declining at approximately – 93.5%, on an annualized basis.
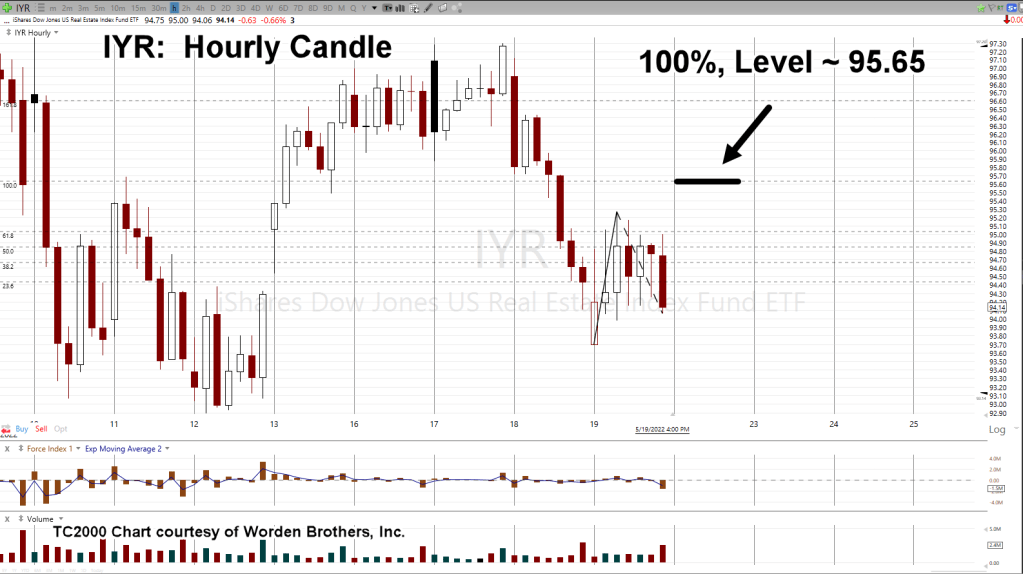
The morning gap open in IYR, was higher as expected; sated in the pre-market report.
However, instead of reaching the 100%, ‘a-b-c’ target, where wave ‘a’ would be equal to wave ‘c’ (a common occurrence), the gap higher only reached a 61.8% target: indicating significant weakness.
The daily chart, has the situation as of 11:30 a.m., EST
Real Estate IYR, Daily
One thing that’s not happened yet … there is no new daily low for IYR.
It has not posted below yesterday’s low of 93.70.
That’s about the only factor that remains as potential upside for the sector.
If yesterday’s low is penetrated, then it weights probability significantly to the downside (not advice, not a recommendation).
Note: Posts on this site are for education purposes only. They provide one firm’s insight on the markets. Not investment advice. See additional disclaimer here.
Note: Posts on this site are for education purposes only. They provide one firm’s insight on the markets. Not investment advice. See additional disclaimer here.