Downside Kick-Off … and, Biotech

Biotech, And The Next ‘Event’

Now, it all makes sense.

The solstice was yesterday.

Hard reversal in the market, today.

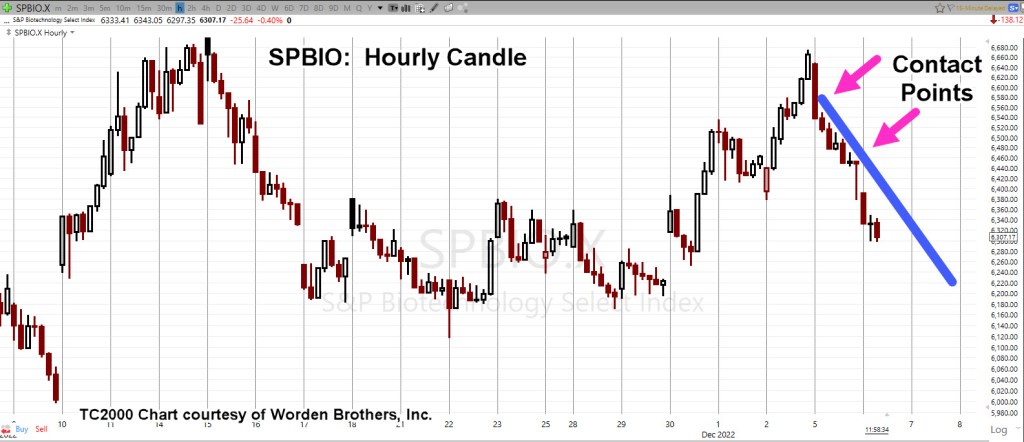
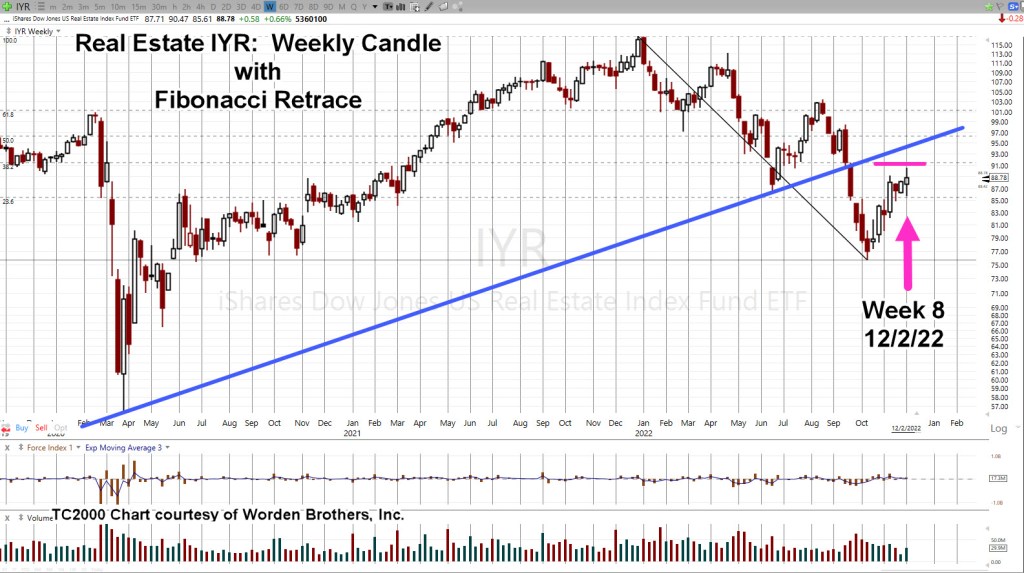
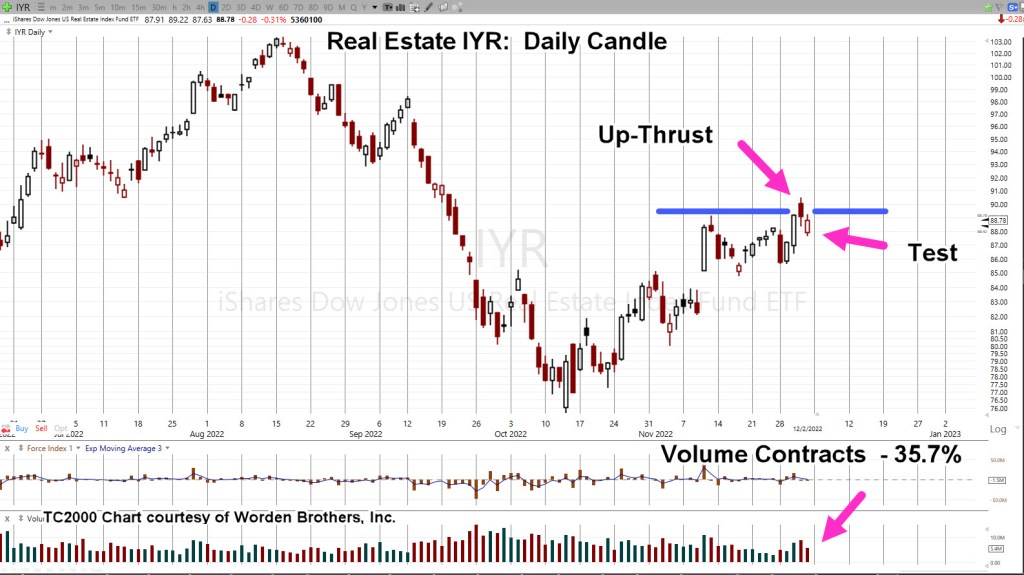
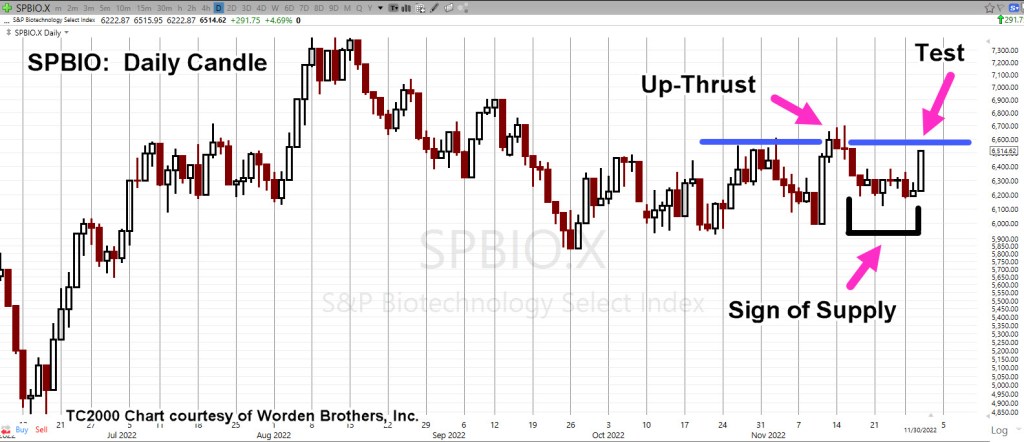
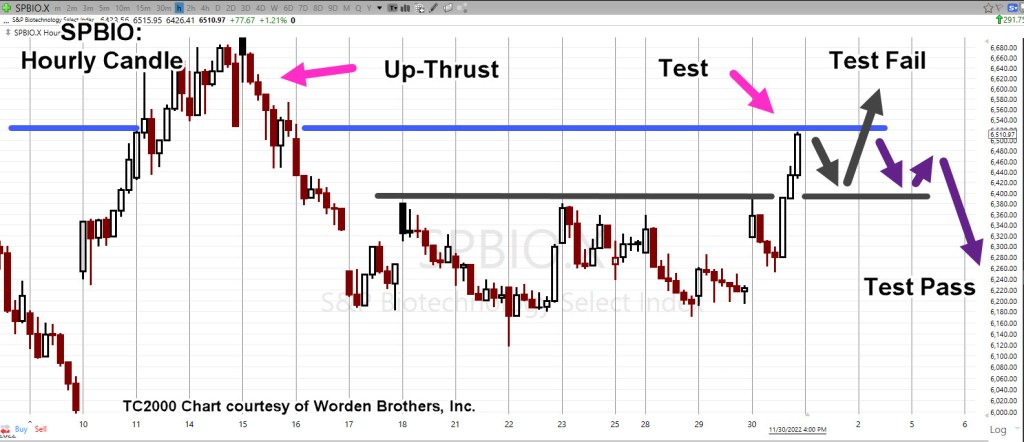
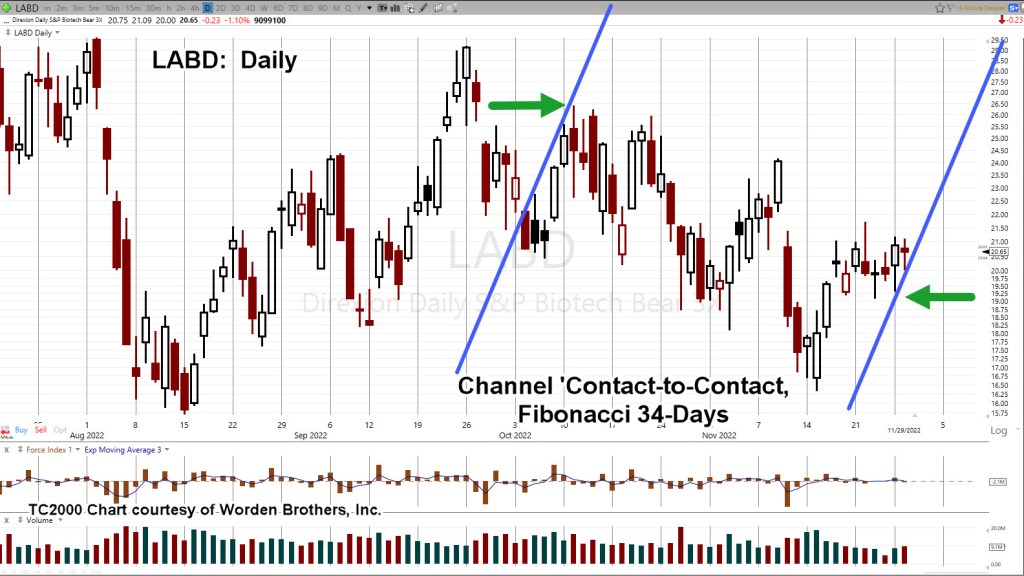
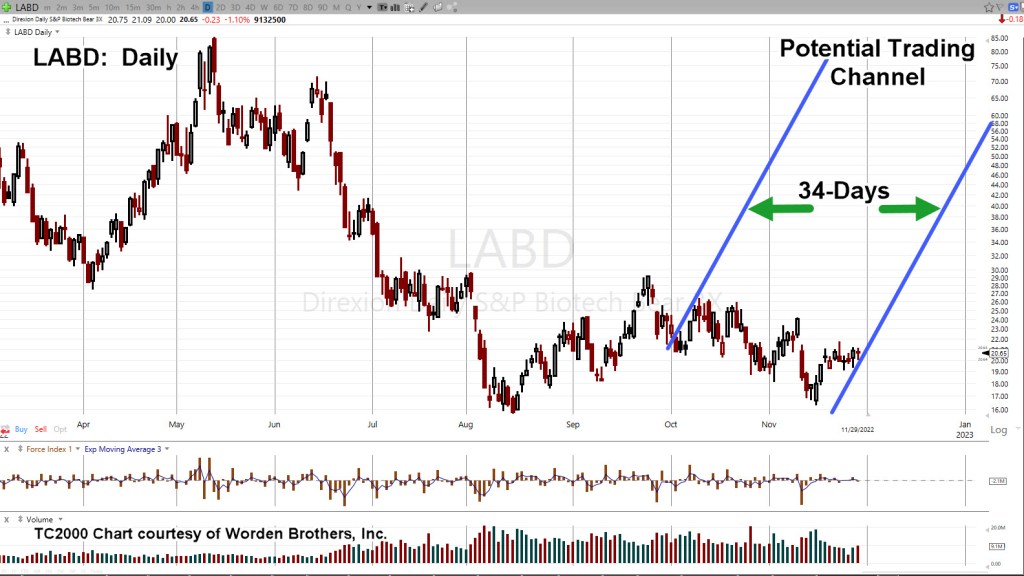
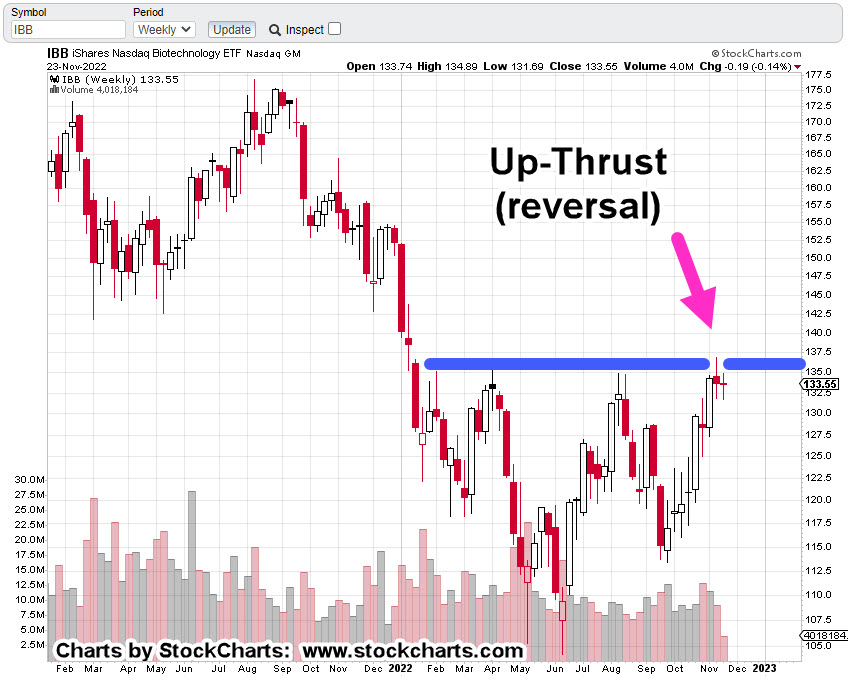
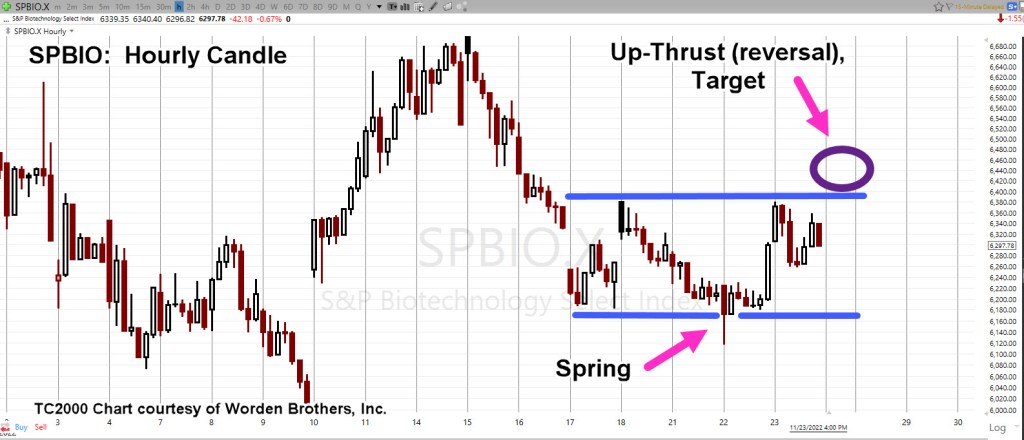
Then, there’s biotech; stubbornly refusing to break down.

First, Some Housekeeping

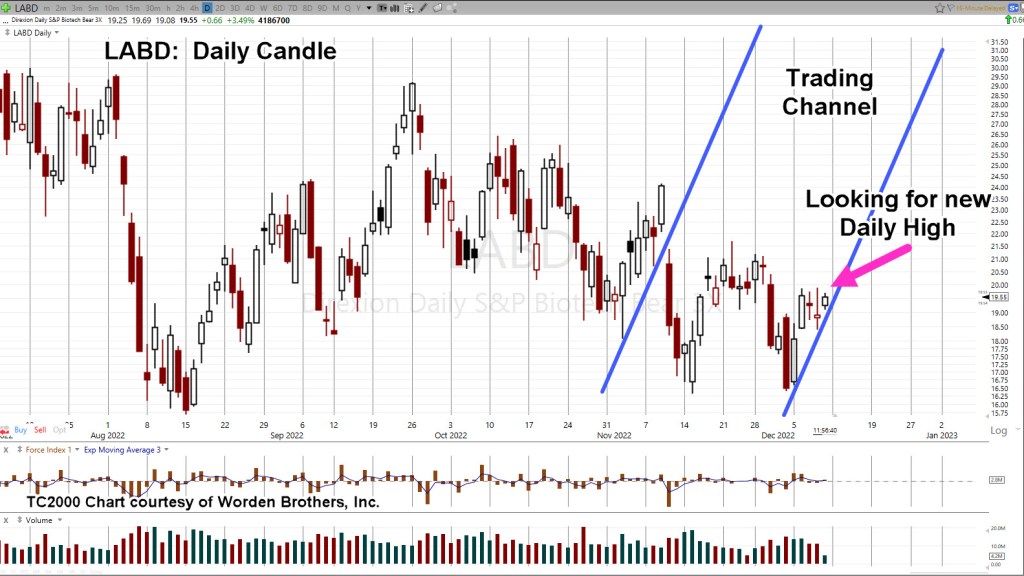
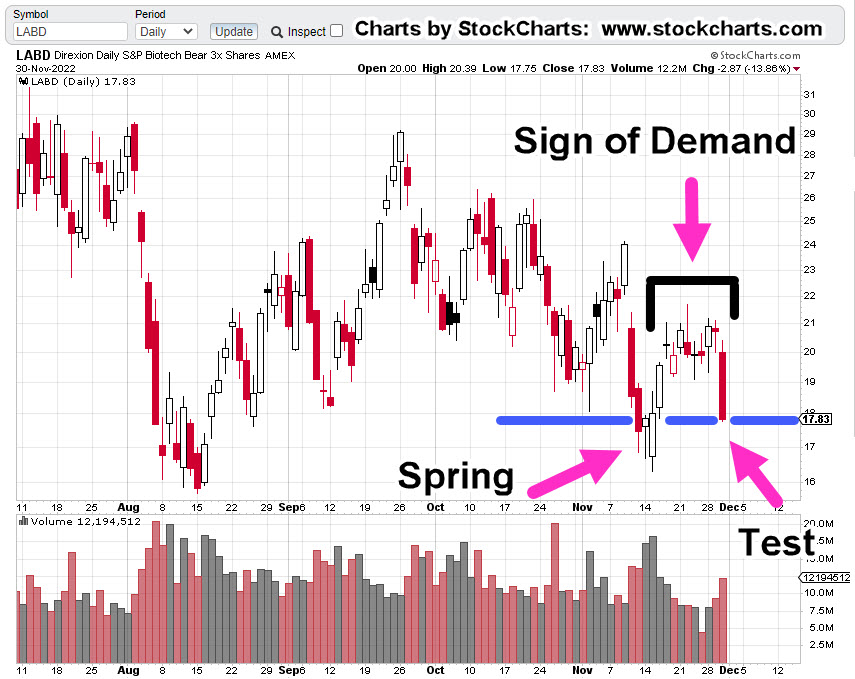
Before we go any further, from a housekeeping standpoint, all biotech short positions have been closed (not advice, not a recommendation).

Each apparent downside breakout attempt for the past three months, has been thwarted. There is something else going on.

Possible reasons for biotech’s resilience can be found here, and here and here.

Hint: There’s another planned ‘event’, on the way.

Now, back to the markets.

All major indices are sharply lower but for this update, we’ll focus on the Small Caps (Russell).

Russell 2000 IWM, Daily

Instead of starting with the big picture and longer timeframes, we’ll get straight into why today’s action may be significant.

Yesterday, price action attempted to ‘spring’ off the support boundary. Today, that spring has apparently failed.

Failed moves bring out the other side in force; in this case, the bears as it’s obvious the opposing side, the bulls, are exhausted.

It’s getting late in the session (2:50 p.m., EST) and the expectation is for a lower close.

If this really is the kick-off to the downside, then we’ll expect some kind of follow through at the next session.

Stay Tuned

Charts by StockCharts

Note:  Posts on this site are for education purposes only.  They provide one firm’s insight on the markets.  Not investment advice.  See additional disclaimer here.

The Danger Point®, trade mark: No. 6,505,279

Gold … Now, Comes Deflation

The ‘Pivot’, No One Expects

Happy days are here, again!

So, the Fed can pivot, and the bull’s on again.

At least, that’s what the media wants us to believe. The CPI is out, and ‘inflation’ has slowed.

The problem is, as Michael Cowan stated in this update (he’s done the work), from here, it does not matter what the Fed does.

The decline (crash) or whatever you want to call it, is baked in the cake.

Once deflationary forces start, it becomes a juggernaut.

The previous update on gold (GLD) showed in multiple time frames, upward thrust energy is dissipating; in at least one case, (weekly) it’s also divergent.

Now that we’ve had yet another blip higher, as expected, it’s rabid bullishness in the gold camp.

So, let’s look at what GLD, is actually doing. What does the market say about itself?

Gold (GLD), Daily

One thing is for sure; GLD, is at The Danger Point®

If GLD can’t hold above (and move above) this level, it may be in serious trouble.

Let’s look at it a different way … the terminating wedge.

A ‘wedge’ is typically the last pattern in a move up or down, hence the name.

As this post is being created (12:23 p.m., EST), GLD continues to decline from its open; currently sitting right at the resistance (potential support) level at the 168-area.

In a separate market, biotech SPBIO, has completely reversed its opening spike and is now posting lower.

We’re still maintaining the LABD-22-14 trade (not advice, not a recommendation).

Today’s CPI print and resulting price action, may be the kick-off to an overall sustained and persistent decline.

Stay Tuned

Charts by StockCharts

Note:  Posts on this site are for education purposes only.  They provide one firm’s insight on the markets.  Not investment advice.  See additional disclaimer here.

The Danger Point®, trade mark: No. 6,505,279

Biotech … Breakdown, Imminent

Waiting For A New Daily Low

Price action leads the news.

As with the Carvana analysis, a year ago which said CVNA, would likely not survive, so too it would appear, biotech is about to join the ranks.

Join the ranks but for different reasons.

Price action leading the news was a concept presented decades ago by Robert Prechter Jr., as part of his Elliott Wave Theory.

His view was the market indicates ‘social mood’; in that case, the market must go down first, before the bad news comes out.

In effect, the public has to be ready and actually want bad news and/or be ready for unexpected, cataclysmic events.

It’s the complete opposite of the accepted mantra, from financial advisors and media alike.

The bear flag in biotech SPBIO, has been forming now for three months. In the history of this sector, there’s never been anything like it.

The last update said there’s been a change in the character of price action; that SPBIO, is heading lower and about to threaten the bottom of the flag.

As we’ll see from the daily chart, indeed we’re getting close.

At this point, there’s no apparent demand for the upside.

Biotech SPBIO, Daily

The change in character is clear. We’re pulling away from the top of the flag and now, hovering at the lows.

Switching gears and going to the 3X leveraged inverse fund LABD, on the daily basis, we see repeating trend lines.

SPBIO, 3X Leveraged Inverse LABD, Daily

As the magenta arrow shows, we’re looking for a new daily high in LABD, to confirm the trendline; that high would naturally correspond to a new daily low in SPBIO.

As of this post (1:02 p.m., EST) neither one has occurred.

Summary

Even as the overall markets are mixed to slightly higher, SPBIO, is posting down – 1.51%; a possible indication it may lead to the downside.

Just exactly what ‘news’ is about to come out is unknown.

However, at this juncture with action pressing lower, it appears, the market is ready.

Positioning

Not advice, not a recommendation.

LABD-22-14

Entry@ 18.905, 18.95*** Stop @ 18.36***

Note: Positions may be increased, decreased, entered, or exited at any time.

***, Indicates change

Stay Tuned

Charts by StockCharts

Note:  Posts on this site are for education purposes only.  They provide one firm’s insight on the markets.  Not investment advice.  See additional disclaimer here.

The Danger Point®, trade mark: No. 6,505,279

Biotech … Bear Flag, Break ?

The Character Has Changed

It’s been more than frustrating attempting to short biotech.

So far this year there’ve been thirteen attempts; some successful, but most were not.

None of the attempts have captured the ‘big move’ that’s overdue for this market.

The last post essentially gave up on biotech, but it seems like the potential just won’t go away.

This time, over the past two days, the character of price action has changed.

Re-capping briefly, biotech SPBIO, has been in a bear flag for over two months.

During that time, it’s been oscillating and coiling; looking for a breakout to the downside.

As of this post, there’s no breakout yet but we’re heading to the bottom of the flag, with a change of character.

SPBIO, Weekly

It’s important to note, the pattern below, is unique.

The sector data goes way back to April of 2009. During its trading history SPBIO, has never posted a bear flag with a two-plus month duration.

An expanded version of the chart is below:

Now, comes the interesting part.

Going to the hourly, we have a trend line and a breakdown of intermediate support in the SPBIO 6,390-area.

This is the change of character.

SPBIO, Hourly

Note that we’re deep within the bear flag and at the right edge of price action.

We’ve got the trendline as shown.

Price action during yesterday’s session, contacted that line six consecutive times.

As of this post (12:50 p.m., EST), price continues lower.

Summary

So, is this ‘the big one’?

The correct answer is that it’s unknown.

What we do know however, just by looking at what the market is saying about itself; there’s been a change, at least in the past two days.

Price action’s breaking through support levels and heading for the bear flag lows in the vicinity of SPBIO 6,125.

A reasonable expectation is for some kind of a bounce if or when it hits this area.

Positioning

Not advice, not a recommendation.

DRV-22-06: Closed***

Gain + 5.61%

Re-opened biotech SPBIO Short (not advice, not a recommendation)

LABD-22-14***

Entry@ 18.905*** Stop @ 18.39***

Note: Positions may be increased, decreased, entered, or exited at any time.

***, Indicates change

Stay Tuned

Charts by StockCharts

Note:  Posts on this site are for education purposes only.  They provide one firm’s insight on the markets.  Not investment advice.  See additional disclaimer here.

The Danger Point®, trade mark: No. 6,505,279

The Set-Up … Goldman, ‘Gives Up’

Right At The Pivot

That’s the way it looks at this point as we’ll see below.

The ZeroHedge article in question, is linked here.

You can see, it starts off (before being grey-ed out) with referencing the Non-Farm Payrolls report; a report, that another article calls ‘rigged’. So, there’s that.

With each passing day, it’s ever more apparent, price action itself, is telling us the most probable market direction.

Just to prove the point, Blackstone’s sending out a ‘talking points‘ memo to keep clients calm and help ‘guide the conversation’ … i.e., ‘thought shaping’.

Thoughts ‘shaped’ or take action.

For this update, we’re taking action; looking at what the real estate market is telling us.

Real Estate IYR, Weekly

Let’s go back to the IYR, update from late October.

It showed the most probable direction; a move higher into a test, giving both the location, and the date.

Fast forward, to now:

We’re right at 38.2%, retrace and on time with Fibonacci Week-8, from the lows.

The daily chart shows a possible up-thrust (reversal) and test … the very same day that Goldman ‘gives-up’.

Real Estate IYR, Daily

Not shown on the daily; from the lows, October 13th, to the (print) high, December 1st, is a Fibonacci 34 (+1) Days.

Volume increased on the reversal bar December 1st, and then contracted on the upward test the next day … pointing probabilities to the downside.

Printing a new daily low at the next session, will help confirm the reversal.

Summary

Let’s see what happens next.

The Goldman report may be contrary indicator; telling us the ‘professionals’ are throwing in the towel, changing their approach right at a potential top.

Positioning

Not advice, not a recommendation.

LABD-22-13: Closed

It’s become apparent from this article; the truth, that was counted on as a tail-wind (for a short position) is not going to come out anytime soon.

Those that know, already know.

Moving on to other markets (below) that will be affected by the consequences of biotech.

DRV-22-06:

Short real estate IYR, via DRV (not advice, not recommendation)

Entry @ 48.39***: Soft Stop @ 47.53***, Hard Stop @ 45.11***

Note: Positions may be increased, decreased, entered, or exited at any time.

***, Indicates change

Stay Tuned

Charts by StockCharts

Note:  Posts on this site are for education purposes only.  They provide one firm’s insight on the markets.  Not investment advice.  See additional disclaimer here.

The Danger Point®, trade mark: No. 6,505,279

Biotech Forecast … Pivot or Not

Multiple Scenarios, Going Forward

The ability to see multiple scenarios is like a Rorschach Test.

With each additional tick on the chart, it takes on a different character.

So, let’s look at what’s most likely, based on where we are now with one of, if not the weakest sectors; biotech SPBIO.

For reference, we’ll start with the big picture … the weekly chart to show the two-month long, bear flag.

Biotech SPBIO, Weekly

Next, is the daily for the past several months.

We’re at The Danger Point®; the test, where there’s not much distance between pass and fail.

Price action can (easily) go either way.

SPBIO, Daily

However, from a probability standpoint, we’ve been in a bear flag for months; the expectation is the test will pass, price action reverses and we get a downside breakout.

The hourly chart has the most likely potential outcome.

Pre-market action shows flat (as of 9:08 a.m., EST).

SPBIO, Hourly

The chart has two likely scenarios: one pass, one fail.

A less likely outcome is a straight up launch above resistance.

However, anything can happen.

Summary

With the Fed out talking hawkish again, we’ll say it again; there is no ‘pivot’.

Whether or not the press is intentionally miss-directing the narrative, in a sense, does not matter.

We’re looking at the price action.

Right now, it says, we’re at a dangerous spot and may be about to pivot (pun intended) to the downside.

Positioning

Not advice, not a recommendation.

No change since yesterday.

Short position in SPBIO via LABD; details are as follows:

LABD-22-13:

Entry @ 18.72: Stop @ TBD

Note: Positions may be increased, decreased, entered, or exited at any time.

***, Indicates change

Stay Tuned

Charts by StockCharts

Note:  Posts on this site are for education purposes only.  They provide one firm’s insight on the markets.  Not investment advice.  See additional disclaimer here.

The Danger Point®, trade mark: No. 6,505,279

Can It Get Any More Dangerous ?

Testing The Reversals

First, some housekeeping.

This morning’s action in biotech SPBIO, forced exit of LABD-22-12, with a minimal loss of -0.12% (not advice, not a recommendation)

There was a bounce off SPBIO, resistance in the early session and then, it became clear the market was setting up to penetrate that resistance.

As the Fed announcement progressed, SPBIO, indeed moved up sharply.

Reversal Set-Up

By definition, such action puts SPBIO, in a test of a prior Up-Thrust (reversal) from 11/11/22 – 11/15/22.

Conversely, it puts the leveraged inverse fund LABD, in a test of a Spring set-up during the same period.

You can already see where this is going.

The work has been done on a fundamental basis as well as technical; biotech is set for significant downside.

Whether or not, we’re at that inflection point right now, is unknown.

Biotech 3X Leveraged Inverse LABD, Daily

Looking at the mark-up below, we’ve had a spring set-up; then, sign of demand with action moving higher and finally today, a test of that spring set-up.

David Weis used to call such drastic moves a ‘gut-check’, to see if you can hang on (not advice, not a recommendation).

Price action has come right back to support with a wide bar and high volume.

Such bars increase the probability of a counter move to test which in this case, is a move higher.

Summary

Remember, all this action’s occurring ‘within’, the SPBIO, bear flag that’s formed over two-plus months.

It seems like a huge understatement to say this market and the main indices, are in a dangerous position.

Positioning

Not advice, not a recommendation.

Like a Terrier on a Mailman’s leg, we’re not giving up on biotech’s potential downside … at least not yet.

Short position in SPBIO via LABD; details are as follows:

LABD-22-13***:

Entry @ 18.72***: Stop @ TBD***

Note: Positions may be increased, decreased, entered, or exited at any time.

***, Indicates change

Stay Tuned

Charts by StockCharts

Note:  Posts on this site are for education purposes only.  They provide one firm’s insight on the markets.  Not investment advice.  See additional disclaimer here.

The Danger Point®, trade mark: No. 6,505,279

Pandora & Twitter, The Box Opens

Fuel, For The Downside

With Twitter’s lifting of the ban on truth, linked here, we may be entering the next phase of collapse.

Whether or not it’s going to immediately show up in market price action, is unknown at this point.

Nascent Reversal?

The last update identified the markets were poised for potential reversal.

Two days later and we’re mostly down; that’s in spite of the supposed positive ‘machine’ bias as presented at this link.

A positive machine-market could still happen (data released tomorrow) but for now, price action itself, is posting lower; this is the crux of Wyckoff analysis … ‘What is the market saying about itself’.

In line with the truth being let out, not surprisingly, chief cook and bottle washer, biotech, is having a rough time.

Biotech Bear Market

Prior posts have documented the bear flag that’s been forming for over nine-weeks. Now, we have an apparent coiled action, ready for the downside.

Since we’re short this sector via LABD (not advice, not a recommendation), we’re going to look at LABD, to identify the potential.

SPBIO, 3X Leveraged Inverse, LABD

We have three charts, all depicting daily action.

The first (un-marked) chart is close-in and it looks like a mess. That is, until you put in trend lines and a Fibonacci count as shown on the second chart.

Adding the mark-up.

Then, keeping those trend lines intact, pulling farther out, we see the potential if there’s a sustained move.

Price action has been trading in a tight range over the past eight-days. Let’s see what happens next.

Positioning

Not advice, not a recommendation.

Short position in SPBIO via LABD; details are as follows:

LABD-22-12:

Entry @ 19.9194, 20.91***: Stop @ 19.28***

Note: Positions may be increased, decreased, entered, or exited at any time.

***, Indicates change

Stay Tuned

Charts by StockCharts

Note:  Posts on this site are for education purposes only.  They provide one firm’s insight on the markets.  Not investment advice.  See additional disclaimer here.

The Danger Point®, trade mark: No. 6,505,279

Bond Market, Signals Trouble

It’s Not About The Fed

The potential for a sustainable bond reversal was identified way back in mid-October.

Now, over a month later with bonds moving decisively higher, the ‘narratives‘ are out in force.

Those narratives revolve around ‘pivot me this, or ‘pivot me that‘, or an infinite number of the same variations.

The reality is, there’s not going to be any ‘pivot’.

Even if there was, as Michael Cowan reported weeks ago, the market keeps crashing anyway (not advice, not a recommendation).

With that in mind, a popular narrative is that bonds are higher because the Fed will lower rates when they see we’re in a ‘recession’.

Well, they won’t ever see a recession because we’ve skipped that part; going straight to collapse and economic depression. 🙂

Of course, as Jerimiah Babe puts it, Americans won’t do a thing to get ready until the last minute … most likely after the market is down 50%, or more.

Instead of the placating, proletariat calming narrative, it’s a recession; maybe bonds are moving in response to those in the know … something much worse may be ahead.

Could bonds be signaling, we’re close to a market rout?

Bonds, TLT, Weekly

We’re going to start with the original analysis, showing the potential for a sustained reversal.

From the October 16th, post.

A month or so, later.

As with the dollar analysis from years ago, a weekly bullish divergence as we see here, may result in a rally that lasts longer and goes farther than anyone expects.

Of course, the real question is ‘what does it mean?’

As Wyckoff said over a century ago, we won’t know the full reason for a move until it’s over.

One view of it however, different from the accepted narrative, we could be headed for some kind of disconnect; those in the know are shifting to ‘relative’ stability.

Moving on to other markets, we have the following:

Positioning

Not advice, not a recommendation.

The push higher in biotech SPBIO, discussed in the prior update did not materialize.

Instead, we got a new daily low, followed by some upward testing action.

A day-trade in LABD was opened and closed; then near the market close, opened again.

Details are as follows

LABD-22-12:

Entry @ 19.9134***: Stop @ 19.10***

Note: Positions may be increased, decreased, entered, or exited at any time.

***, Indicates change

Stay Tuned

Charts by StockCharts

Note:  Posts on this site are for education purposes only.  They provide one firm’s insight on the markets.  Not investment advice.  See additional disclaimer here.

The Danger Point®, trade mark: No. 6,505,279

Set For ‘Implosion’ … Biotech

IBB & SPBIO, at The Danger Point®

Each one in their own way, as we’ll see below.

From a Wyckoff standpoint, we’ve identified one of, if not the sector(s) most likely to decline the farthest and fastest in a bear market.

Without question, biotech contains the overriding ‘elephant’ that’s literally affecting everything else on the planet (not advice, not a recommendation).

As stated in the tag-line above, the two indices in question are IBB (large cap) and SPBIO (small cap).

IBB, has Amgen, Gilead and Vertex, as the top three while SPBIO, has more speculative (i.e., losing more money) Beam, Twist and Fate.

Index IBB has $342.8-Bil, combined for the top three while SPBIO has only $6.5-Bil, combined.

So, it makes sense the more speculative ‘cash burning inferno‘ TWST, is in the SPBIO. 🙂

On to the charts

IBB Weekly

IBB has formed a decisive resistance area as shown.

The fourth attempt which pushed above the prior three levels (and retraced), puts IBB, at The Danger Point®

Next up is the SPBIO.

It’s much weaker and thus the focus for any short opportunities (not advice, not a recommendation).

SPBIO ($SPSIBI), Weekly

While IBB, has moved higher, to an up-thrust over the past nine weeks, SPBIO during that time, has languished.

Note: The chart scales are identical. Scrolling up and down, one can visually see the weakness of SPBIO.

SPBIO, also reached all-time highs, six months before IBB.

Getting Closer-In: SPBIO

We’re going to look at the hourly chart.

SPBIO, Hourly

Those who are long-time visitors to this site will instantly recognize the set-up: ‘Spring-to-Up-Thrust

This Friday, tomorrow, is a shortened trading day.

There’s a potential we’ll have a small blip higher into the up-thrust zone.

Conversely, for 3X Leveraged Inverse Fund LABD, the potential is for a temporary move lower.

Leveraged Inverse LABD, Hourly

This is how it looks for LABD.

Note for the inverse fund, the ‘spring’ on SPBIO, becomes the ‘up-thrust’ on LABD.

Positioning

Not advice, not a recommendation

Wednesday’s downside action in LABD, resulted in the LABD-22-10, position being stopped out with an overall gain around 7.12%.

There have already been several disruptions to the company’s trading platform and data line over the past month and we’ve not even got started with market chaos.

Recall that just recently, the Canadian market went off-line for several hours. We should consider these events the ‘norm’, on a go-forward basis.

As a result, a standing order (in the market) is in place to go long LABD (short SPBIO) at the execution price of LABD @ 18.62.

That order may or may not be modified as we go into the open tomorrow morning.

Stay Tuned

Charts by StockCharts

Note:  Posts on this site are for education purposes only.  They provide one firm’s insight on the markets.  Not investment advice.  See additional disclaimer here.

The Danger Point®, trade mark: No. 6,505,279