There was a larger than expected crude inventory build, as ‘the consumer is weaker than expected’.
The ‘consumer’ is not weaker than expected, they’re tapped out.
There’s real potential, events accelerate from here.
The reversal in the sector, XOP, was anticipated to happen on Friday, tomorrow.
At this point, it looks like it came early.
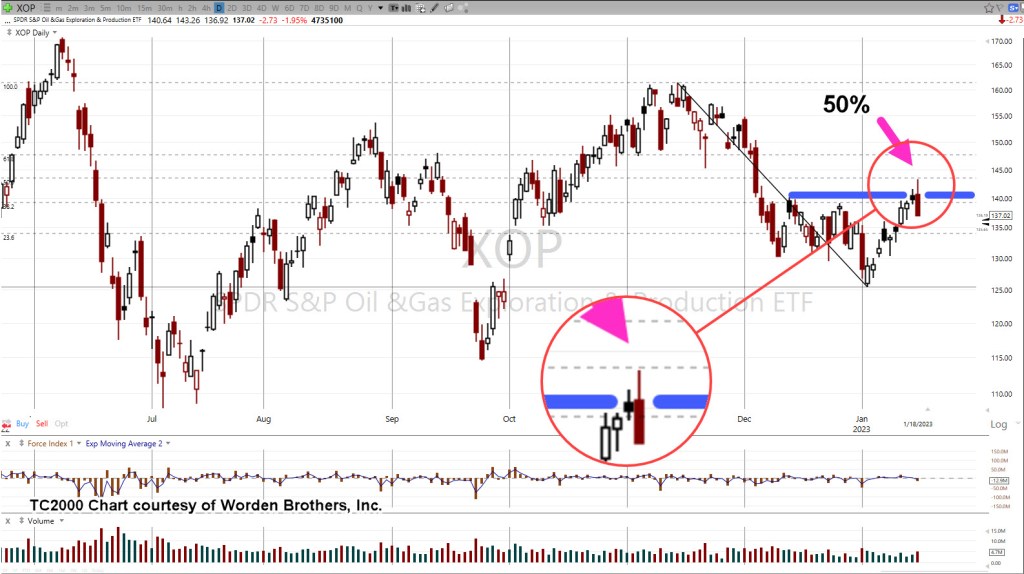
The daily chart of XOP, below shows a reversal at the Fibonacci 50%, retrace.
Oil & Gas XOP, Daily
The next chart zooms-in on the reversal.
We’re about fifteen-minutes before the regular session and set to open lower.
Look for the market to print lower, then attempt a rally as a test of the reversal.
That retrace, if it occurs, may be a low-risk area for a short via DRIP (not advice, not a recommendation).
If the anticipated test fails, and price action makes a new daily high (above yesterday’s print), it’s then likely the sector is on its way to all-time highs.
Note: Posts on this site are for education purposes only. They provide one firm’s insight on the markets. Not investment advice. See additional disclaimer here.
There was no Oil & Gas, XOP breakout, last Friday.
What did happen as shown on the chart below, was a test of resistance.
The market can certainly reverse from here. If so, it would be called a ‘double top’.
Those types of reversals are common; but from a trading perspective, that’s not what we are looking for (not advice, not a recommendation).
We’re looking for ‘trapped money’.
That means, as many market participants on the wrong side of the trade as possible so they are the ones that provide fuel for the downside.
Marsha … Marsha … Marsha
Just like The Brady Bunch and its chant of ‘Marsha’ … ‘Marsha’ … ‘Marsha’ … we have the public being led into a similar mantra; ‘Inflation’ … ‘Inflation’ … ‘Inflation’.
With that kind of single mindedness, who’s even looking for a downside reversal?
That does not mean a reversal is imminent … it just means the public is not looking for one; in itself, a requirement.
On to the charts
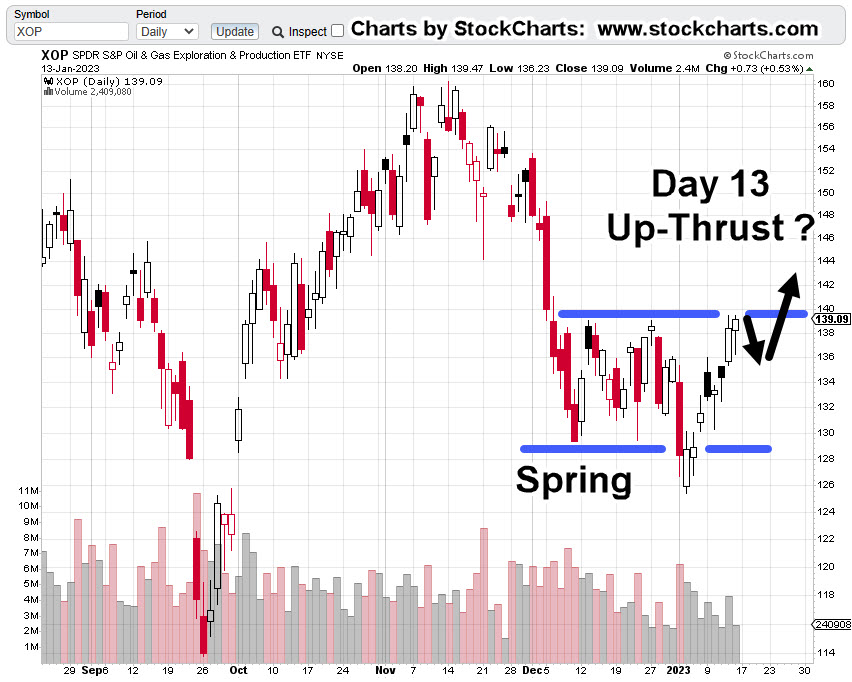
Oil & Gas XOP, Daily
We’ll re-post the original chart to show how price action has progressed.
This past Friday marked Fibonacci Day 8.
The next chart is how action looks now.
Included, is a forecast (not advice, not a recommendation) of where and how price action may proceed.
If it’s a double-top, we may have already reversed.
If not, Fibonacci Day 13, might be this coming Friday or next Monday.
It could be as early as Friday (actually, 12-days of price action) based on work done years ago.
That is, when an American Holiday occurs while the rest of the world’s markets remain open, that day of closed markets can (sometimes) effectively count as an actual trading day.
So, it’s this coming Friday, or Monday-next, that may be a set-up for reversal.
Note: Posts on this site are for education purposes only. They provide one firm’s insight on the markets. Not investment advice. See additional disclaimer here.
When Oil & Gas Sector XOP, pushed above last week’s high, it negated the breakdown scenario.
At the same time, it opened another potential opportunity that may set-up this coming Friday … The 13th.
We’ve shown over and again, markets tend to exhibit repeating patterns. Things like trading ranges, terminating wedges, breakouts and breakdowns, are not new.
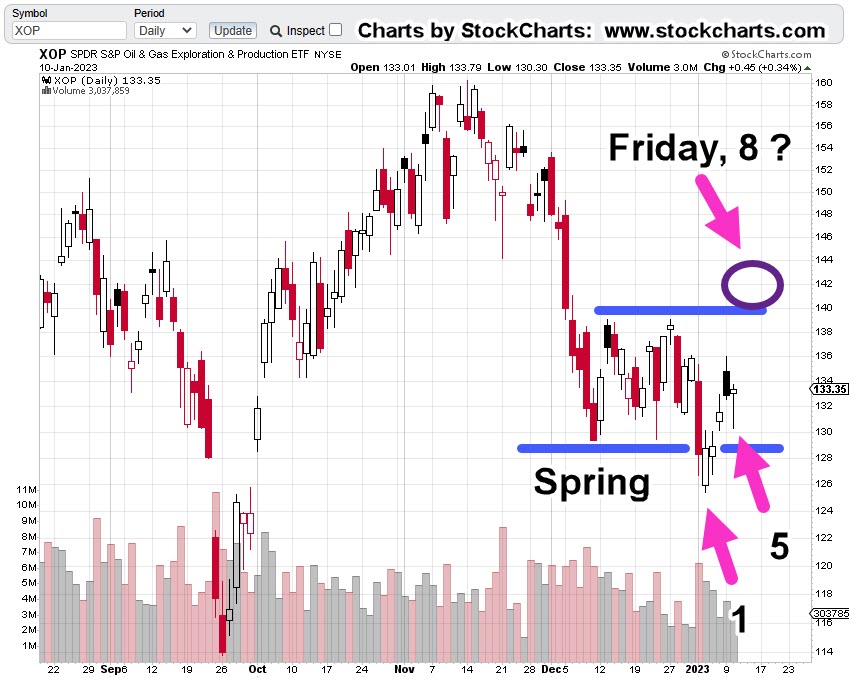
However, there’s a lesser-known characteristic; the tendency for a market to go straight from a Wyckoff ‘spring’, into an ‘up-thrust’.
Currently, we’re about mid-way into the set-up as shown on the daily chart of XOP.
Oil & Gas XOP, Daily
Price action pushed below support (the spring set-up) and is now mid-way into that spring; potentially going straight into an up-thrust.
There was a reversal pivot on Fibonacci Day 5 (yesterday), which opens up the possibility of another time correlation at Fibonacci Day 8 … this coming Friday.
Before The Open
It’s about twenty-minutes before the regular open and XOP, is trading higher … further confirming we’re headed for a potential set-up and reversal (not advice, not a recommendation).
Note: Posts on this site are for education purposes only. They provide one firm’s insight on the markets. Not investment advice. See additional disclaimer here.
Since the lows last November, to the close this past Friday, gold (GLD) has moved higher by a decent but modest 15.4%.
Naturally, the opportunists are out telling us ‘We’ve been warned’, ‘this is it’, ‘it’s going to the moon’ … yet again.
With that backdrop, we’re going to look at the precious metals facts, not the hype.
‘Precious metals’ because there are only four that have ‘currency code’ classifications, i.e., are classified as an asset with ‘currency like’ monetary characteristics.
Way back over a century ago, Wyckoff discovered the key to understanding the next likely move of the markets was the study the market itself (not fundamentals).
Wyckoff essentially ‘locked himself in a room with just a stock ticker and phone line’.
That’s not saying ‘money printing’ has no effect. There are a lot of moving parts. Intentional destruction of the food supply is just one of those parts.
Old School Analysis
Hypothetically, if you dropped an ‘old-timer’ into the markets at this juncture (without him knowing the ‘hype’), and showed him all four charts of gold, silver, palladium, platinum, and asked ‘what’s happening?’
What’s his response?
After a brief look at the charts, he would likely say:
‘Gold’s move higher is not being confirmed by the other precious metals’.
Note that all four metals peaked together during the inflation spike of 1980.
Ergo: At this juncture, something’s wrong.
Either the other metals are going to ‘catch up’ to meet gold or gold is going to come down to meet the others.
That is of course, unless this time is different … somehow.
With that, we’ll look at the chart of gold to see what it’s saying about itself.
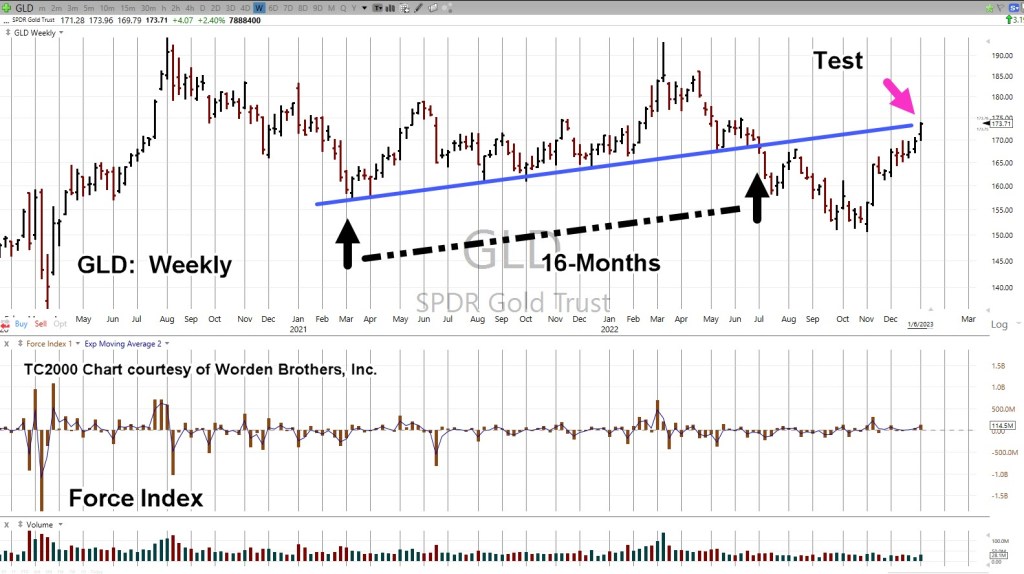
Gold GLD, Weekly
We’re starting with the unmarked chart.
Note: Elder’s Force Index scale is expanded to show the nuances of GLD, price action.
Next, we see we’re at a test of the trendline in place for 16-months before the downside breakout of July, last year.
Moving in closer, we have a wedge formation prior to the up-move last week.
Is this a breakout to the upside or a throw-over?
At this point, it’s unknown.
We can see that Force Index is below where price action entered the wedge during the week of November 11th.
Less force up into resistance (trendline), paints a slightly more bearish than bullish picture.
The ‘Why’ Comes Out
As if on cue and in classic Wyckoff style, we have a ‘why‘ for the move off the lows of last November.
Classic Wyckoff, because he said the ‘why’ of a move comes out after the fact.
There you have it; China buying gold last November and December.
During this move from the recent lows, it was certainly a trading opportunity for the bulls … but from a strategic standpoint, what happens next?
The Non-Confirmation
Non-confirmations can last a long time.
For example, the Oil & Gas sector XOP, declined for eight months, from April 2019 to January 2020, before the price of oil (USO) finally broke lower.
With the ZeroHedge article just released a few hours ago, we can expect at least a blip higher at the next GLD, open.
Note: Posts on this site are for education purposes only. They provide one firm’s insight on the markets. Not investment advice. See additional disclaimer here.
That was Jesse Livermore’s assessment of the market just before The Panic of 1907.
That Was, Then
Back then, it was money spent on The Boer War, tight financial conditions and extreme overvaluations.
Looks more and more, like today
It’s been this site’s opinion for about a year (now supported by data), that we’ve gone straight past recession, into economic collapse and depression.
And Now, This
Another data point confirming the ‘depression’ scenario is this, just out from ZeroHedge: The Baltic Dry Index had its largest one-day collapse on record.
As if to drive it home; demand is in free-fall as Amazon, just announced plans to fire 18,000 workers.
From a strategic standpoint, collapsing shipping demand means collapsing fuel demand.
Which brings us to the sector of the day, Oil & Gas
Oil & Gas Sector XOP, Weekly
The last update, showed the weekly chart has reversed down and stayed down.
XOP is penetrating support, now at The Danger Point®.
The daily chart has more detail; we’re hovering at support, testing the right side trendline (again).
Providing some (minor) upward bias for the day is this report on WTI (West Texas Intermediate).
Oil & Gas Sector XOP, Daily
It’s 1:31 p.m., EST and XOP, has not posted a new daily high (it’s very close).
Doing so, would weaken the downtrend case and point probabilities to a Wyckoff spring move higher.
Summary
Demand is rapidly collapsing on many fronts and the WTI report linked above uses the word ‘tepid’.
That may be completely inaccurate or misleading when considering the demand for shipping has seen its worst down-day, on record.
Note: Posts on this site are for education purposes only. They provide one firm’s insight on the markets. Not investment advice. See additional disclaimer here.
If we use the S&P as the proxy, it hardly even lasted that long.
Going back to just four days ago, we had this (emphasis added):
“It’s well known, stocks tend to rise in the first weeks of January. Tax loss selling is over and there’s typically some type of ‘relief’.
Don’t count on it this time (not advice, not a recommendation).”
Market Meets Expectations
It was expected on the first trading day of the year, the market would continue its downtrend.
After this morning’s 15-minute blip, that’s exactly what’s happening.
We’ve already discussed real estate IYR, (here, here and here) as well as the Q’s (here).
Now, there appears to be another sign of impending price collapse … the oil sector; specifically, Oil & Gas Index XOP.
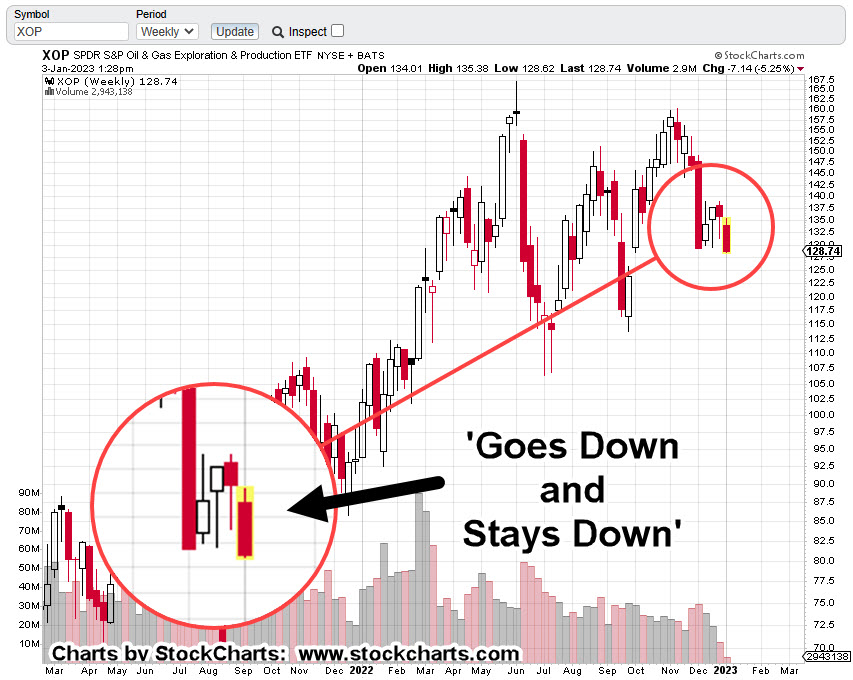
As is typical, we’ll begin the analysis with the longer time frame, the weekly.
Oil & Gas Sector XOP, Weekly
There’s no secret to the chart below other than Livermore’s admonition for going short; that is, he finds a market that ‘goes down and stays down’ (not advice, not a recommendation).
The prior two down-drafts were quickly retraced; one in mid-July last year and one in September.
Not so, this time.
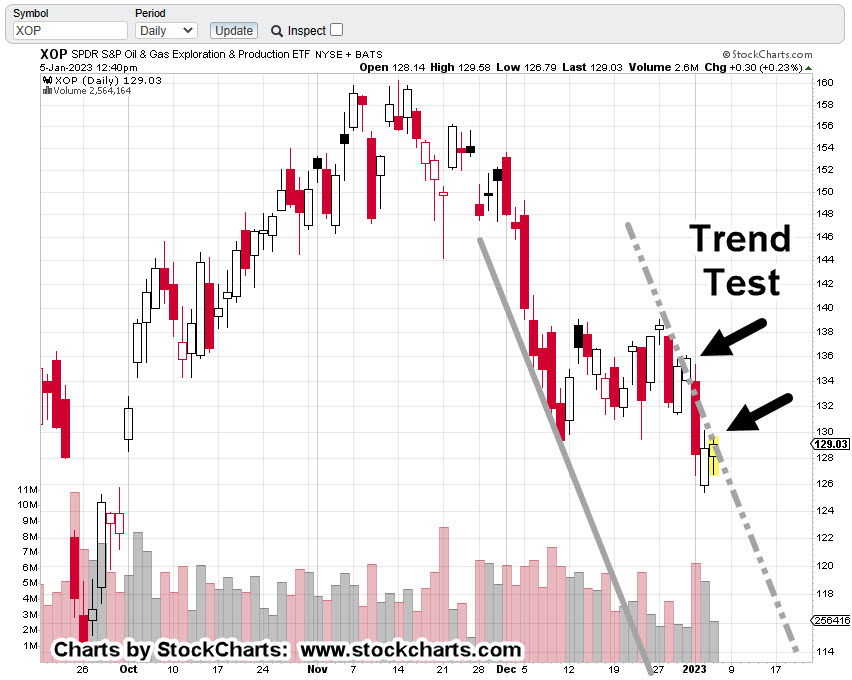
If we go to the daily, we have an ominous look where a downtrend could be validated.
Oil & Gas Sector XOP, Daily
The right-side trend is drawn as a dashed line, revealing the attempted breakout on the last two sessions in December.
Attempted trend line and channel breakouts are normal market behavior.
It’s clear in the case above, price action has quickly got itself back into the trading channel.
Summary
Of course, oil prices are not supposed to go down, right?
At this juncture, look at all the conflict and potential supply disruptions that are possible.
However, the price of oil and the price of the exploration/production equities are two separate things.
The price of oil could skyrocket further, and yet, the equites still collapse. Bear markets are all about price, wealth, and credit destruction.
Typical short positioning trade vehicles for this sector are DRIP (-2X) and DUG (-2X), or to short the XOP directly (not advice, not a recommendation).
Note: Posts on this site are for education purposes only. They provide one firm’s insight on the markets. Not investment advice. See additional disclaimer here.
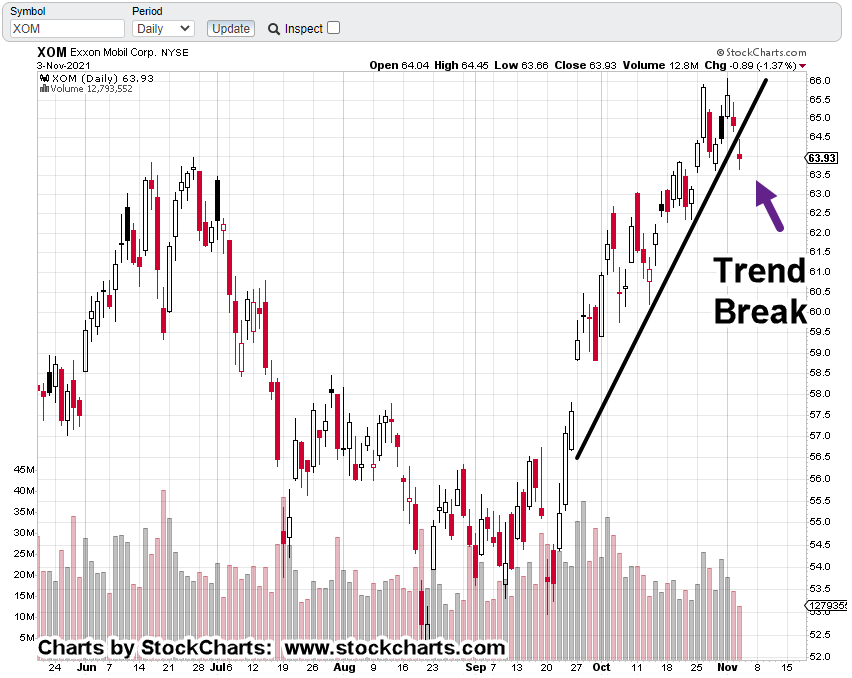
XOM’s the largest cap in the sector. We’ll use it as the proxy.
Last update has us exiting a short via DUG (not advice, not a recommendation) and standing aside for now.
It’s no secret the overall markets are insane … possibly in some kind of massive blow-off, FOMO top.
At the same time, they look like they’re ‘thinning-out’; that is, only a few are participating in the upward launch.
It’s a bearish warning
Thinning-out, tends to happen at the end or near the end of bull markets.
Looking For The Short
The big money’s made on the downside with down moves being two or three times faster.
The Daily closing chart of XOM above shows it’ still grinding itself higher.
Trend lines below say the upside may be reaching a limit:
If we zoom-in, it looks like there’s significant resistance at the 69 – 70 area for XOM … if it gets that far.
Looking For The News
With the current instabilities, world events, food supply, energy supply, earthquakes, volcanoes, we could get some kind of upset to launch the oil sector higher.
It may not happen.
If it does, that could be the time to re-enter short (not advice, not a recommendation).
Note: Posts on this site are for education purposes only. They provide one firm’s insight on the markets. Not investment advice. See additional disclaimer here.
Note: Posts on this site are for education purposes only. They provide one firm’s insight on the markets. Not investment advice. See additional disclaimer here.
Trouble for Moderna was spotted a while back and discussed in this post … along with a prediction that class-action may be forthcoming.
Our stopwatch is still ticking.
Positions
The account positions are short Oil & Gas XOP, using DUG as the vehicle (not advice, not a recommendation).
So far, its been a lot of banging around without much progress either way. However, at this point, a new low for DUG, below today’s low would signal trouble for the short side.
Stay Tuned
Note: Posts on this site are for education purposes only. They provide one firm’s insight on the markets. Not investment advice. See additional disclaimer here.
Note: Posts on this site are for education purposes only. They provide one firm’s insight on the markets. Not investment advice. See additional disclaimer here.