When Price Action Heads South …

Said many times;
‘When price action heads south, bad news comes out.’
That’s a slightly different take on Prechter’s (Elliott Wave) observation.
‘Price action leads the news; not the other way around’.
Going to BigCharts, typing in MRNA, shows they still have no P/E.
So, the ‘bad news’, can’t be they’re not making any money because they’re not doing it, now. 🙂
I wonder, who can it be now?
For a clue to the (potential) answer, we can look at what’s happening to Pfizer, link here and here.
However, let’s not get ourselves wrapped around the axle on events, forecast years ago.
Rather, let’s go straight to the truth, the price action and see what it’s telling us.
Moderna MRNA, Weekly
The entire move from low to highs is shown. Included on the chart, are two Fibonacci indicators.
One is the standard ‘retrace’ indicator; the other, is a ‘projection’ indicator.
The ‘projection’ is based off the ‘a-b-c’ move from the lows of November 2nd, 2023, to the highs on May 24, 2024.
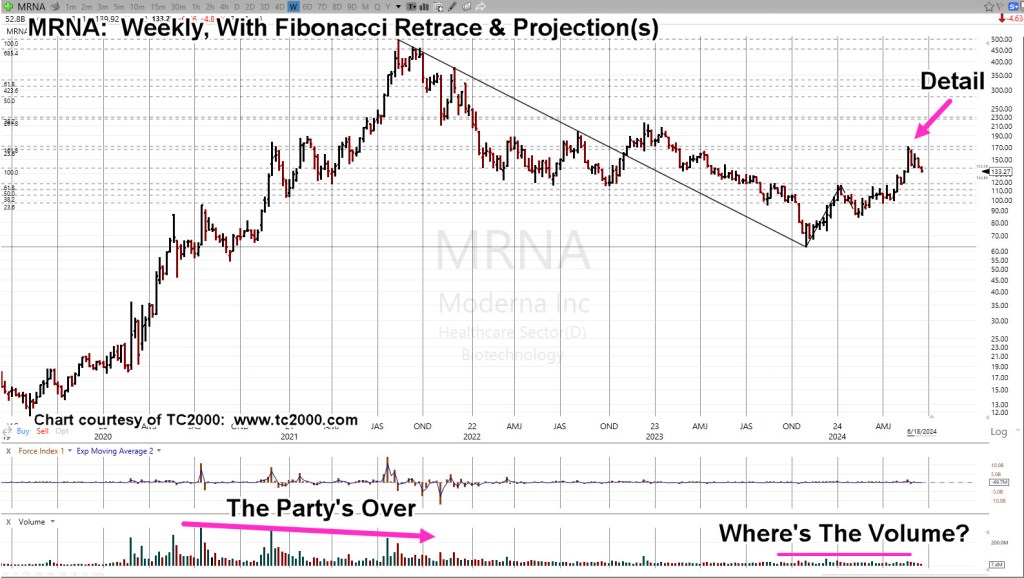
The retrace and projections are hard to see, so the ‘Detail‘, arrow is where we’re headed next on the daily.
Moderna MRNA, Daily
If there ever was a chart to once-and-for-all, refute, dismiss, trash, the whole ‘Fundamentals’ argument, that earnings, interest rates or some other ‘Voodoo economics’, moves prices, this is it:

MRNA, price action hit the 23.6% retrace level (exactly) for two days before moving on to hit the 161.8%, projection (exactly) before reversing.
Note the ‘100%‘ level as well; price action confirmed this area (exactly) three times! Once on the way up and two times on the way down (third time, not shown).
A century ago, Livermore said, ‘It’s all about the numbers’.
Strategy, First
Just as Livermore was primary a strategist, so is this site’s method of analyzing the markets, i.e., Strategy, Tactics, Focus, in that order (not advice, not a recommendation).
The news has been replete with reports like this one and this one.
Another panic ahead?

Sounds like it but at least in the case of Moderna, the chart itself says (effectively):
‘There’s no money in it’.
That means, another wave like we saw several years ago, is not the most likely future event (not advice, not a recommendation).
Stay Tuned
Charts by StockCharts
Note: Posts on this site are for education purposes only. They provide one firm’s insight on the markets. Not investment advice. See additional disclaimer here.
The Danger Point®, trade mark: No. 6,505,279