When The Short Squeeze Is Over …
Question:
How do you know it’s a short-squeeze?
Answer:
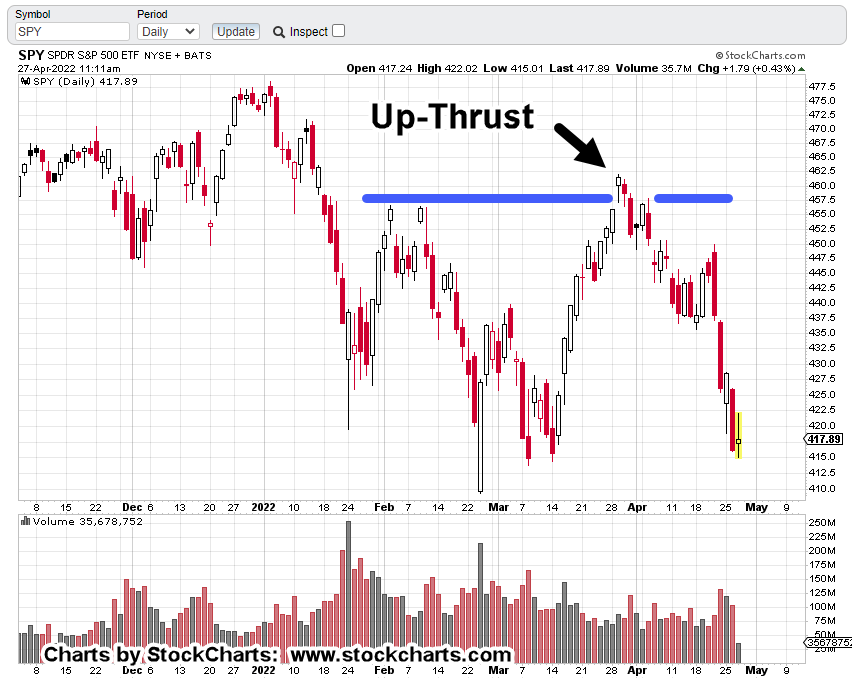
When it’s over, prices collapse.
That’s exactly what happened yesterday and today.
Yesterday was the squeeze; today, prices collapsed.
We’re about mid-way through today’s session and there could be a late-day test of the down draft. Even so, the action tells us, up moves at this time, can’t be sustained.
For the first hour of today’s session, price action went straight down. Not even a hint of an upward test.
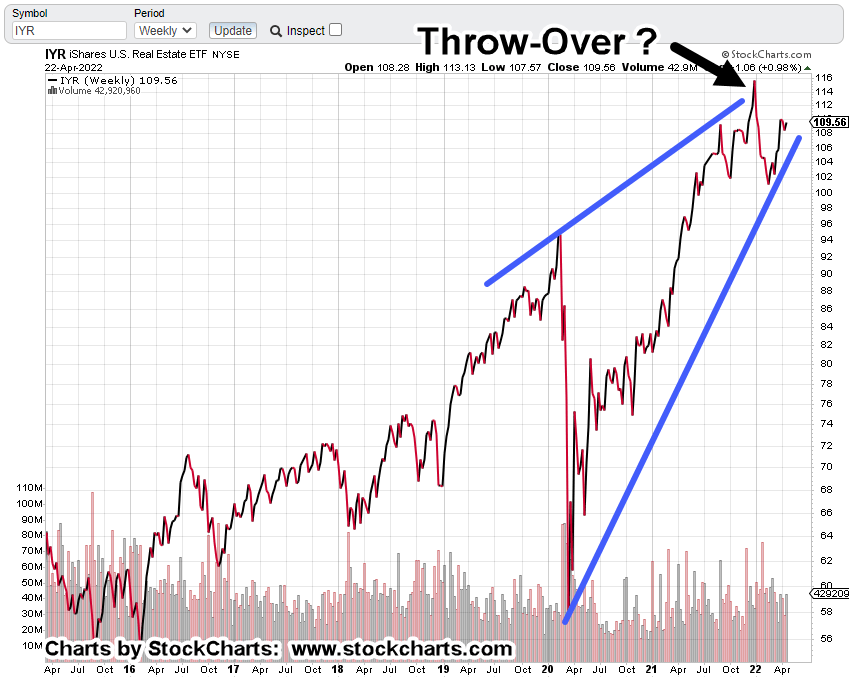
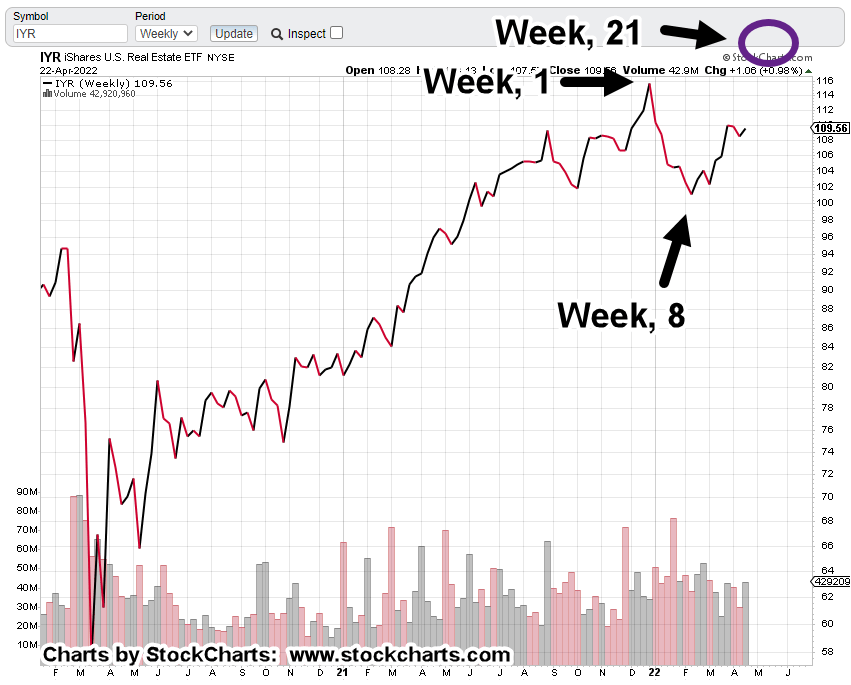
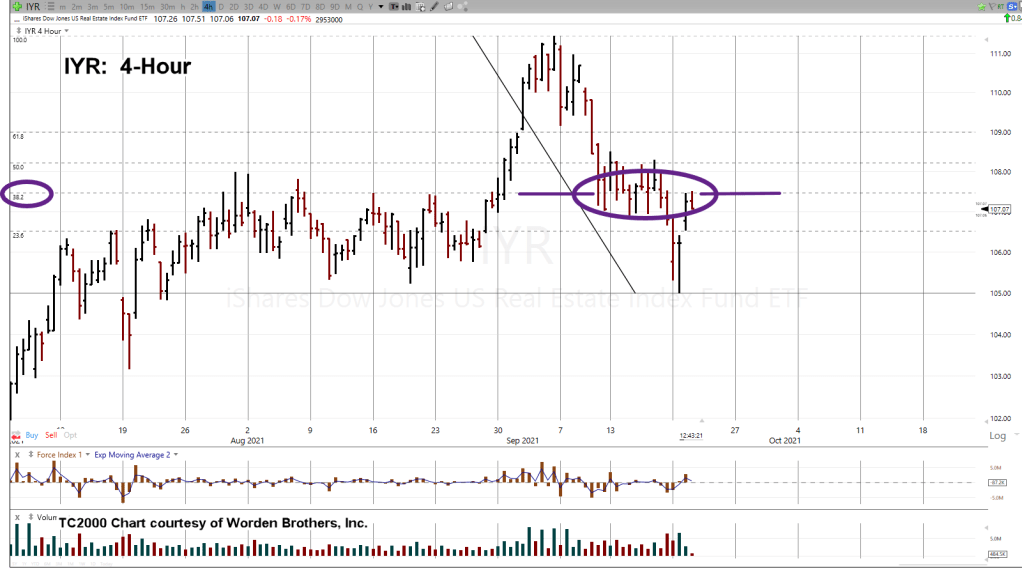
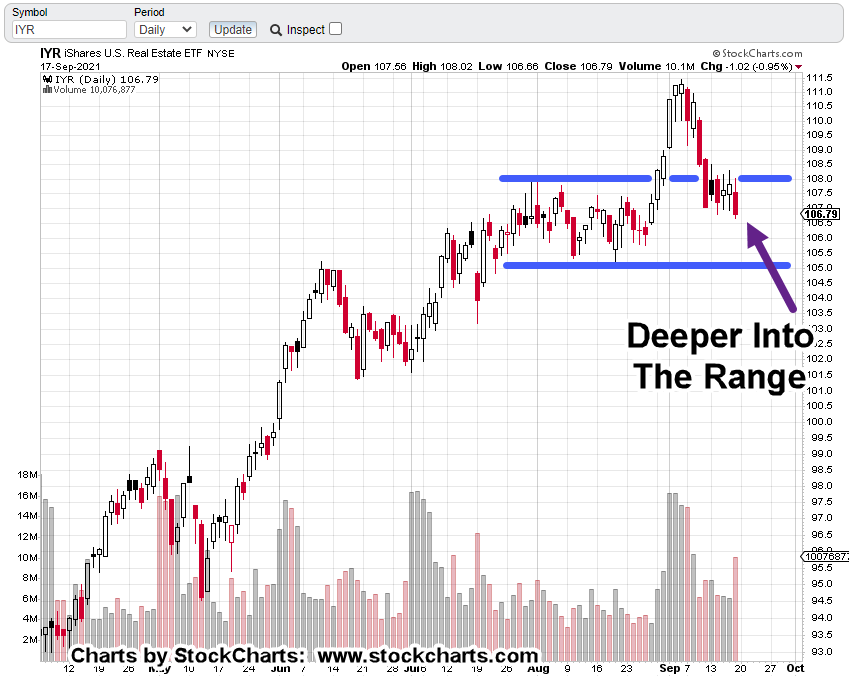
Real Estate IYR, Weekly Chart
This is how the weekly looks currently.
The 105.50 – 106.00, is an area of support.
Price action may hesitate and use that support for an attempt to move higher.

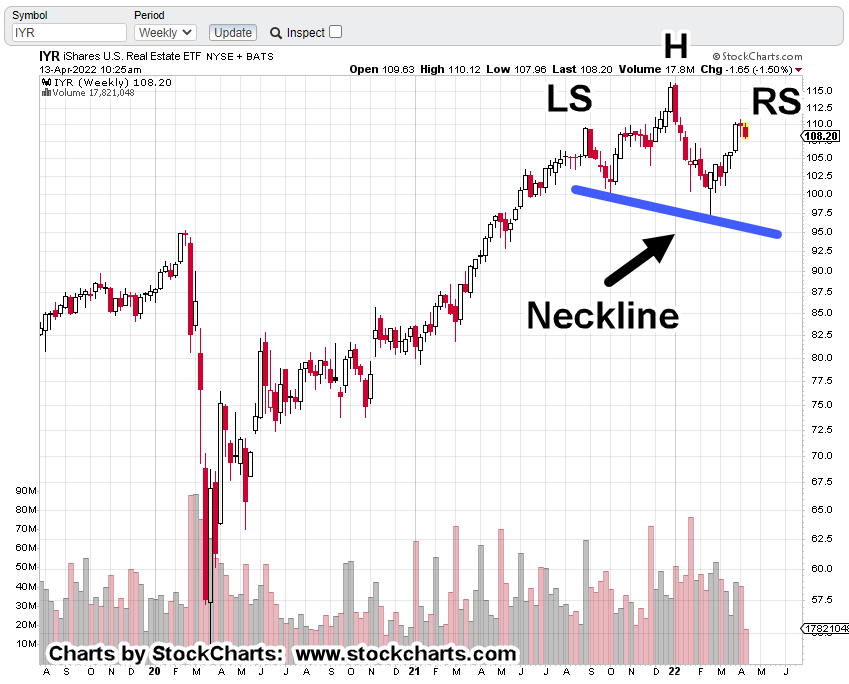
However, there may be something else at work that’s not obvious without a mark-up.
That is, IYR could be in a downward trading channel; having confirmed the right-side yesterday and today.

As Dan from i-Allegedly, has repeated time and again:
‘We’ve had warning after warning … after warning’.
He even uses that phrase in his recent video, linked here.
In his view, along with access to other real estate professionals, the set-up is worse than 2007 – 2009.
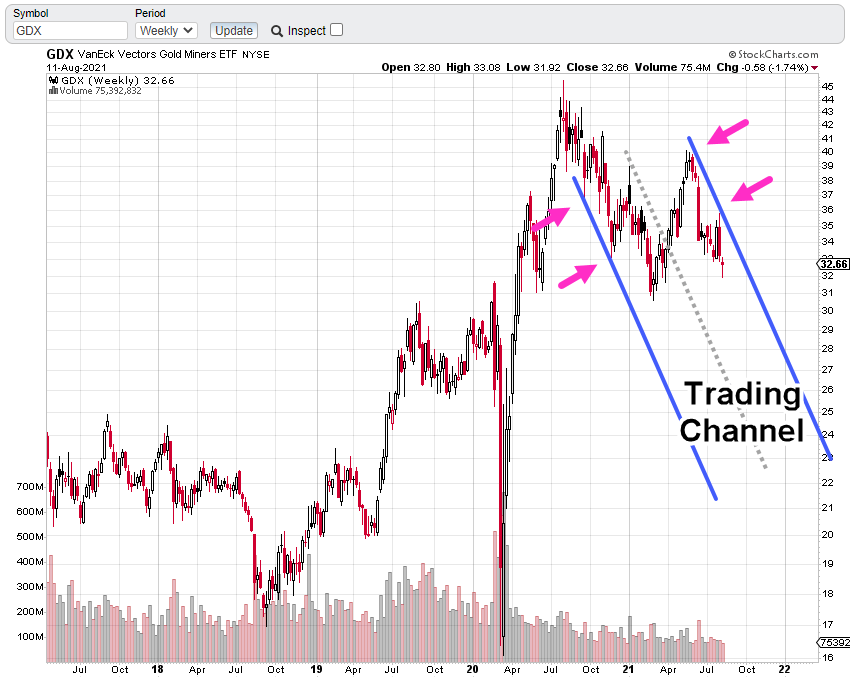
The trading channel area is zoomed-in below.
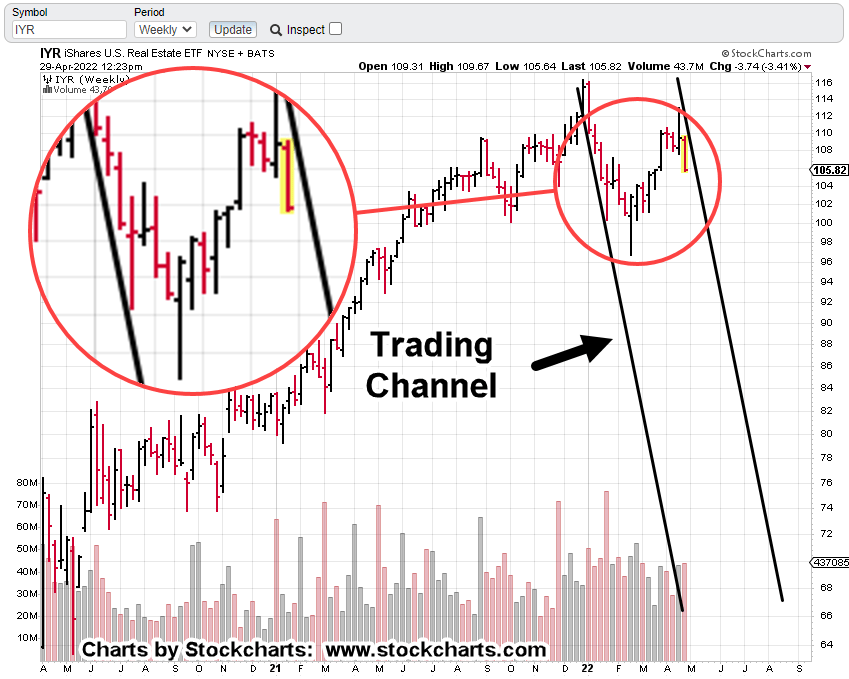
Four channel hits on the left side and two on the right.
The lowest contact spike on the left channel line to the highest spike contact on the right, is a Fibonacci 13-Weeks.
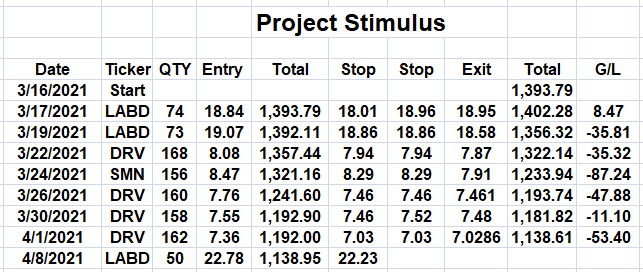
Positioning
For the most part during yesterday’s session, the short position in SRS was maintained (SRS-22-01).
However, late in the session as price action spiked higher, that position was closed and a new one opened with the 3X-Inverse fund DRV; identified as DRV-22-02 (not advice, not a recommendation).
The downward bias on a triple leveraged fund(s) is significantly higher than a two-times fund (even counting for the additional leverage).
Now that significant countertrend moves may be complete for a while, I’m taking advantage of the additional 3X leverage (not advice, not a recommendation).
There was a slight loss on the SRS-22-01, position; somewhere around -0.21 %, … not significant.
Summary
Both Dan (i-Allegedly) and Jerimiah Babe keep getting asked “When’s the collapse?”
Their responses are near identical; “You’re in it, now”.
What do they (asking the question) expect?
Do they want to have the societal, financial and we now know for sure, genocidal collapse, live streamed through their Netflix?
Stay Tuned
Charts by StockCharts
Note: Posts on this site are for education purposes only. They provide one firm’s insight on the markets. Not investment advice. See additional disclaimer here.
The Danger Point®, trade mark: No. 6,505,279