Note: Posts on this site are for education purposes only. They provide one firm’s insight on the markets. Not investment advice. See additional disclaimer here.
So, let’s take a look at a the largest cap in the mining sector, Newmont and see what the price action is telling us.
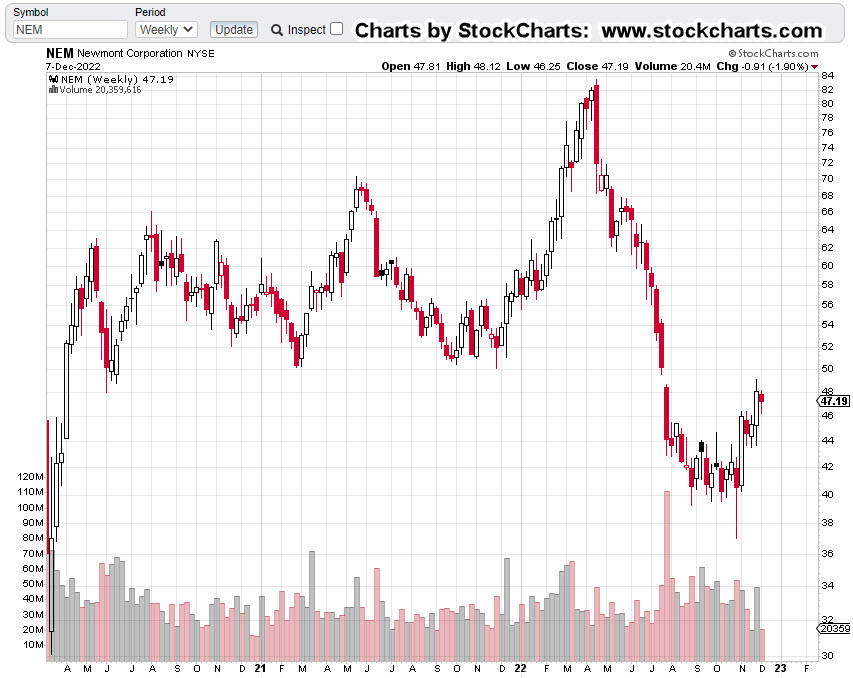
Newmont Mining NEM, Weekly
First, we have the un-marked chart and right off the bat, it does not look good; down -45.4%, from all-time highs.
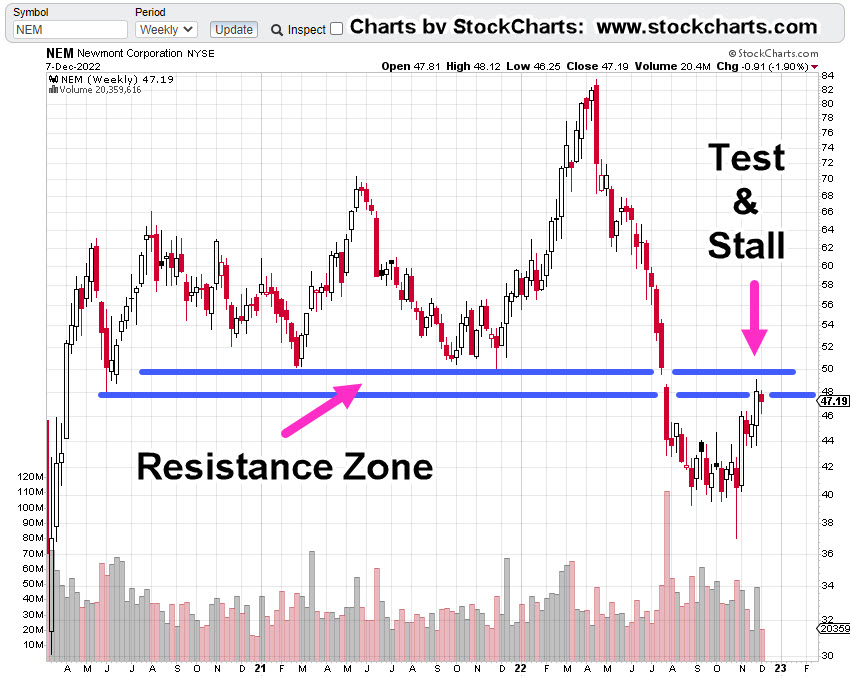
It looks even worse, when the resistance zone is added.
So far, price action has already stalled and not been able to hold within the resistance zone.
It’s important to note, this resistance area is over two years wide. it’s not likely that anything’s going to happen to the upside without numerous attempts.
No ‘Clicks’, In A Gold Bear Market
If buying gold was the answer to getting through the financial, economic and societal collapse, then one would think the price would be moving relentlessly higher.
Note: Posts on this site are for education purposes only. They provide one firm’s insight on the markets. Not investment advice. See additional disclaimer here.
Note: Posts on this site are for education purposes only. They provide one firm’s insight on the markets. Not investment advice. See additional disclaimer here.
An immense flood of data; research reports, lawsuits, expose articles and anecdotal evidence; every day, multiple times a day, something new.
Has the biotech technical (finally) lined up with the fundamental?
Those fundamentals are farther down but first, we’ll discuss the technical.
As a reminder, sometimes charts are inverted during analysis. This ‘trick’ was discovered years ago and is based on techniques used by Dr. Alexander Elder.
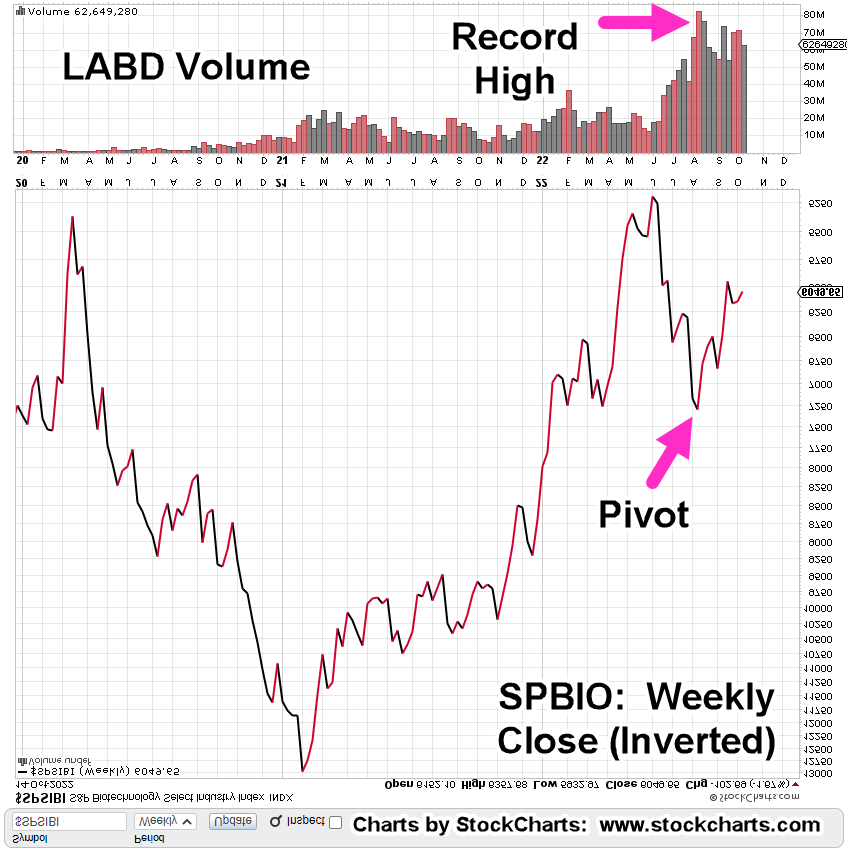
Biotech SPBIO, Weekly Close (Inverted)
We’ve taken the weekly closing chart of SPBIO ($SPSIBI, on StockCharts) and inverted it to mimic the action of inverse fund LABD.
The index has no volume; so LABD is used instead.
The magenta arrow shows the pivot point for the index, corresponds will all-time record volume on leveraged inverse LABD.
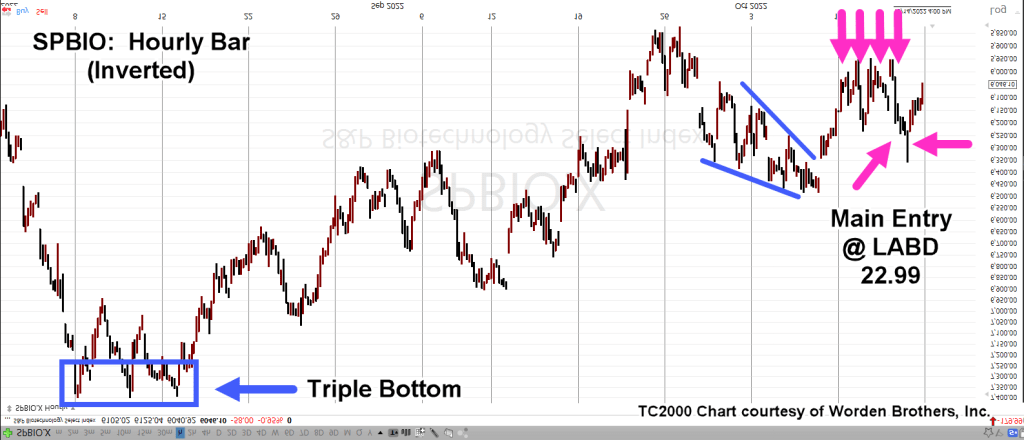
Next, we’ll get closer-in and look at the ‘pivot’ on the hourly chart (inverted).
SPBIO, Hourly (Inverted).
The magenta arrows show successive positions (Livermore ‘probes’) entered (via LABD) before the main entry @ LABD 22.99, which was 90% of position size up to that point.
The next day (Friday) had a gap-lower open that was quickly reversed. Position size was increased by another 5%, at LABD 22.29 (not advice, not a recommendation).
Effective position equates to LABD 23.17
Price action pulled away steadily from the early morning levels, suggesting a sustainable reversal.
The Fundamentals
Some of this stuff, you just can’t make up.
Listed in somewhat chronological order, here they are (not an exhaustive list).
No. 1
Pfizer hires 600 to help document adverse events. Wasn’t it supposed to be ‘safe and effective’?
Note: Posts on this site are for education purposes only. They provide one firm’s insight on the markets. Not investment advice. See additional disclaimer here.
It’s best to let the reader sort out what it all means, arriving at one’s own conclusions.
Of course, the obvious problem, the ‘elephant’ is not addressed directly.
However, VAERS is quoted in The Epoch Times article, thus giving it legitimacy.
Leading The Downside
For some time, this site’s highlighted, biotech (SPBIO), as unique to all other indices save GDX, and GDXJ.
That is, it’s down the most since the bear market started.
As of today’s close, it’s down over – 54%, from all-time highs while the S&P is down only – 23.7%.
As documented over several years, the sector’s unique; it’s at risk (more than other indices) to implosion.
With today’s close, it looks like we’re at a critical juncture.
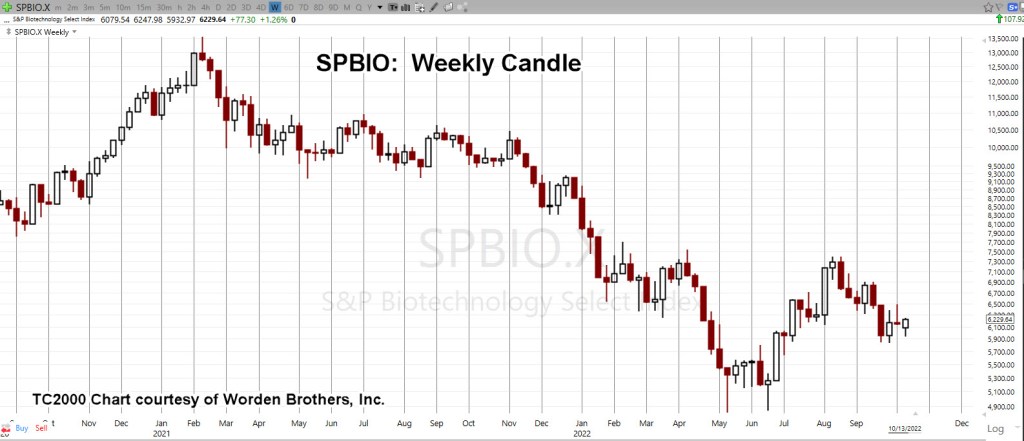
Biotech SPBIO, Weekly
The unmarked weekly chart
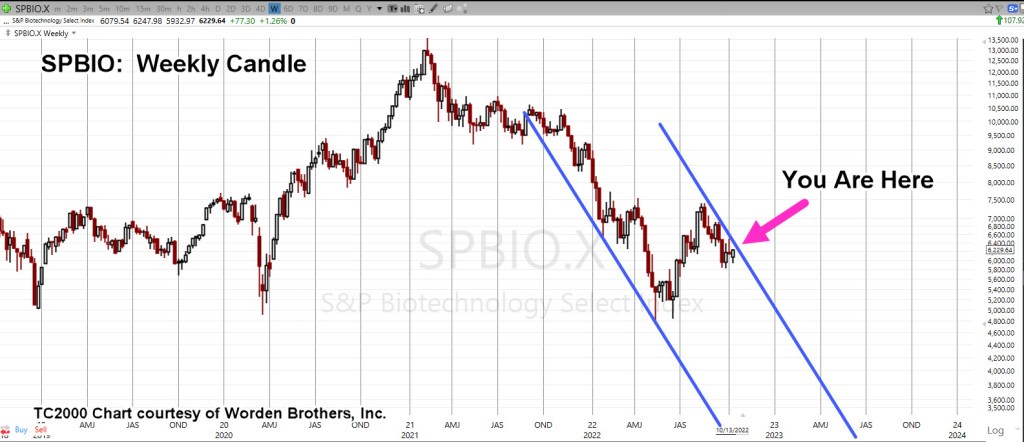
Compressed, with added trendlines.
It’s an obvious trading channel of immense size … but so is nearly everything else concerning these markets. We’re operating at unprecedented scale in unprecedented times.
But wait, there’s more.
The trading channel has Fibonacci time correlation(s).
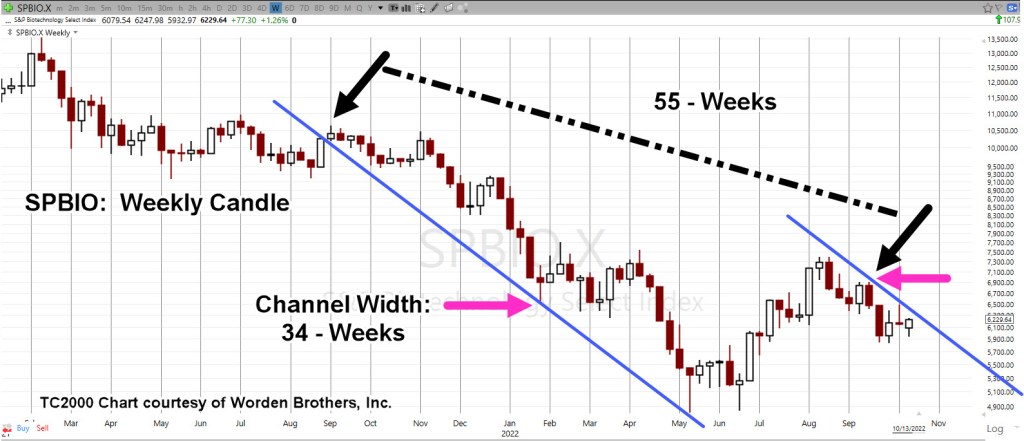
We’ll expand the weekly chart for more clarity.
From channel entry, week ending 9/3/21, to the right-most contact point (week ending 9/16/22), is Fibonacci 55-Weeks.
Channel width measured from week ending 1/28/22, to the same contact-point, week ending 9/16/22, is a Fibonacci 34-Weeks.
We’re at The Danger Point®
Positions & Current Stance (courtesy only, not advice).
The following is the positioning of my firm’s main (largest) account.
DRV-22-04:
Entry @ 66.463, Stop @ 63.98
Discretionary exit (today) @ 75.96***
Trade Closed
LABD-22-08:
Entry @ 25.1278, 24.735, 26.025***, 22.99***, Stop is Open (to be set at next session)
***, Indicates change
Note: Positions may be increased, decreased, entered, or exited at any time.
Note: Posts on this site are for education purposes only. They provide one firm’s insight on the markets. Not investment advice. See additional disclaimer here.
In what may be just the beginning of similar actions, is this the pivot point?
Part of a lawsuit’s process is ‘discovery’. That’s probably the last thing any ‘institution’ wants.
ZeroHedge picked up the news, linked here; the comment section is telling.
Potential for a significant reversal in SPBIO, has been on the radar for about three-weeks.
What’s price action saying at this juncture?
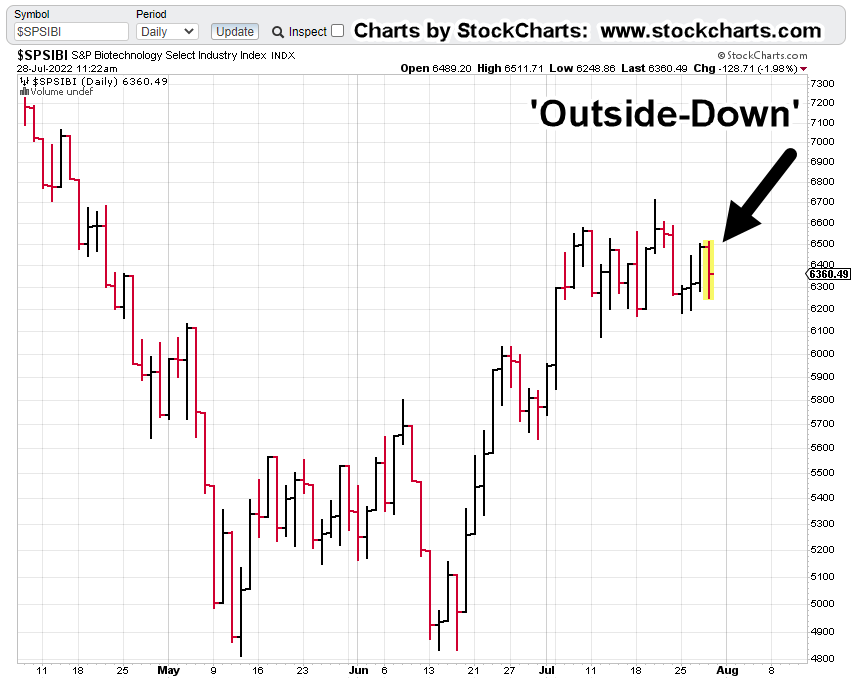
SPBIO, Daily
For starters, within the first hour of today’s session, we’ve already had an ‘outside-down’ print; last session’s highs and lows have been exceeded by today’s action.
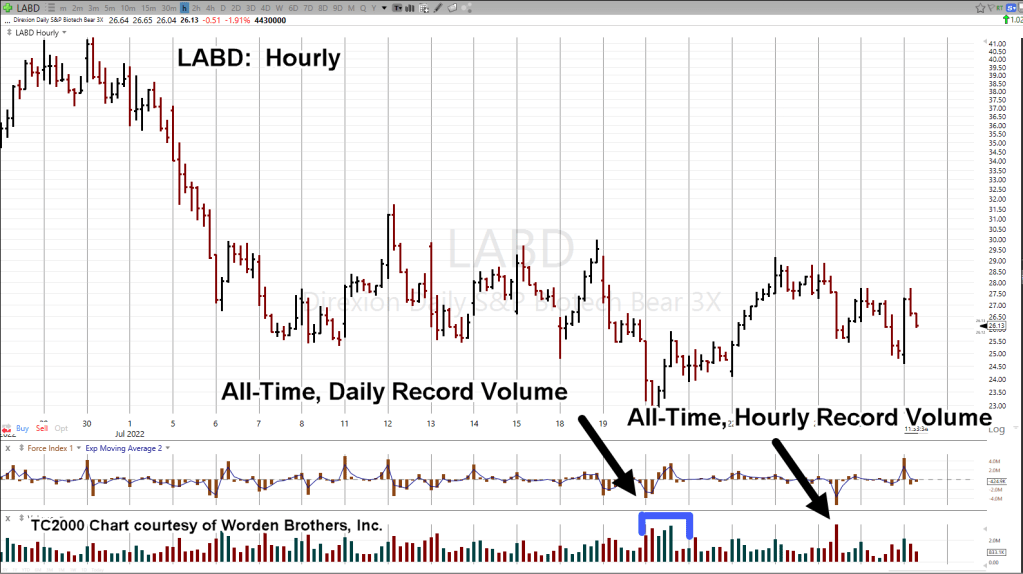
Shifting gears for the next chart, we’re looking at 3X Leveraged Inverse Fund LABD.
LABD, Hourly
The Wyckoff spring set-up is clear. The testing discussed in this update, is per-the-book for Wyckoff action.
‘Tests’ can always fail.
That’s why it’s called ‘The Danger Point’. It’s the location where the risk of being wrong is least (not advice, not a recommendation).
The next chart, also LABD, highlights the record volume on two time-frames, daily and hourly.
This is a potential ‘changing of hands’ from weak to strong for the short-side on SPBIO.
It should be noted, last week’s volume for LABD, was also a record, making it three time-frames.
Summary
As this post was being created, LABD continues to rachet lower into what is now a deep test.
Currently trading at LABD 25.98 (mid-session), we’ll see if the test holds and LABD finishes higher for the day.
Meanwhile, the fundamental backdrop and pressure continues to build.
Note: Posts on this site are for education purposes only. They provide one firm’s insight on the markets. Not investment advice. See additional disclaimer here.
Anyone who thinks the Fed’s going to ‘pivot’ because the numbers are weak, does not understand (or won’t admit to) the real purpose of the entity; but I digress.
The Strategy
Way back in December of 2020, this post was released which discussed ‘Genesis 41’, specifically.
It was an intuitive assessment; we’re in a phase where corn and grain (i.e., the food supply) are potentially more important than ‘stacking‘ silver or gold.
Over the ensuing year and a half, how correct, that has proven to be.
Then, nine-months ago, was this post, presenting the ‘elephant’; a massive population decline whose repercussions would last the lifetimes of anyone reading.
Now, we have this. A report that confirms the elephant.
It’s all starting to hit the mainstream, although the language is still being couched to not cause undue panic. Good luck with that.
So, what’s next?
The Danger Point: Real Estate
While mainstream press and money managers alike struggle to figure out the obvious, we have price action itself telling us the next likely direction of the market.
During an economic downturn there are many places not to be such as semiconductors, airlines and other low margin businesses, restaurants and so on.
However, the most illiquid of all, is real estate. It does not matter how bad one wants to sell, if there is no buyer, there is no sale.
Real Estate IYR, Weekly Chart
Last week, real estate IYR, closed right at the Fibonacci 23.6% retrace as shown.
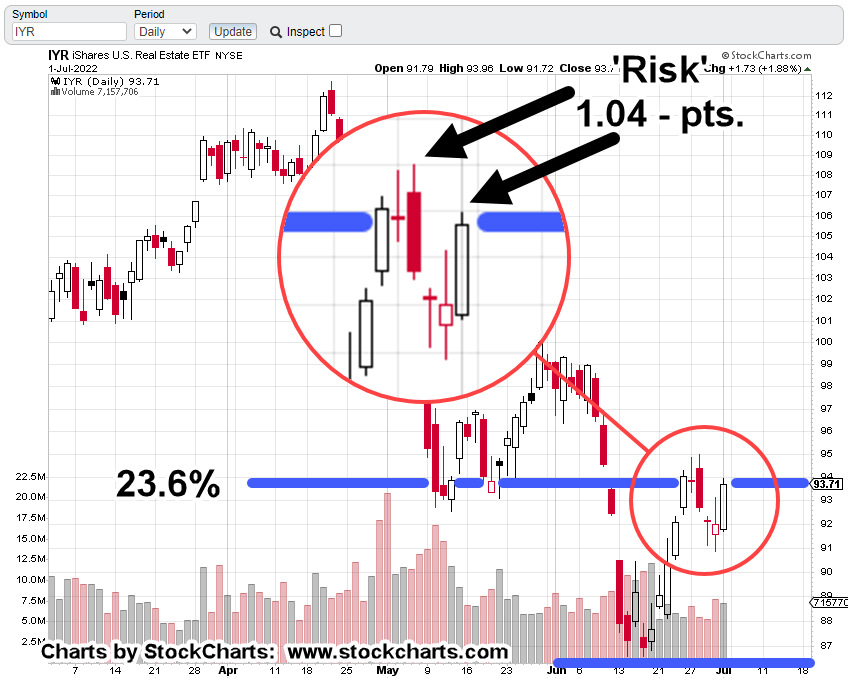
Getting closer in on the daily, it’s marked up to show the risk from a shorting perspective (not advice, not a recommendation).
Real Estate IYR, Daily Chart
In this case, the risk on a short position is defined as the distance from last Friday’s high (IYR: 93.96) to that same week’s high of IYR: 95.0
Let’s add, Friday’s action saw IYR, retrace a Fibonacci 76.4% (the most available) of the entire move for the week.
The Summary
Amazon (AMZN), ProLogis (PLD), and Real Estate IYR, are joined at the hip.
Now the economy’s imploding, massive warehouse space is not needed.
Ditto that for employees as well.
ProLogis is already down – 31.2%, from its all-time highs set just this past April.
We’ve already shown PLD, has a nasty habit of going straight down during a market route.
Last time, PLD, crashed over – 84%, in just two months.
Note: Posts on this site are for education purposes only. They provide one firm’s insight on the markets. Not investment advice. See additional disclaimer here.