Too Much … ‘Debt & Disruption’

Another Planned Event ?

So, how’s any business going to operate profitably in an environment that’s systematically being disrupted?

Those that could come up with a plan (for their company or business) in such an environment, i.e., the ‘competent‘, are leaving in droves; letting the slackers, back-biters, corporate gossips, and the incompetent, finally have free rein.

This phenomenon likely applies to all major businesses. We already see the entrenchment.

Then, The Fed

Then, there’s the Fed. Surely, when they see how bad things are, they’ll lower rates; Right?

‘When the Fed realizes the economy’s in a recession, they’re going to lower rates‘.

That’s ‘normalcy bias’. We’re in a new construct: There’s no Fed ‘pivot’, rate lowering, or any ‘accommodation’ in sight.

On top of that, some have figured out, things aren’t quite right at the Fed; looks like different ‘forces’ are at work.

Go to time stamp 10:50 at this link (warning, contains profanity).

Then, The ‘Stackers’

So, we’ve gone from stacking toilet paper to stacking what’s thought to be precious metals.

The question is … are they real or fake?

First, it’s fake silver … and then, even the Perth Mint got into the act with ‘diluted’ gold bars.

As stated, years ago, during the Texas Freeze, when it really hits, the grid goes down, nothing’s working, it’s freezing outside, precious metals are nowhere on the list (not advice, not a recommendation).

Then, The VIX

As if all of the above was not giving us clues that something’s about to happen, there’s the VIX.

Volatility is down … way down … too far down.

All of which bring us to the topic at hand.

Now, The Debt

If you believe the talking heads and ‘finance’ YouTube sites that claim the debt deal will cause massive inflation, well then, let’s pose the following question.

If that was true, why are gold and silver not responding in a huge bull market with upward leaps (a la 1995, S&P) each day, then week and month?

Those close to the market always know something; their actions show up on the tape.

It could be we’ve already past the top in spending …. just by market pressures alone. It’s possible, all that extra allocated ‘pork’ may never get implemented (not advice, not a recommendation).
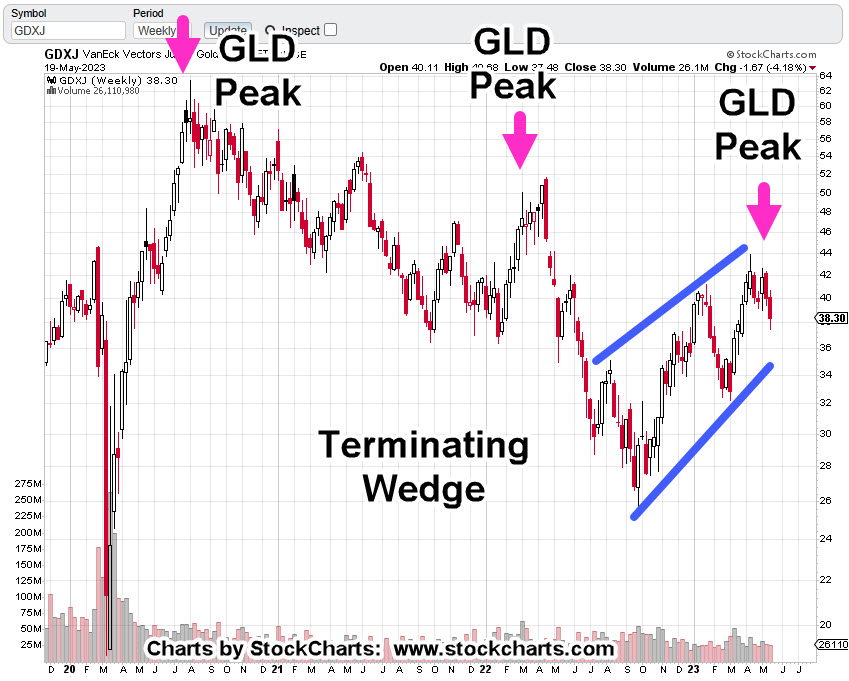
Lastly, The Miners

The miners GDX, GDXJ, have been in a bear market for years with all-time highs (GDXJ) during the first half of 2011.

Since then, the sector is down over 72%

It’s interesting, that this high stress, physically demanding industry with risk of danger ever present (here, here and here) reached a bear market peak in mid-2020, just as certain ‘items’ were being mandated.

Junior Miners GDXJ, Daily

As the competent leave the general workforce, would the resulting lack of accountability make itself known first in professions where stupidity causes direct effect in reduced production and/or increased accidents?

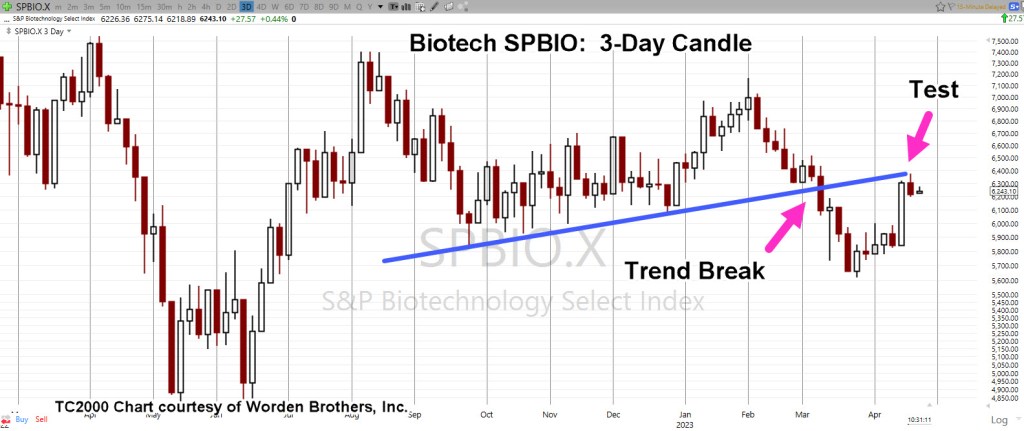
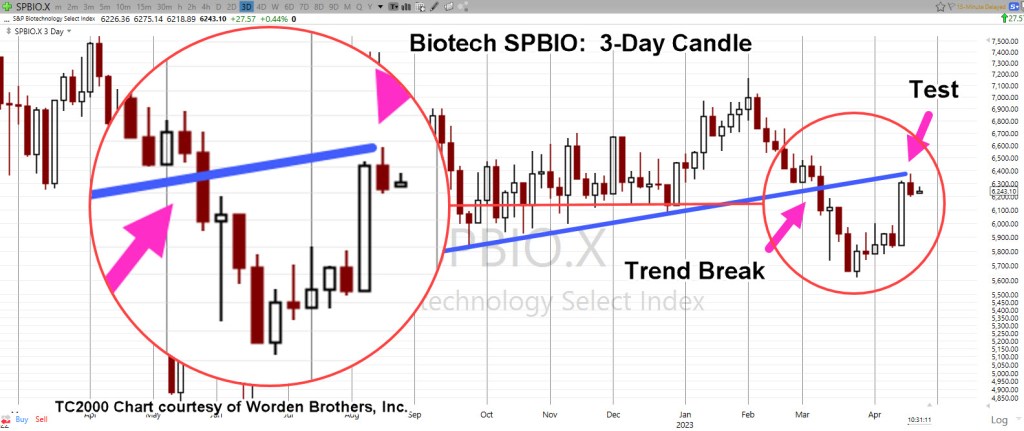
The GDXJ is at an interesting juncture.

It’s currently under resistance (blue line) that has already been tested.

At the end of the session today, we’re a Fibonacci 8-Days from the low set on May 25th.

If the index is going to reverse lower from here, this is a likely place to start.

Another attempt at resistance would indicate more upside pressure than anticipated; any existing short positions would be closed (not advice, not a recommendation).

Stay Tuned

Charts by StockCharts

Note:  Posts on this site are for education purposes only.  They provide one firm’s insight on the markets.  Not investment advice.  See additional disclaimer here.

The Danger Point®, trade mark: No. 6,505,279

Gold At The ‘Wedge’

What Comes Next ?

Gold bulls could get cooked.

If gold does not go higher, it’s because of ‘manipulation’, right?

The typical YouTube gold grifter acts like manipulation is a new discovery.

It’s the ‘go-to’ excuse when their forecasts don’t work out.

Way back in the early 1900s, Wyckoff discovered the market has always been manipulated.

His insight was, it’s up to the speculator to figure out the objective of the manipulation and then act accordingly (not advice, not a recommendation).

Livermore knew about manipulation and even engaged in it himself. He looked at things in a slightly different way; meaning, what is, not, what should.

A very key difference.

So, let’s look at what is happening with gold (GLD), and where it may head from here.

Gold GLD, Weekly

First, the chart from the April 9th, update.

Now, the updated chart.

It took gold (GLD) several weeks to labor higher on ever shortened thrusts before finally exhausting itself and rolling over into a reversal … where we are now.

Is price action hesitating before heading higher or is this a significant downside move in the making?

It probably won’t be long before we have the answer.

Junior Mining Sector GDXJ, Weekly

The gold mining indices GDX, and GDXJ, have already made their decision, reversing to the downside.

Note: Each reversal from a gold peak in the Junior Sector GDXJ below, is at significantly lower levels. This is not gold miner ‘bull market‘ behavior (not advice, not a recommendation).

It’s clear, the Junior Miners are in a bear market …

The GDXJ, is completing or has completed what is an obvious bear flag or terminating wedge.

Unless price action shows us differently, this is the current assessment; lower prices ahead (not advice, not a recommendation).

Fundamentals

From a fundamental standpoint, where’s the demand for inedible (possibly fake) metal going to come from? The consumer’s already tapped-out and borrowing money just to buy the weekly groceries.

Maybe something else is going on.

Something else that’s causing precious metals miners to anticipate another huge (economic) move lower.

Possibly completely unrelated (in a way) to the mining sector … maybe yet another ‘Speck’ event, shown at time stamp 3:40, at this link.

At the same link, time stamp 5:25, we’re back to the food supply … yet again.

“And all countries came into Egypt to Joseph for to buy corn; because that the famine was so sore in all lands.”

Stay Tuned

Charts by StockCharts

Note:  Posts on this site are for education purposes only.  They provide one firm’s insight on the markets.  Not investment advice.  See additional disclaimer here.

The Danger Point®, trade mark: No. 6,505,279

Biotech … Early Stage Reversal

The ‘Big’ One ?

Sometimes early in a reversal it looks like nothing’s happening.

Only after we’re underway, it’s clear where the pivot occurred.

In our case, biotech SPBIO, broke down out of its bear flag, came back to test and now, may be continuing on its downward track.

The reversal’s not obvious yet and can be easily negated by more upward pressure. We’re at The Danger Point®.

A quick review of the monthly chart shows a potential Head & Shoulders forming.

Biotech SPBIO, Monthly

If that’s what’s happening, the H&S pattern, it’s massive; spanning five-years and counting.

The ‘Fundamentals’

Of course, a massive reversal pattern would coincide with what’s happening overall at this juncture.

It seems that each day, we have more of this:

Twitter Files: Dr. Anthony Fauci “Lied Under Oath”

CDC Director Admits Vaccines Do Not Prevent COVID Transmission, Blames “Evolution Of Science”

Throw in a banking crisis or two, credit tightening, supply disruptions and this sector may collapse under the weight of that all by itself (not advice, not a recommendation).

Moving closer in, on a 3-Day chart we see the break and test more clearly.

Biotech SPBIO, 3-Day

We’ll zoom-in on the trend break.

Lastly, going to the 3X Leveraged Inverse Fund LABD, on the daily timeframe, it shows a repeating trendline that may be in confirmation during this session (currently, 11:15 a.m. EST).

Biotech Leveraged Inverse LABD, Daily

It’s still early in the session and anything can happen.

This is where the risk is least (not advice, not a recommendation).

Stay Tuned

Charts by StockCharts

Note:  Posts on this site are for education purposes only.  They provide one firm’s insight on the markets.  Not investment advice.  See additional disclaimer here.

The Danger Point®, trade mark: No. 6,505,279

Biotech … Testing Resistance

Test & Reverse ?

The Wyckoff ‘spring’ position in biotech was identified correctly.

Two days later, SPBIO launches straight-up.

So, let’s take a look at what’s likely to happen next.

Going way back to 1931 and Wyckoff’s teachings and course material (still available here), he stated:

‘When an up-trend is decisively broken to the downside, more often than not, there’s some type of attempt to rally as a test of that break.’

We’ll use a Fibonacci 3-Day Closing chart of Biotech SPBIO, to see if Wyckoff’s timeless market insight still holds up in today’s world.

Biotech SPBIO 3-Day Close

Starting with an un-marked chart, first.

Putting in the notations with a zoom into the recent action.

Well, it looks like nothing has changed in the last 100-years because there it is. 🙂

Biotech broke down out of its trendline and bear flag of the past five months and has now come back to test that area.

Fundamentals

By this time, we all know the story on this sector. The fundamentals are nothing short of horrific.

Just in case there’s someone new to this site and they’ve not yet got the memo, we’ll add two more to ‘The List

Contentious COVID-19 Drugs Are All Anti-Malarial: May Not Be A Coincidence

UK Study Finds “No Evidence” Face Masks Protect Vulnerable Against COVID

As always, it’s the comments from the ‘ZeroHedge Guys’, that are more valuable than the article itself.

Strategy

For my corporate accounts, I’m already re-positioning short via LABD, starting during the last session (not advice, not a recommendation).

The initial entry has been quite small as this market could push a bit higher (lower for LABD) just because of momentum alone.

We see that in today’s pre-market session (LABD down about 2%).

It’s now about five minutes before the open.

Stay Tuned

Charts by StockCharts

Note:  Posts on this site are for education purposes only.  They provide one firm’s insight on the markets.  Not investment advice.  See additional disclaimer here.

The Danger Point®, trade mark: No. 6,505,279

Biotech (Short) Trade Nets + 37%

Just Part of The Story

I once had an Uncle tell me:

“Percentages are for liars”

There may be doubters, haters, even money managers reading this and thinking that as well.

So, we’re going to get into it.

We’ll address the ‘liar’ claim, present the current state of biotech along with partial exit of the short position (not advice, not a recommendation).

Fundamentals: The Rats Scramble

Anyone with two-boosters rubbing together can see the rats scrambling; attempting to ‘normalize’ the abnormal.

For example, it’s now ‘standard procedure‘, after a Pilot’s ‘incapacitated’ (i.e., potentially drops dead) in the cockpit to roam about the cabin and ask if there’s anyone else available to fly the plane.

You can’t make this up. Nothing to see here.

Now, on to the charts.

First: Let’s Review

The chart re-printed below, is how it looked this past February 9th, as presented in this post. Recall, the actual reversal was identified to-the-day, in this post.

To go even a bit further, the Wyckoff penetration set-up was identified a day earlier, in this post.

SPBIO Leveraged Inverse LABD, Daily

Re-printed from February 9th.

Fast forward to now. This is how it looked on Friday.

From the chart above, the reversal is well underway.

Momentum has slowed a bit, hence the reason for the position to be reduced by about 13%.

If the decision to partial-exit was wrong and LABD heads immediately higher, there’s still a sizable position open.

If LABD spends the next several days contracting lower (as anticipated), there may be an opportunity to re-acquire the exited position at a lower level (not advice, not a recommendation).

The next chart shows the current trading channel.

It won’t take much sideways to down action to contact the right side. If or when that happens, we’ll see how price action behaves.

Where’s The Lie?

The spreadsheet below, is a modified version of what’s used by my firm. Note, it’s not the actual shares traded but a representation of that action.

The chart has been simplified with the initial entry (of this series) adjusted to 1,000 shares. Subsequent entries are adjusted by the same factor as the initial entry.

For the engineers, the data has been ‘normalized‘.

Working the numbers; we have $43,162.10 initial cost, $59,226.55 at the exit, yielding $16,064.45, which is just over a +37%, gain.

If there’s a lie in all of the above data, the analysis identifying the set-up, the reversal and subsequent trading actions with partial exit, I’m not sure where it is. 🙂

Note: The two left-most rows of ‘zeros’ in the chart are for commission charges. The spreadsheet was developed way back in the day when we had such things.

The right-most row of ‘zeros’ is open profit/loss.

Stay Tuned

Charts by StockCharts

Note:  Posts on this site are for education purposes only.  They provide one firm’s insight on the markets.  Not investment advice.  See additional disclaimer here.

The Danger Point®, trade mark: No. 6,505,279

Alcoa: Another ‘Chief Cook’

Yet, One More ‘ESG’ Opportunity

Like Carvana, Alcoa has no P/E

However, before we get started, this just out concerning Biotech:

From the German Health Minister, no less:

“Permanent Disabilities”

In a way, it does tie into the Alcoa analysis.

As a reminder, the economic (and population) collapse created by protection from ‘The Speck’, will last the lifetime of anyone reading this post (not advice, not a recommendation).

To support that statement and expand on the enormity of what’s happening, we have this link.

‘Over the next 10 years, ‘Speck’ lawsuits are projected to experience tremendous growth.’

With that, let’s move on.

Alcoa & ESG

Just looking at the website, it’s an ESG cornucopia.

When looking at the chart, it’s (almost) a no-brainer.

First, the very long-term view (Quarterly)

Alcoa AA, Quarterly

On the long-term, we have the repeating market characteristic; ‘Spring-to-Up-Thrust.

A ‘test’ of that up-thrust has been occurring over the most recent quarter.

On the weekly chart, we see price action penetrated support with volume increasing.

Alcoa AA, Weekly

Technically, it’s a Wyckoff ‘Spring’ set-up. Some form of upward action next week is to be expected.

However, with the increased volume to the downside, probabilities are low at this point we’ll see any significant upside (not advice, not a recommendation).

Long Way To The ‘Open’

As said in the prior update, events are accelerating. The latest from ZeroHedge proves that to be true.

UBS Seeks Government Backstop As It Rushes To Finalize Credit Suisse Takeover Deal As Soon As Tonight

Another Nail in the Coffin

Looks like the Swedes have put another nail in the coffin for ESG. How long is it going to take for their pension system to fully collapse and then result in social unrest a la Paris?

Stay Tuned

Charts by StockCharts

Note:  Posts on this site are for education purposes only.  They provide one firm’s insight on the markets.  Not investment advice.  See additional disclaimer here.

The Danger Point®, trade mark: No. 6,505,279

Intel … ‘Penny Stock’ by Year End ?

Trading Channel

Beginning next week, we’re about to find out if Intel (INTC) is on track to be a ‘penny stock’, by year-end.

Stocks trading below $5/share, are technically called ‘Penny Stocks‘, and mostly ignored by institutional money.

Dystopian Hell: The Stage Is Set

INTC, has already cut the dividend by 66% (note the symbolism) and is ‘conserving cash’.

A large part of their operation with 18,600 employees, is just outside Portland, Oregon.

Here’s a recent look at Portland, uploaded two months ago.

‘Gee honey. Let’s take the kids and move to Portland … Not.’

Incredible, that ‘Speck Protection’ is STILL being pushed (time stamp 2:11). How would you like to work at a location at this late date, where it’s normal to wear a mask?

So, it goes.

All of this brings us to the chart. The price action itself defines the next likely course (Wyckoff).

Intel INTC, Weekly Close

Last week closed testing underside resistance and potential right-side trend line contact (second chart).

Compressing the chart and expanding the downside scale, gives us the following.

Just in case anyone’s skeptical about ‘channels’ not being a real potential, here’s the latest look at Carvana (CVNA).

Carvana CVNA, Weekly Close

It’s important to note, not only the channel but the location of “No P/E”, which was the release of this post.

Carvana never closed higher after December 11th, 2021.

Intel, What’s Next?

Will it be the same for Intel?

Of course, that’s not known. Price action itself is the final arbiter; at this juncture, it’s at The Danger Point®

This is where the risk is least (not advice, not a recommendation).

If price action moves significantly higher from here, let’s say 5%, then we’ve likely bottomed and are heading into a rebound.

If not, and Monday, opens and closes lower, it may be a confirmation of the right-side trend line and potential trading channel (not advice, not a recommendation).

Let’s see what happens next.

Stay Tuned

Charts by StockCharts

Note:  Posts on this site are for education purposes only.  They provide one firm’s insight on the markets.  Not investment advice.  See additional disclaimer here.

The Danger Point®, trade mark: No. 6,505,279

Biotech … Breakdown, Breakout

‘The Court Jester’

Court jesters reveal truths like no other.

How appropriate then, that someone who typically plays the ‘village idiot’ comes out with the truth.

Whether the ‘false narrative’ is finally crumbling or not, is not directly related to analyzing price action.

It does, however, provide the backdrop.

The ‘Big Reveal’

The last update in biotech had this to say (emphasis added):

If this is the big reversal and biotech is the downside leader, unfortunately, that could mean a planned ‘reveal’ by the mainstream media.

What wasn’t known, was just exactly how the truth would come out. Now, we know.

All of which, brings us to the topic at hand: Biotech SPBIO.

It turns out, SPBIO, is trading most consistently, on a three-day pattern.

Biotech SPBIO, 3-Day

In Wyckoff terms, the market itself defines what timeframes and what support/resistance levels are important.

Next up, we’re going to invert the chart to mimic the price action observed on the leveraged inverse fund LABD.

Biotech SPBIO, 3-Day, Inverted

And now, the characteristics of this sector the market itself, has revealed.

At this juncture, SPBIO, trades in a sequence of 3-Days after which, if there’s a directional move, continues on for nine consecutive bars.

After nine-bars, price action typically enters a correction for an undetermined amount of time.

After the correction’s compete the market has (in the past) continued on a directional move for another nine-bars.

Then & Now

We’re currently in a directional move that’s five ‘3-Day Bars’ in thus far.

If the market adheres to its prior behavior(s), we have at least four more ‘three-days’ to go (not advice, not a recommendation).

Note, the current reversal was identified to the day, with this update:

“However, today’s action is consistent with resolution of the five-months of congestion (not advice, not a recommendation).”

The fact the congestion period for SPBIO has taken so long to (apparently) resolve itself, has produced the potential for price action to go farther, last longer than anyone would normally expect.

That move if it happens, connects well with the introduction at the top of this post; a large part of the public has been informed in no uncertain terms, it was all a lie.

The needle, and the damage done.

Stay Tuned

Charts by StockCharts

Note:  Posts on this site are for education purposes only.  They provide one firm’s insight on the markets.  Not investment advice.  See additional disclaimer here.

The Danger Point®, trade mark: No. 6,505,279

Moderna … Options Strategy

Trend Contact … Then, Pivot Down

With a potential right-side trend (and channel) contact confirmed; shown below at – 86% annualized, odds are now favorable for a Put strategy.

In addition to the technical factors discussed, listed at the bottom of this post are no fewer than 22-links to the current fundamental state of biotech and their ‘handiwork’.

The weekly chart of MRNA, has a Wyckoff Up-Thrust and a test, confirmed by the downside pivot.

Moderna MRNA, Weekly

Notice the reversal action took place at a very weak Fibonacci 23.6% retrace.

The two blue lines on the daily chart (below) are exactly parallel.

The grey lines are parallel to the blue lines and intended to show MRNA, exhibits a repeating (downtrend) pattern.

Moderna MRNA, Daily

The expanded version on the daily has support being penetrated (horizontal blue line) and then ‘spring’ action last Friday as a result.

Of course, it’s ‘what happens next’, that’s the question.

In a prefect scenario, price action would thrust lower for a day or several days and then come back up to test the underside of resistance.

Elder Option Strategy

This strategy is taken from Elder’s book ‘Come Into My Trading Room’, and seeks to use as short-dated options as possible.

Doing so, requires the discipline to wait sufficient amount of time for price action to get into position and for option time value to bleed-off.

Potential Upside

Since we’re already in spring position and price action moved off the lows on Friday, MRNA could continue the upside right back to, or past the downtrend line.

However, with massive (undeniable) fundamentals building buy the day, and MRNA being mentioned specifically in at least one link below, probabilities favor the downside.

Supporting Links For The Bearish Stance

Florida Surgeon General Warns Life-Threatening VAERS Reports Up 4,400 Percent Since COVID-19 Vaccine Rollout

US Says Government, Not Moderna, Should Face COVID-19 Vaccine Lawsuit

New Medical Codes For COVID Vaccination Status Raise Concerns Among Experts

Watch: Rand Paul Grills School Of Nursing Head On Student COVID Vaccine Mandate

US Navy Lifts COVID Vaccine Mandate For Sailor Deployment

Mainstream Media Continues To Push False ‘COVID Heart’ Narrative To Explain Excess Deaths

NFL Players’ Association Urged To Screen for Heart Issues Over Vaccine Side Effects

WHO Suddenly Shelves Plans For Second Phase Investigation Into Origins Of COVID-19: Report

Watch: CDC Director Suggests It Will Never Change Child-Masking Policy

Rand Paul Introduces Bill To Halt Funding For Hospitals Denying Care To The Unvaxxed

Welfare State Weakens… 30 Million Americans Are About To Lose ‘COVID’ Food Stamp Handouts

IMF Says World Needs To Prepare For The “Unthinkable” After COVID, War In Ukraine

COVID Emergency, Climate Emergency: Same Thing

Novavax To Sell US Government 1.5 Million More Doses Of COVID-19 Vaccine

“World’s First” Unvaccinated Dating Service Launches In Hawaii

Living The Lie

‘COVID-Curing’ Sorrento Therapeutics Plunges After Filing For Chapter 11 Bankruptcy Protection

What Can We Learn From The Biggest Lies People Believed About COVID?

Censorship Operations: COVID, War, And More…

CDC Director Defends Mask Mandates After New Study Shows Masking Has Little Effect

Bivalent COVID Vaccines Perform Worse Against Variant Now Dominant In United States: Studies

COVID NEWS COMPILATION WITH NUMBER 33

Stay Tuned

Charts by StockCharts

Note:  Posts on this site are for education purposes only.  They provide one firm’s insight on the markets.  Not investment advice.  See additional disclaimer here.

The Danger Point®, trade mark: No. 6,505,279

Do Not Pass ‘Go’

Do Not Collect $200

Go Stright To Economic ‘Depression’

And, that’s where we are ladies and gentlemen.

Provided many times on this site, the assessment we’ve gone straight past recession and directly to: ‘The Greater Depression’, or ‘The Great Depression 2.0’

By now, we’re all aware of this data, just out from ZeroHedge.

That data is at the ‘peak’ or the depths of 1932, and we in our current market, haven’t even got started!

‘Entertain Me’

YouTuber, Michael Cowan, has picked up the story.

You can hear the frustration in his voice (time stamp 1:31) as everybody seems to be waiting to be ‘entertained’ with a crash before they do anything.

It’s a good thing we’re not part of that ‘crowd’, right? 🙂

Lions and Tigers and The Fed, Oh My!

The Fed’s interest rate announcement is due out at 2:00 p.m., Eastern, today; does it really matter?

We can see with unbiased observation; the wheels have already, irrevocably, been set in motion.

The economy along with the ‘elephant’ that no one talks about, are juggernauts on a downward course.

The 1929 Crash, Then Bull Rally

Remember, the big market speculators of the early 1900s typically made their fortunes on the way down (not advice, not a recommendation).

Let’s also not forget, one of, if not the largest market rallies up to that time (in percentage terms), happened right in the middle of The Great Depression.

Chart by macrotrends: www.macrotrends.net

Of course, to trade that mid-1930s rally, you had to have the capital to do so.

Which brings us to the next topic: Real Estate.

Real Estate IYR, Weekly

With yesterday’s new print high, we’re at Fibonacci Week 34. That puts us at a potential trading channel or inflection point as discussed in this post.

There’s no guarantee of a trading channel or even a reversal.

However, we do have a confluence of events; upside volume (pressure) declining, marginal new highs and the potential Fed pivot point, due out today.

It’s about 20-minutes before the open. Let’s see what happens next.

Stay Tuned

Charts by StockCharts

Note:  Posts on this site are for education purposes only.  They provide one firm’s insight on the markets.  Not investment advice.  See additional disclaimer here.

The Danger Point®, trade mark: No. 6,505,279