Massive downside potential for biotech SPBIO; upside for inverse, LABD.
Unless there’s some kind of unexpected reversal, LABD is showing its colors … huge upside potential.
As expected, LABD has completed its testing action previously discussed in these two updates; here and here.
At the minimum, we’ve got a right side LABD trend that if followed, will result in a doubling of current price near the end of this month or early next.
A trailing stop can be used which adheres to the (now confirmed) trend; not advice, not a recommendation.
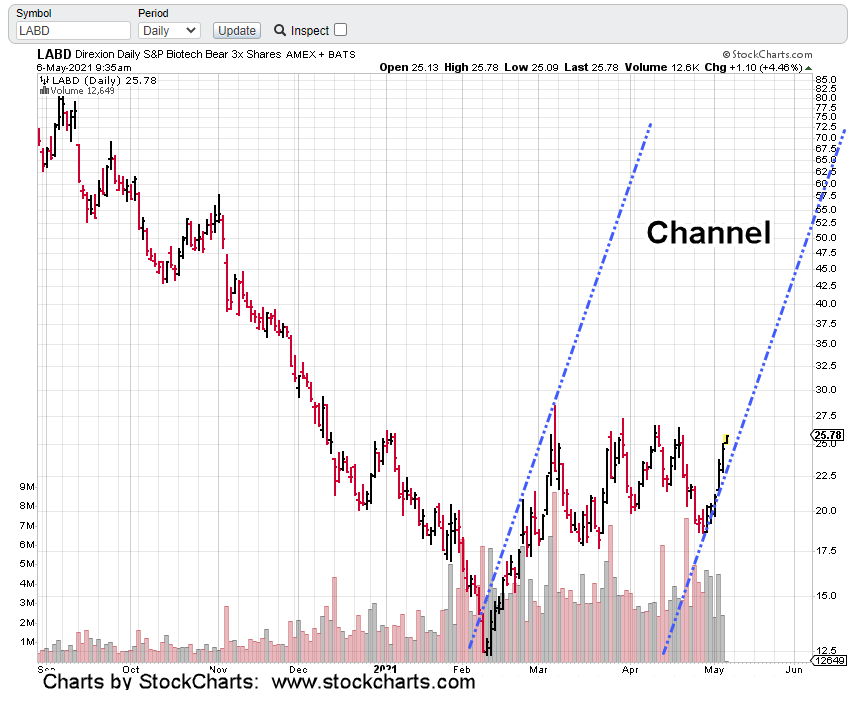
If LABD really is in the channel shown, the top of the range even at this point, is around the 170-level; nearly 550%, from current price.
As always, anything can happen. For now, we’re sitting tight and letting price action dictate the next trading move.
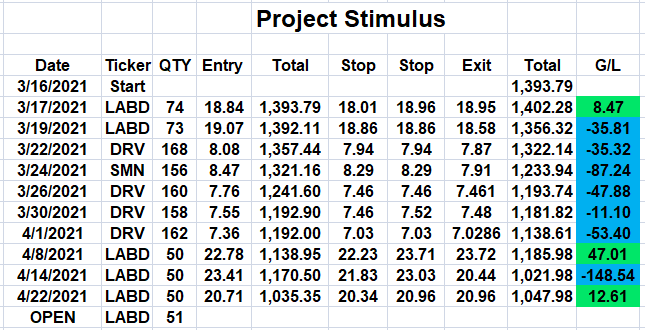
The Project Stimulus account will need to get above the $2,000 level before margin is allowed (by the broker).
By that time, it may be a moot point; volatility could be too high for any kind of size increase.
Note: Posts on this site are for education purposes only. They provide one firm’s insight on the markets. Not investment advice. See additional disclaimer here.
From an engineer who worked 24-years in avionics and aircraft flight test and certification, anyone with two photons rubbing together could call out this farce.
Not sure the purpose for the lie … just that it’s a lie.
As a wild engineering guess:
To have such an ‘aircraft’ operate on Mars, the rotor blades would need to be a half-mile long, fifteen feet in width and be weightless themselves; spinning at 600 – 1000 PRM, to be able to lift a 4-lb payload.
Let’s see if anyone has the cajones to do the real math on this one.
Number 4.
Current parallels to The Great Depression can not be refuted.
Benign (25% unemployment) history book accounts are lies.
No surprise there.
One excellent source for what’s likely to happen next; Neil McCoy-Ward and his latest update.
Some comments from the linked livestream posted below:
This is a typical excuse (it’s not 1931) or complaint from those who do not have the neural plasticity to take yesterday’s data and adapt it to the current scenario.
These types of people are not likely to survive
Yes, the medical community (with few exceptions) has been bought.
There is no guarantee that I and my firm are playing this chess game of collapse correctly.
However, being focused on Bitcoin or Dogecoin as Jerimiah Babe puts it, is buying into the (beast) system. It’s conditioning those involved to accept a digital currency.
At this point, we’re focused on shorting biotech until price action dictates otherwise. Not advice, not a recommendation.
Stay Tuned
Note: Posts on this site are for education purposes only. They provide one firm’s insight on the markets. Not investment advice. See additional disclaimer here.
While the markets grab headlines of all time highs, biotech’s at the crossroads of collapse.
This site has zeroed in on the most likely candidate to head decisively lower once the bubble has burst.
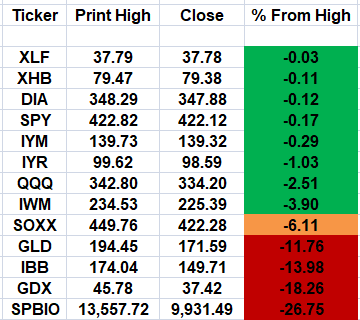
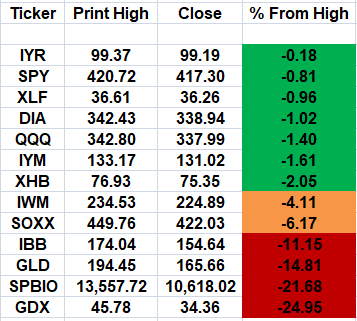
In fact, if we look at the table of tracked markets below, biotech’s SPBIO, has taken over downside leadership.
Next to last is GDX; the senior mining index.
Repeated many times before, this sector is overcrowded with delusion on both sides. From a trading standpoint, no thank you.
Daily and monthly charts of biotech SPBIO are below. Both charts are inverted and have Fibonacci projections.
The charts are essentially clean so they don’t clutter the data.
Daily SPBIO (inverted):
Monthly SPBIO (inverted):
If SPBIO gets to the extreme Fibonacci projection of 261.8%, it will represent a sector decline of just over -92%.
Sounds about right; not advice, not a recommendation.
Recall, from the 1929 highs to the lows in 1932, was around -84% (depending on the source).
Under those extreme circumstances, -92% decline is not unreasonable.
Of course, if a collapse does happen, it’s not likely to go straight down. The entire ’29 crash did not go straight down either. There were many false rallies on the trip to the bottom.
Note: Posts on this site are for education purposes only. They provide one firm’s insight on the markets. Not investment advice. See additional disclaimer here.
After watching and listening to all segments, if you changed the dates, you’d think it’s talking about the here and now.
Three key takeaways are:
Intentional destruction of the food supply
Real unemployment numbers falsified
People starved to death
We can look at today’s payroll data as a pivot point. For whatever reason (out of work, being paid not to work), the economy’s not coming back.
The belief the economy’s going to be stronger once the benefits run out (as stated in the linked article) is false.
The current economy is being intentionally destroyed.
That’s not too hard to determine.
Here’s just one more bit of data (unverified, but still of note) to support that assessment.
If you’re unemployed, starving to death, you’ll be a ready face-diaper wearing compliant subject; easily coerced into being injected (executed).
Obviously, the goal is to be as independent, self-employed as possible so we’re not that person.
Which brings us to the culprit du jour: Biotech.
Yesterday, the expectation was for a reversal and test (that day) before SPBIO continued its downward trajectory (LABD higher).
It looks like the test is lasting two days (maybe more) instead of one.
Inverse fund, LABD is currently trading near 24.15. That’s right in the vicinity of the expected range between 23.90 – 24.30, stated yesterday.
LABD did push a little bit lower in the early session to 23.68, but still within expected range.
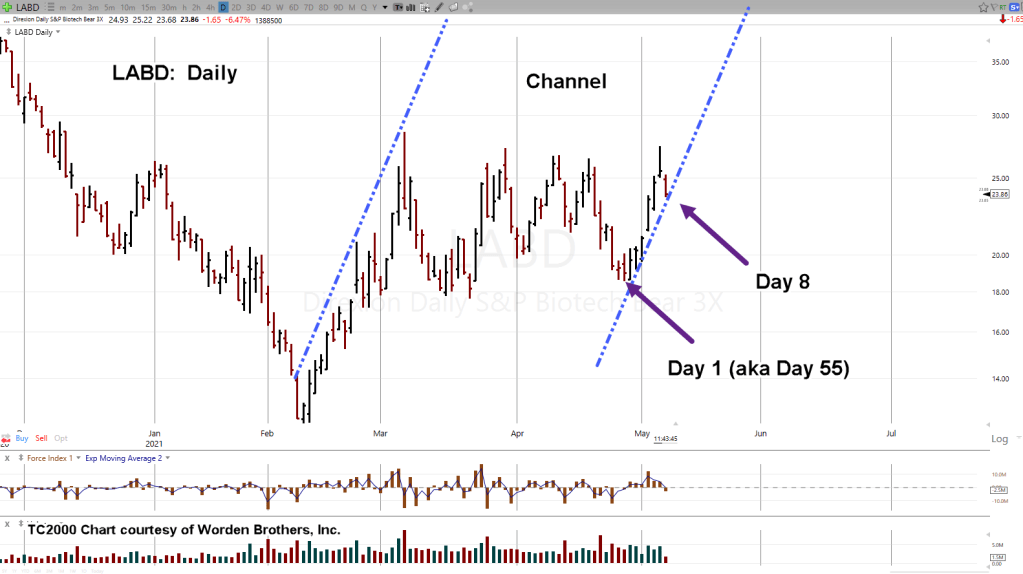
LABD is testing the right side channel line and trying its best to break through. Thus far, the low for the day remains at 23.68.
If there’s an upward (LABD) reversal from here, a Fibonacci Day 8, from the original Day 55 low, it would give more confirmation we’re at least following the trendline; potentially at the very right side of a huge trading range.
Stay Tuned
Note: Posts on this site are for education purposes only. They provide one firm’s insight on the markets. Not investment advice. See additional disclaimer here.
It’s possible, after ‘Day 55’, LABD (above) attempted to negate the uptrend (pushing out of the right side) … only to find itself a few days later back in the channel.
Looking at the big picture, could or will LABD reach the upper channel line?
Is that possible?
After the experience with oil futures going negative (last year) the first time in market history, it should be obvious, anything can happen.
If LABD’s in the trading channel shown, we’re still in the early stages of the move.
Today, the expectation is for price action to reverse; coming back to close (or test) near the trend line around 23.90 – 24.30.
If it does and then gaps higher tomorrow (Friday), thus confirming the trend, it’s potentially the last stop for low risk positioning (not advice, not a recommendation).
Otherwise, with LABD up 7%, as of this post, we could already be off to the races.
Note: Posts on this site are for education purposes only. They provide one firm’s insight on the markets. Not investment advice. See additional disclaimer here.
Yesterday, was an upward push that wound up being an ‘out-side-down’ bar (GLD, GDXJ, SLV) … a reversal in itself.
That’s not in the script. Or, is it?
At this point, the public’s literally redirected, manipulated, at will. It’s a sick game being played by all who control the media.
From a personal standpoint, I’d rather make some popcorn, take my red wagon full of fiat, go camp down around $800/oz., and wait.
The gold ice cream man may never show up. If he does, great.
If not, there’re other opportunities; at least I’ll not be one of the manipulated masses screaming inflation hyperbole if/as/when gold ratchets all the way down.
Stay Tuned
Note: Posts on this site are for education purposes only. They provide one firm’s insight on the markets. Not investment advice. See additional disclaimer here.
Note: The last two links do not verify the veracity of the referenced material. Be advised.
Momentum is building for some kind of ‘tipping point’.
We may be there now.
We’re looking for an avalanche of reports whose combined (fundamental and technical) effect is catastrophic implosion of the biotech sector.
Market Analysis:
The chart speaks for itself. It’s obvious biotech has reversed and could be in serious trouble.
The inverse fund LABD is up a stiff 10.5%, as of this post:
We may or may not have a trading channel as shown.
The right side trendline will need more confirmation. As always, anything can happen and the nascent move could fall apart.
However, what is known:
SPBIO’s (and LABD’s) pivot was called ‘to the day’.
The “Iceberg” notation references this report, where the probability of SPBIO downside at that juncture was presented.
That analysis was correct. SPBIO never looked back.
Positioning:
Our ‘project’ position remains open (not advice, not a recommendation). The correct stance under current circumstances is to let price action take LABD higher.
As Livermore said nearly a century ago, the hard part now is to ‘sit tight’. Let the market determine when the move has ended.
Note: Posts on this site are for education purposes only. They provide one firm’s insight on the markets. Not investment advice. See additional disclaimer here.
With price action similar to the Amgen reversal, senior mining index GDX, is testing resistance.
As if taking a cue from yesterday’s report on gold heading lower, today we have gold and the miners deciding to head higher.
All is not what it seems however.
The GDX chart above, shows we’re already in up-thrust condition. There has been a sign of supply (selling overwhelming the buying) and now we’re heading up into a test.
Going back to this report on Amgen, it’s a near exact replica of price action; except it’s (apparently) taking place quicker.
Note the bottom of the ‘Sign of Supply’ is a Fibonacci 8-Days from the high posted on April 21st.
That would naturally lend itself to expect testing action to complete on Fibonacci Day 13, which is this coming Friday.
Remember, that as soon as everyone’s got it figured out (Fibonacci time frame) it changes to something else. So, if no one is really paying attention and still in the hyper-inflation bull camp, they’ll look at this action as a bull move; missing the reversal (when or if it comes).
Tests can fail as well. GDX could push through the resistance and negate the up-thrust.
As stated many times before, the gold market’s too crowded with too many rabid bulls.
This may be a good test and reversal set-up but we’ll stick with shorting biotech (not advice, not a recommendation).
By the way … biotech’s doing very well on the short side today … 🙂
Note: Posts on this site are for education purposes only. They provide one firm’s insight on the markets. Not investment advice. See additional disclaimer here.
No-one in the inflation camp wants to hear that … it’s uncomfortable to face the potential of being so wrong.
Albeit wrong in the short term but probably right later … after it’s too late. More on that farther down.
Just like the lazy (and complicit, we might add) financial journalist publishing the standard (speck blaming) propaganda for the day, so too are the hyper-inflationists, jumping on the most popular bandwagon in town.
Not even considering the potential for a retrace; admittedly, which could be short and sharp but significant nonetheless.
This site has presented several times, we’re in a situation similar to that of Genesis 41. It’s the corn and grain first … then gold and silver.
Just to back that up a bit before getting to the charts, we have the following:
Those so focused on stacking metals will likely be using that stack to pry much needed food, food staples, seeds and fertilizer out of the hands of those not willing to sell … at any price.
Why are the oligarchs not worried about the ‘little guy’ stacking metals?
Because there’re going to make it irrelevant … at least for just long enough to completely bankrupt, starve or ‘inject’ the middle class.
Moving on to the charts:
The title header said ‘big picture’. Here we are with monthly gold charts going back to the 1950s, time-frame.
It’s been a long … long bull market. It appears to have made a top at ~1,972 and is retracing … if only just a bit.
The second chart is the one that gives us pause. Consider the potential for a more substantial pull-back.
Markets like to retrace and test. It’s what they do.
That second chart is scary. It’s plain, the 760 – 780 area is a long time (monthly) support level that goes all the way back to 1980.
Absolutely no-one expects, or is planning for gold to get back to $800/oz, or lower.
Think of the irony. The ‘stackers’ (and maybe the rest of us), having to exchange actual money, gold and silver, for worthless fiat just so they/we can buy food to stay alive.
After the middle class stackers have exhausted their metals hoard, that’s when gold and silver will launch into the next bull phase.
It has been done this way (keeping the peasants under control), literally for millennia. The method works … why change?
Summary:
The intent here, is to at least recognize the possibility for the above scenario. It’s clear and becoming more clear every day, food is the weapon of choice.
The objective is to have enough food ahead of time; be in position to take advantage of once-in-a-lifetime metals prices should that opportunity be presented.
Note: Posts on this site are for education purposes only. They provide one firm’s insight on the markets. Not investment advice. See additional disclaimer here.
Remember the maps at the mall … that showed the layout and where you were?
Well, here we are:
In candlestick lingo, Thursday was a ‘hanging man‘ set-up.
Friday was confirmation with a lower open, lower close, and penetration of the prior day’s low.
Error Correction:
A prior update made somewhat of an error when it said ‘Of all the major indices, biotech on a percentage basis, is the downside leader.’
Sort of.
The Index Table below is updated to include gold (GLD) and the senior miners, GDX.
In fact, GDX is leading the downside.
From a trading standpoint, GDX has been ignored because it’s such a crowded market. Nonetheless, for different reasons than biotech (i.e. deflation), strictly speaking, it’s the downside leader.
Note: Posts on this site are for education purposes only. They provide one firm’s insight on the markets. Not investment advice. See additional disclaimer here.