Note: Posts on this site are for education purposes only. They provide one firm’s insight on the markets. Not investment advice. See additional disclaimer here.
Yesterday, biotech had moving average compression; today, it’s Alcoa.
In this case, we’ll present the monthly chart, showing the long-term picture.
As we’ll see, moving average compression is rare, especially when using the longer time-frames.
In the case of Alcoa (AA), you have to go all the way back to 1978, to find a similar event.
The Big Bubble
Referring to Prechter’s analysis link here, he states that we’re [potentially], in the largest asset bubble since the South Sea, over 300-years ago.
Let’s keep that in mind. Events are happening on such a massive scale; the typical observer may not be aware of the significance and/or the rarity.
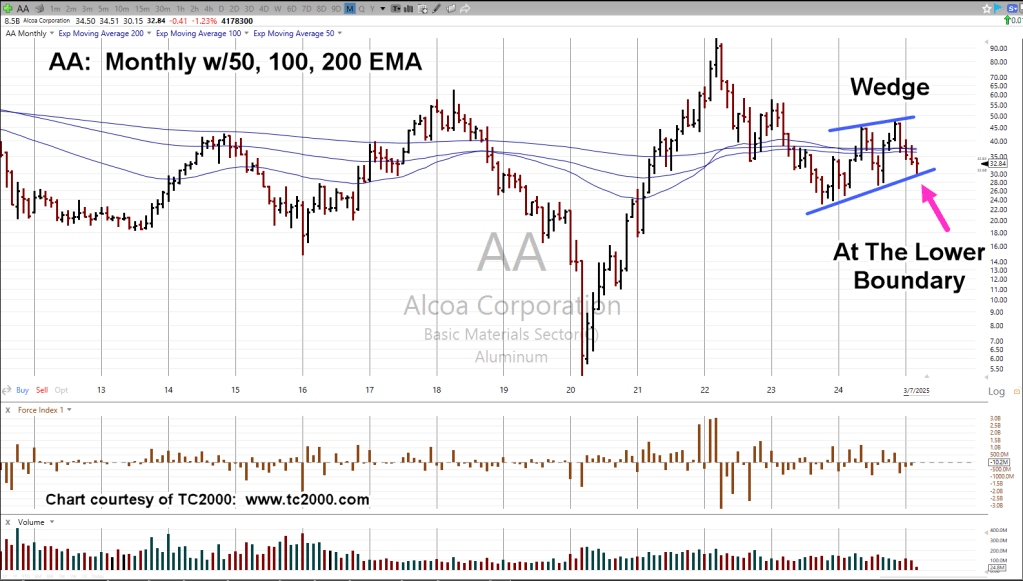
Alcoa AA, Monthly
The zoom areas are side-by-side to show the similarity.
Expanding the chart and including the wedge notation, also shows price action at the lower boundary.
It should be noted, AA, is part of the ‘Basic Materials’ sector, with tracking ETF as IYM.
Included in the IYM components, is NEM, and RGLD; this sector is correlated with the miners, GDX, GDXJ.
Positioning
It’s the trader’s discretion as what to do at this point.
This site may or may not execute a direct short of Alcoa, just as it might do with Carvana (CVNA), and maybe others (not advice, not a recommendation).
Note: Posts on this site are for education purposes only. They provide one firm’s insight on the markets. Not investment advice. See additional disclaimer here.
Like something straight out of The Princess Bride, this morning’s Broadcom (AVGO) explosion, probably doesn’t mean what the ‘investing’ public thinks it means (not advice, not a recommendation).
The link above, tells us AVGO, has launched higher on a ‘bold A.I. forecast’.
A Forecast !!! … what maybe could, or might happen in the future, if nothing bad happens along the way, … maybe.
Well, let’s go to the sector itself, the SOXX, and see what the market’s really telling us.
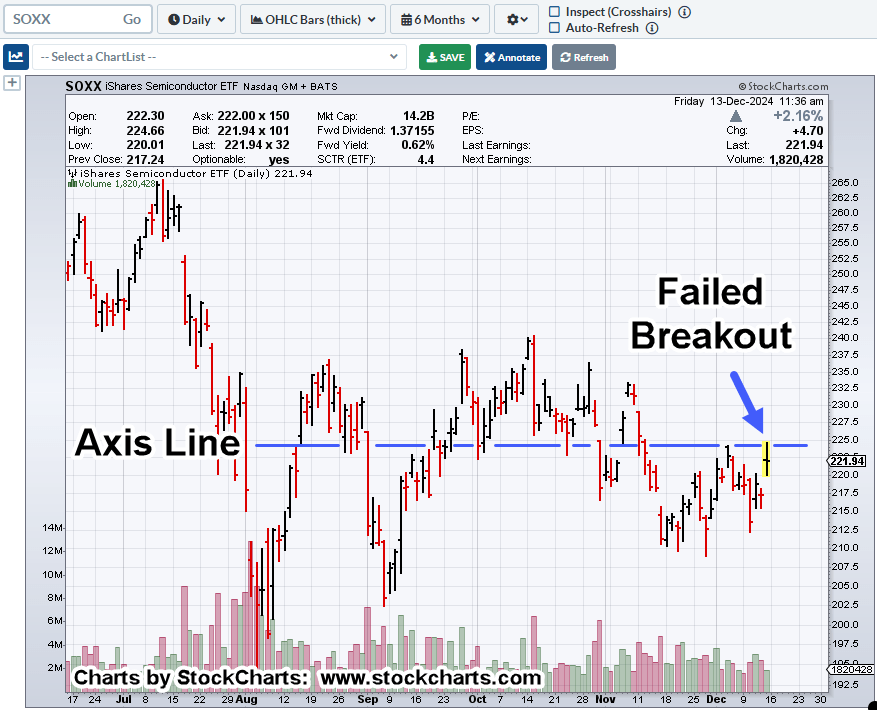
Semiconductors, SOXX, Daily
The bubble trend break discussed here, remains intact.
Any number of notations can be made on this chart.
There’s a downtrend line from the October 15th high (not shown), with today, as the fourth hit on that line.
The low of November 27th, to today, could be classified as ‘spring-to-up-thrust’.
The list goes on.
However, the main point, and to leverage on yesterday’s update, is this:
If the building blocks of economic activity (Basic Materials) are in a (potential) long-term reversal, how are any of these so-called A.I. ‘data centers’ and the associated infrastructure going to be built?
Note: Posts on this site are for education purposes only. They provide one firm’s insight on the markets. Not investment advice. See additional disclaimer here.
Note: Posts on this site are for education purposes only. They provide one firm’s insight on the markets. Not investment advice. See additional disclaimer here.
We’re going to use the chart from yesterday’s post to set the stage for getting closer-in.
This past Friday’s early morning ‘spike’ is barely visible; the 30-minute (inverted) chart below, has more detail.
SPBIO, 30-minute (Inverted)
Price action rejected the lower levels (higher on SPBIO) and pulled away throughout the session. That ‘pulling away’ continued on, all the way into the close.
That’s a clue there may be follow-through at the next session.
If the early session opens ‘gap-higher’ (SPBIO, lower), into the resistance area (four magenta arrows, hourly chart), it would be the fourth time pressuring at this area; markets rarely hold a fourth attempt.
Summary
Of course, other markets are being watched like real estate (IYR), Tesla (TSLA), and even Basic Materials (DJUSBM), a potential sleeper for significant downside.
Updates are planned if/when low risk shows up.
Positions: Current Stance (courtesy only, not advice).
The following is the positioning of my firm’s main (largest) account.
Note: Posts on this site are for education purposes only. They provide one firm’s insight on the markets. Not investment advice. See additional disclaimer here.
With the CPI just released, the article at this link says, ‘the Fed’s work isn’t over.’
They’re so right; but it’s not the work they (at MarketWatch) think it is.
We should all know by now, the truth is right in our faces, but we have to be able to ‘see’.
What was seen yesterday, was that biotech appeared to be reaching an extreme.
As a result of the price action, a change was made in positioning out of (Basic Materials short) SMN and into a biotech short via LABD (not advice, not a recommendation).
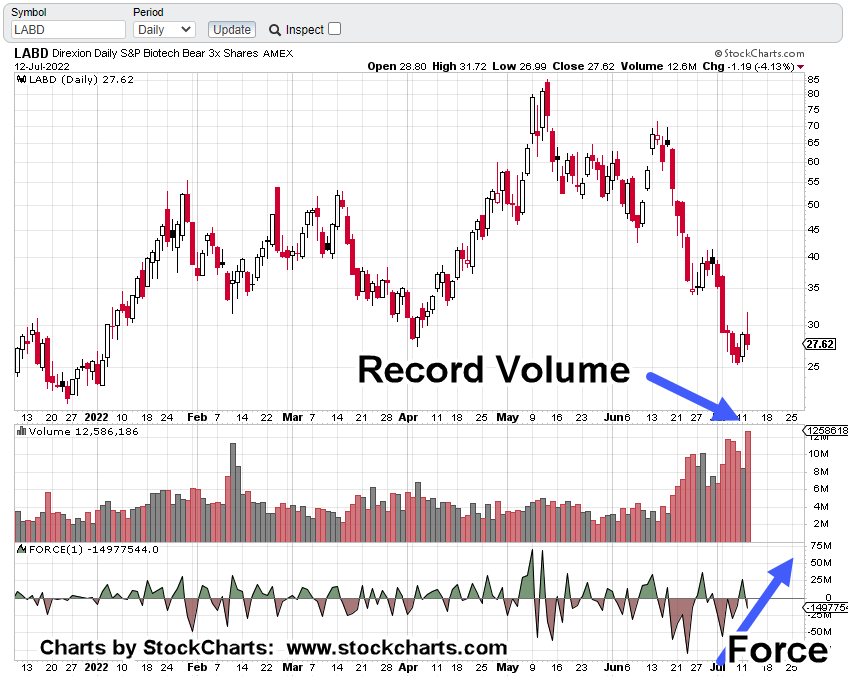
Part of the reason to focus on LABD was the record volume as shown on the chart below.
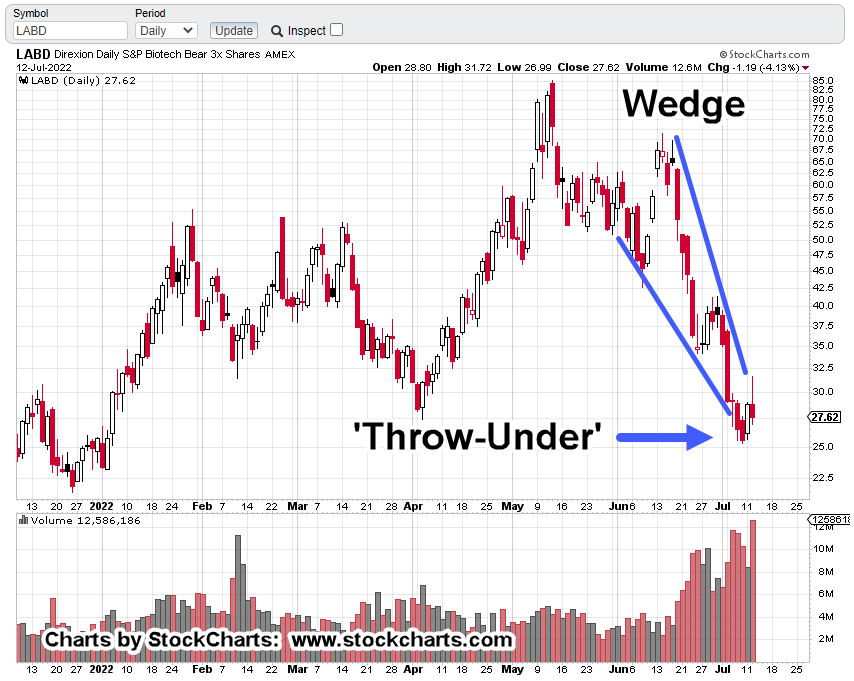
Biotech 3X, Leveraged Inverse LABD, Daily
Note how the Force Index shows downward thrust energy is dissipating … even with the record down volume.
Next, we have the terminating wedge formation; indicating a potential reversal is at hand.
A wedge formation is a typical signal for an up-coming (potential) reversal.
It occurs at the tail-end of a sustained move; meaning a wedge is the last pattern to be formed. Sometimes there’s a throw-over (or under) and sometimes not.
Either way, it’s the end of the directional move.
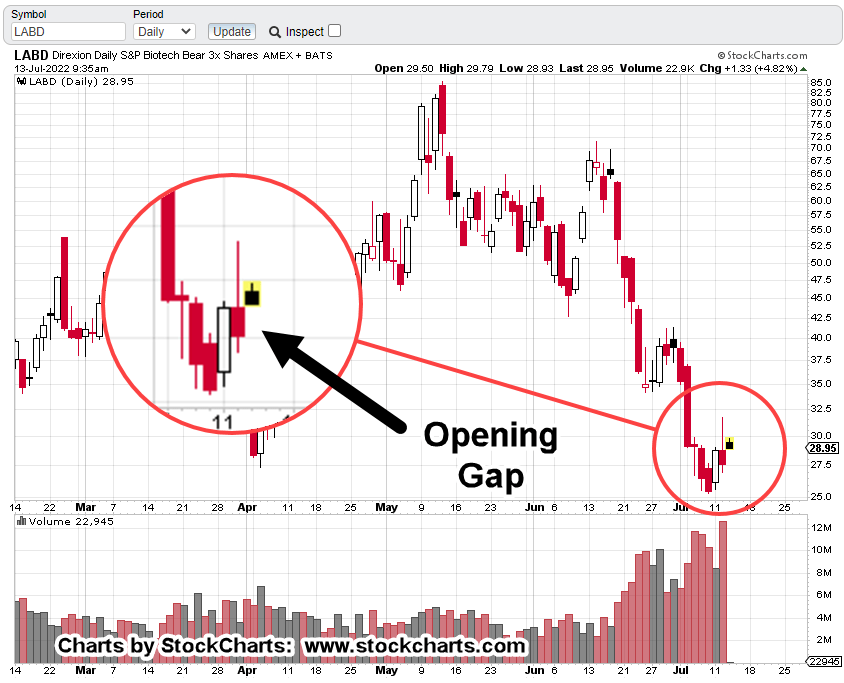
After The Open
We’re just after the open; this is how it looks for LABD.
The first order of business is usually an attempt to close the gap.
As with the prior set-up in YANG, linked here, the objective is to allow LABD, close the gap as much as possible before adding to the existing position, LABD-22-05 (not advice, not a recommendation).
That may happen or not. This market’s already at a pivot extreme.
Note: Posts on this site are for education purposes only. They provide one firm’s insight on the markets. Not investment advice. See additional disclaimer here.
From a strategy standpoint, we’re now ready for the next round of financial destruction.
If we use this article from ZeroHedge, as the pivot point, consumer credit has maxed out.
The consumer (i.e., middle class) is now on the downward slope, just as the layoffs are about to begin in earnest.
Following the typical corporate model, expect job losses (time stamp 15:18) to start slow, then accelerate into December of this year.
The latest employment numbers provide the perfect backdrop to raise interest rates into a declining economy; all going as planned.
Market Response
As is typical, everyone’s focused on the major indices; The S&P 500, Dow, NASDAQ, SOXX, and on.
However, there’s one sector covered in the past, that’s mostly ignored: Basic Materials, with ticker DJUSBM.
That sector has held up until recently; probably because the thinking was, we’re going to have infrastructure projects to keep the economy going.
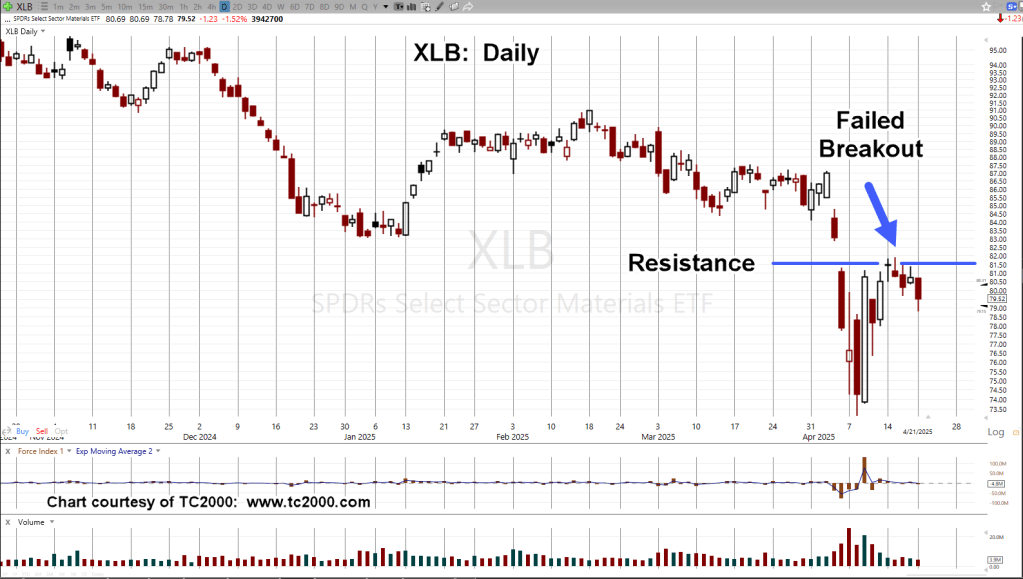
Looks like someone got the memo; Basic Materials has broken down.
As of this past Friday, it’s at a critical point.
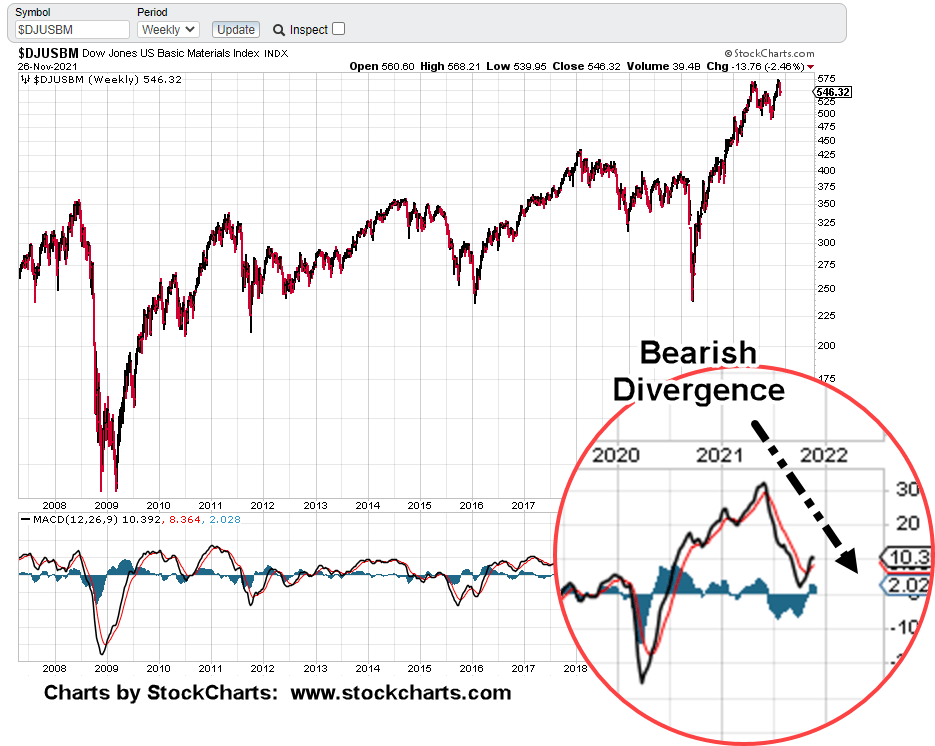
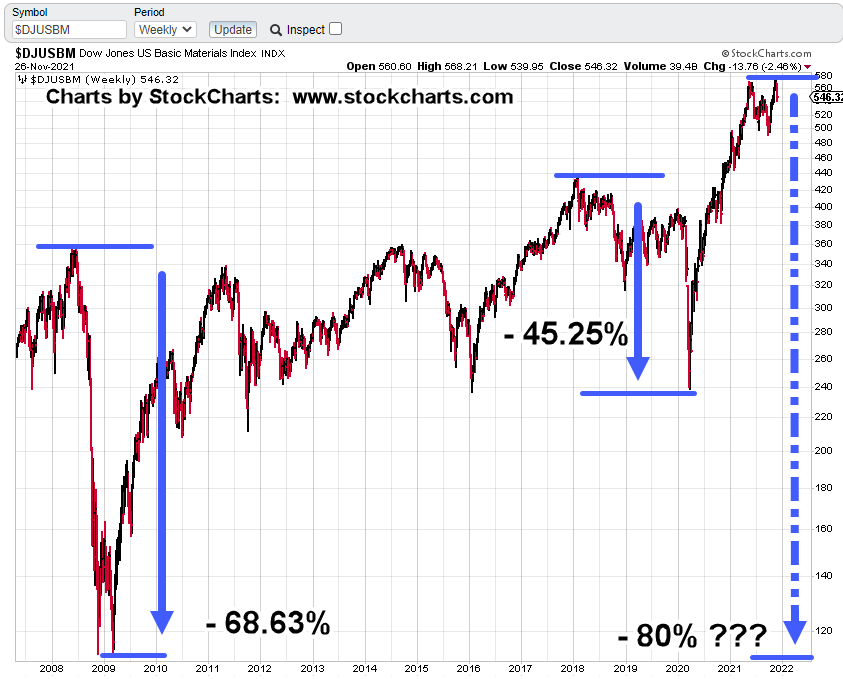
The prior post from last November, does an excellent job of highlighting the divergences (which have only become worse) as well as downside potential.
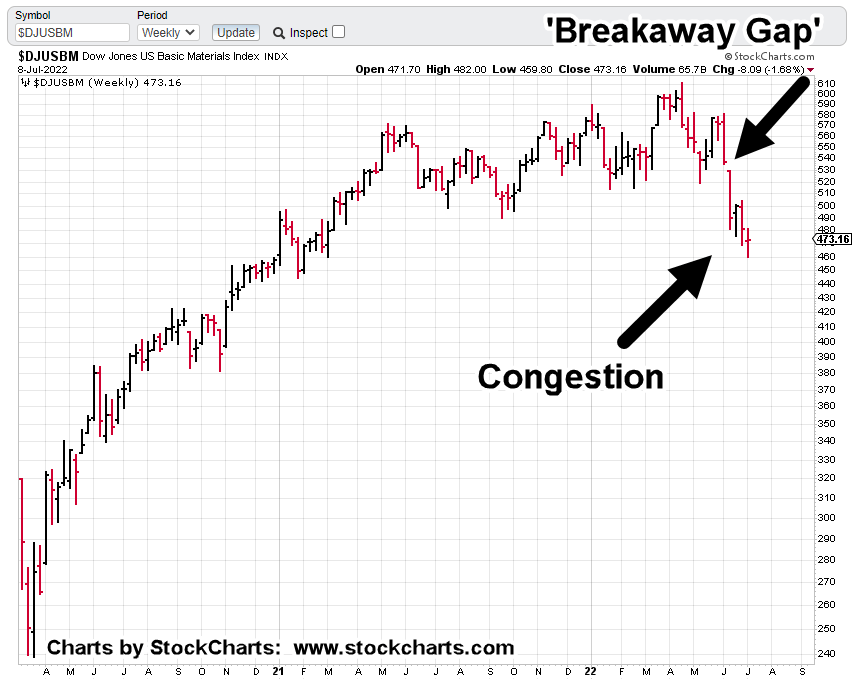
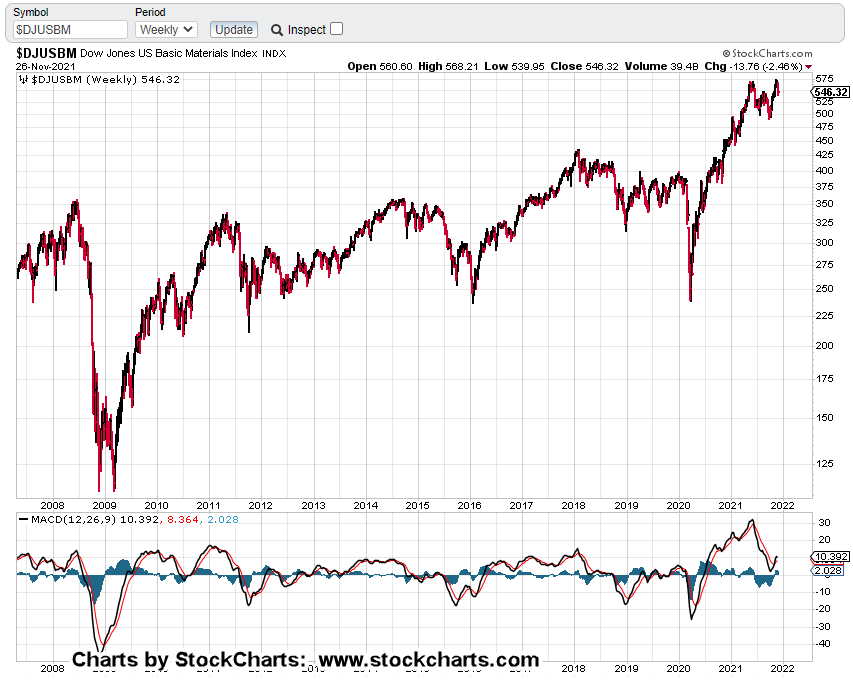
Basic Materials DJUSBM, Weekly
On the chart, we’ve got a breakaway gap that looks like it won’t be filled.
After that break, price action has formed a congestion area over the past three weeks.
However, it’s the congestion area giving us clues; the sector’s set up for an imminent break to the downside.
If that congestion holds true, it’s a stunning revelation of what may be about to happen.
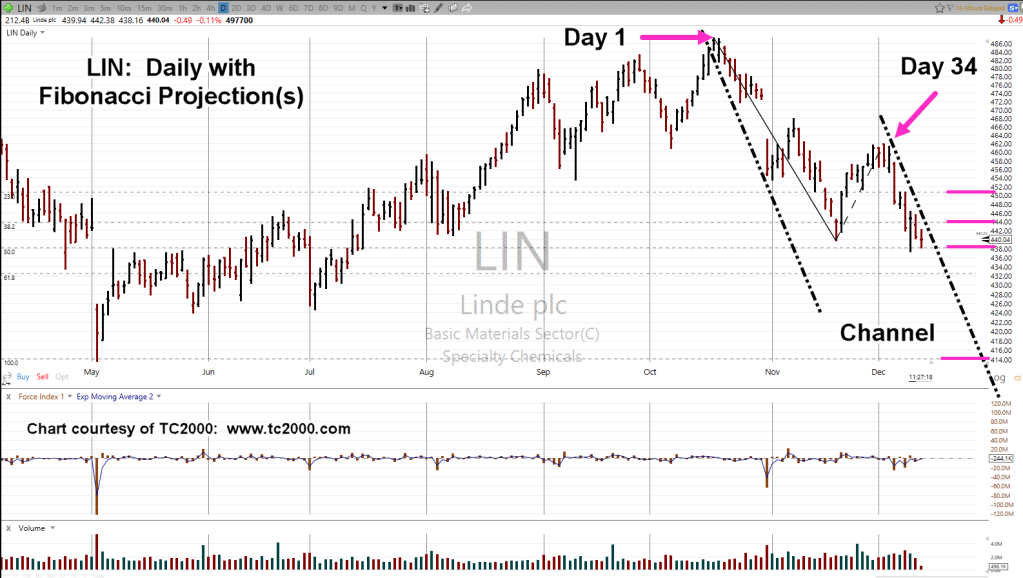
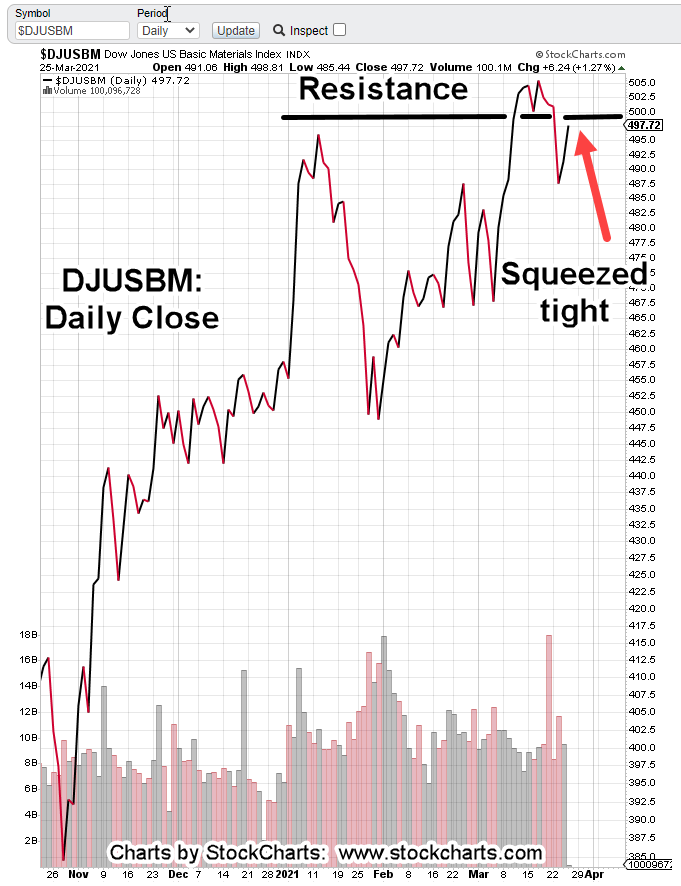
We’ll go to the daily chart and start with a Fibonacci time correlation between pivot points.
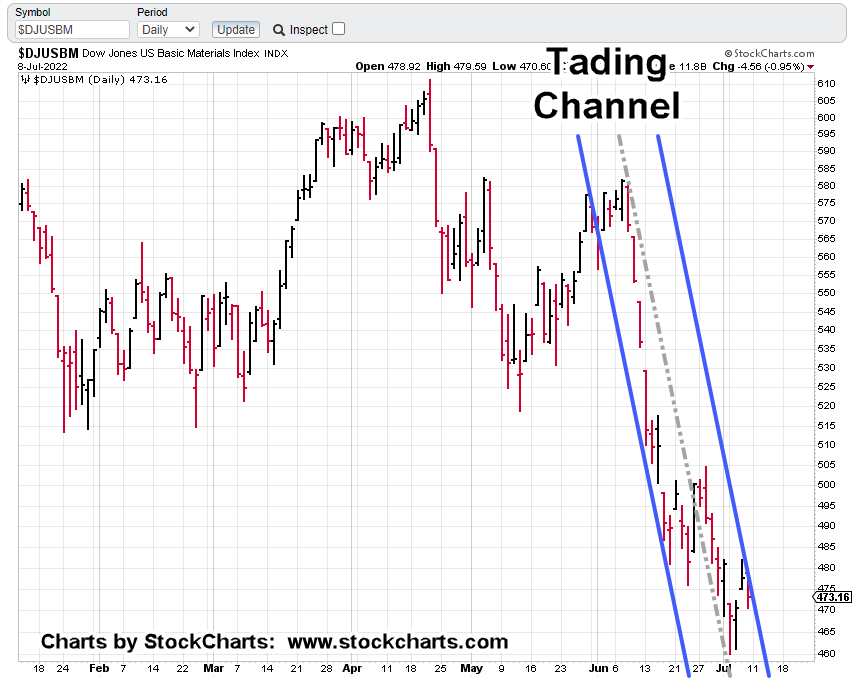
Basic Materials DJUSBM, Daily
Well, it might not look like much.
However, let’s go one step further with another time correlation, shown below.
If you’re reading ahead, then you already know a trading channel has been defined.
The next chart shows the result.
For this channel to confirm Fibonacci ‘Day 21’, Friday’s action had to post lower … and it did.
That lower action also confirms, the channel’s a Fibonacci 13-Days wide.
Even more disconcerting (depending on one’s viewpoint), the channel lines are declining at approximately – 96.5%, on an annualized basis.
It’s not straight down but it’s close.
The next chart has a zoom of the congestion area.
Note how the grey dashed ‘center line’ is perfect in its contact points … further confirmation of the channel.
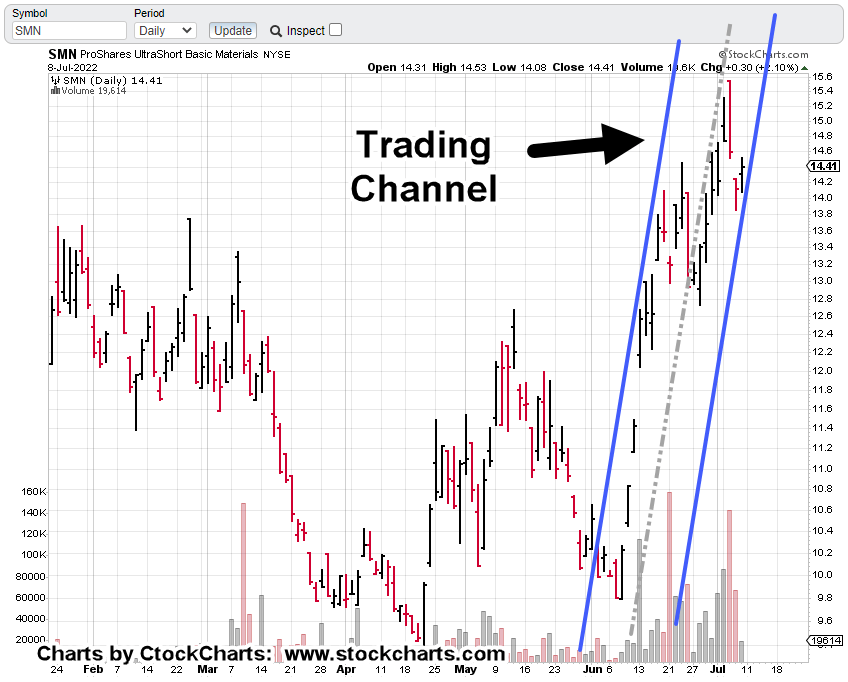
Leveraged 2X Inverse SMN, Daily
Although volume is still light, it has improved dramatically.
On a weekly basis, last week was the second largest trading volume at least going back to the ’07 – ’08, meltdown.
The inverse fund is shown below with the trading channel.
Liquidity is still marginal but has picked up over the last three weeks.
The Week Ahead
Obviously, the expectation for the next open is to post lower for basic materials.
Even with all the analysis, it’s the market itself that’s the final arbiter.
Positioning
As the hyperlink tabs in this post (top-left) show, I’ve positioned one account short the sector via SMN (SMN-22-01), with a stop just below Friday’s SMN, low at around SMN 14.05 (not advice, not a recommendation).
It’s a very tight stop.
The analysis is either in-effect, or it’s not. By this Monday, we’ll find out.
A Decline of Biblical Proportion.
On a strategic basis, we can see how expertly the middle class has been maneuvered into a corner.
For the past two years and probably much longer, that sector has been positioned to not have any recourse when the real decline hits.
We may be there now.
At the same time, if you’re up on Biblical references, you already know that when destruction came, there was always a ‘remnant‘.
The remnant was left to either escape or re-build and was typically 10% of the population.
If you’re reading this, you have already decided at some level, to be part of that remnant.
Note: Posts on this site are for education purposes only. They provide one firm’s insight on the markets. Not investment advice. See additional disclaimer here.
The Danger Point®, trade mark: No. 6,505,279
Active: Short DJUSBM via SMN, as SMN-22-01, stop @ SMN 14.05
However, this fund is not like inverse ETFs; SDS, DXD, SOXS, QID, DUST, and so on.
Basic Materials is not ‘popular’. At least, not yet.
That means the fund is illiquid with larger spreads (bid/ask). In addition, it takes a good few minutes after each open for those spreads to calm down and narrow up.
It’s not for the inexperienced.
Summary:
As we’ll get into tomorrow, ‘normal’, is gone.
There’s not going to be ‘normal’ (a personal opinion) in the lifetimes of anyone reading these updates.
That doesn’t mean there are no opportunities.
Basic Materials, DJUSBM, is about to, or already has (potentially) started its downside reversal.
Note: Posts on this site are for education purposes only. They provide one firm’s insight on the markets. Not investment advice. See additional disclaimer here.
Bonds could be reversing but have already pushed rates high enough (long enough) to choke-off critical sectors of the economy like here and here.
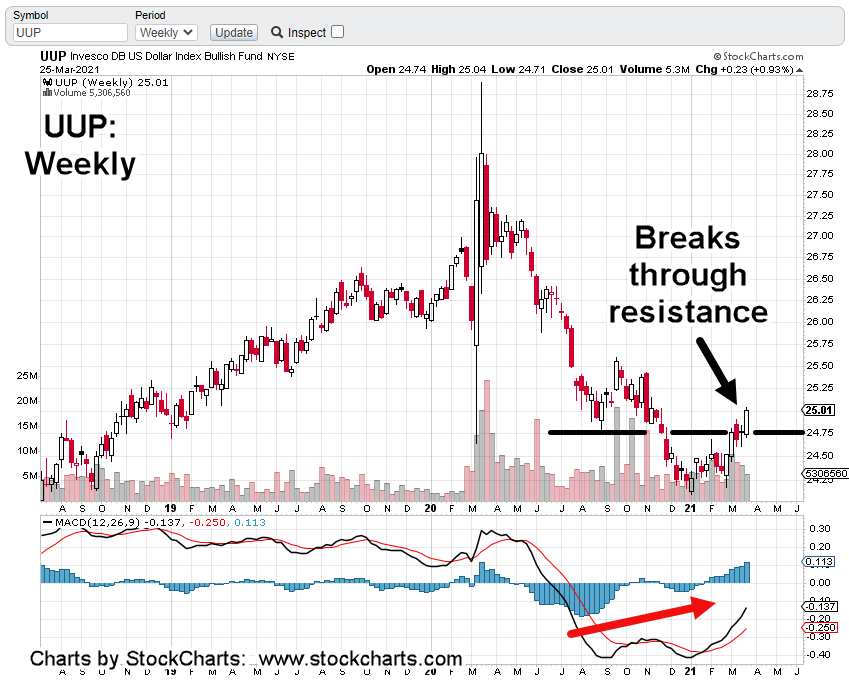
Now we see the dollar has bottomed as well.
It looks like a strong multi-month (or year?) rally. Correspondingly, gold is weak. The overall markets are stretched to ever-livin’ extremes; never before seen.
Whenever this baby pops, try logging on to chaos, or exit any position (except maybe for the long bond).
Our approach then (not advice, not a recommendation), is continue work on positioning short. So far, the ‘project’ is taking small hits in those attempts. We’ll see how basic materials (SMN) works out today.
Note: Posts on this site are for education purposes only. They provide one firm’s insight on the markets. Not investment advice. See additional disclaimer here.
Note: Posts on this site are for education purposes only. They provide one firm’s insight on the markets. Not investment advice. See additional disclaimer here.