What Happens, When It Doesn’t Happen?
‘The truth has no defense against the man determined to believe a lie.’
Unknown
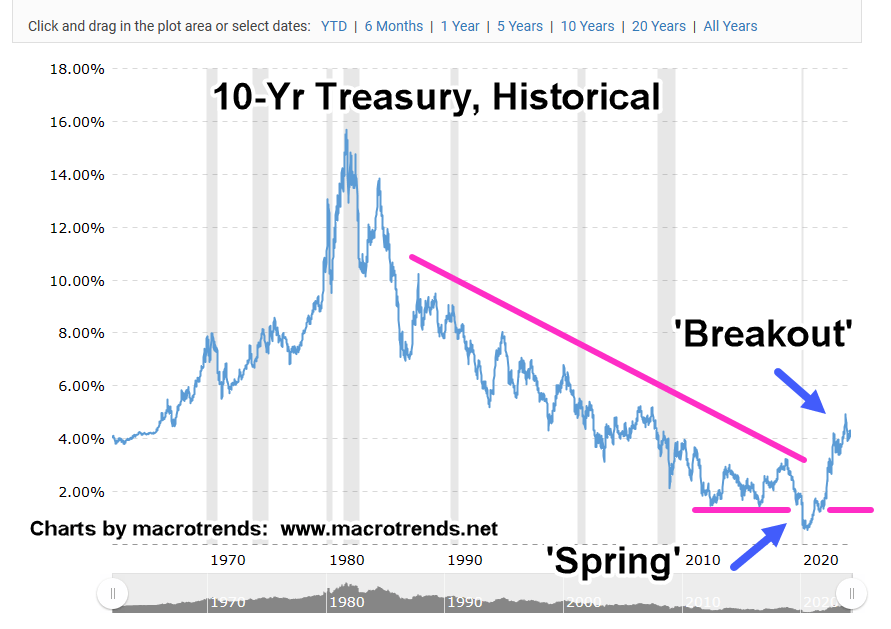
It’s been proven many times on this site and by others more notable (i.e. Prechter), the Fed is not a leader.
They are followers; essentially reacting (not responding) to what the bond market is telling them.
Done Deal? … Not Yet
The financial press acts like a rate cut is a done deal.
However, when looking at the chart (i.e., the real leader), long bond proxy TLT, it makes perfect sense the Fed would propose a cut at the September 17 – 18, meeting.
It’s what happens between now and then, that’s important.
For clues as to what that ‘then’ could be, we go to the bond market itself.
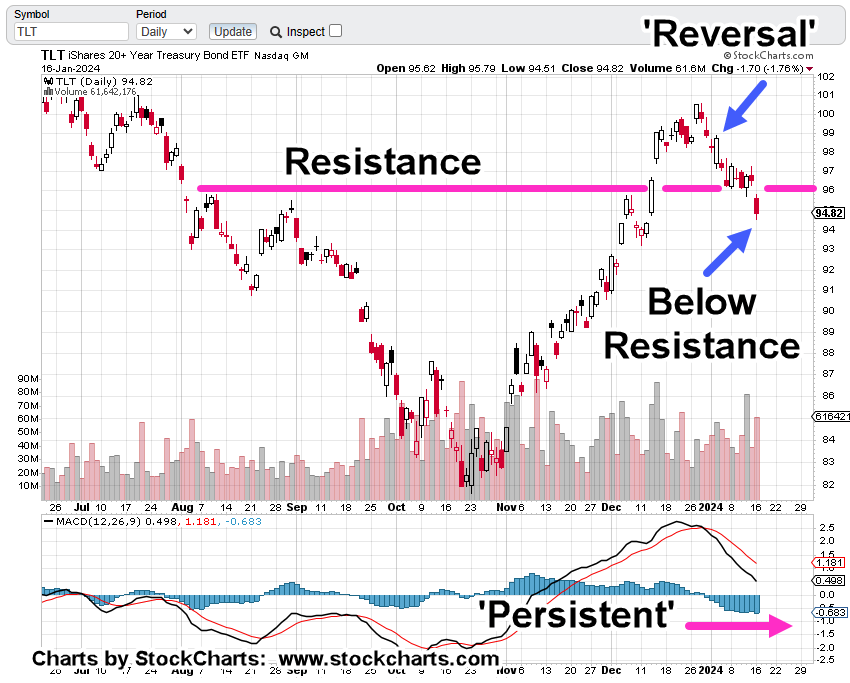
Long Bond Proxy, TLT, Daily
“What do you see?”
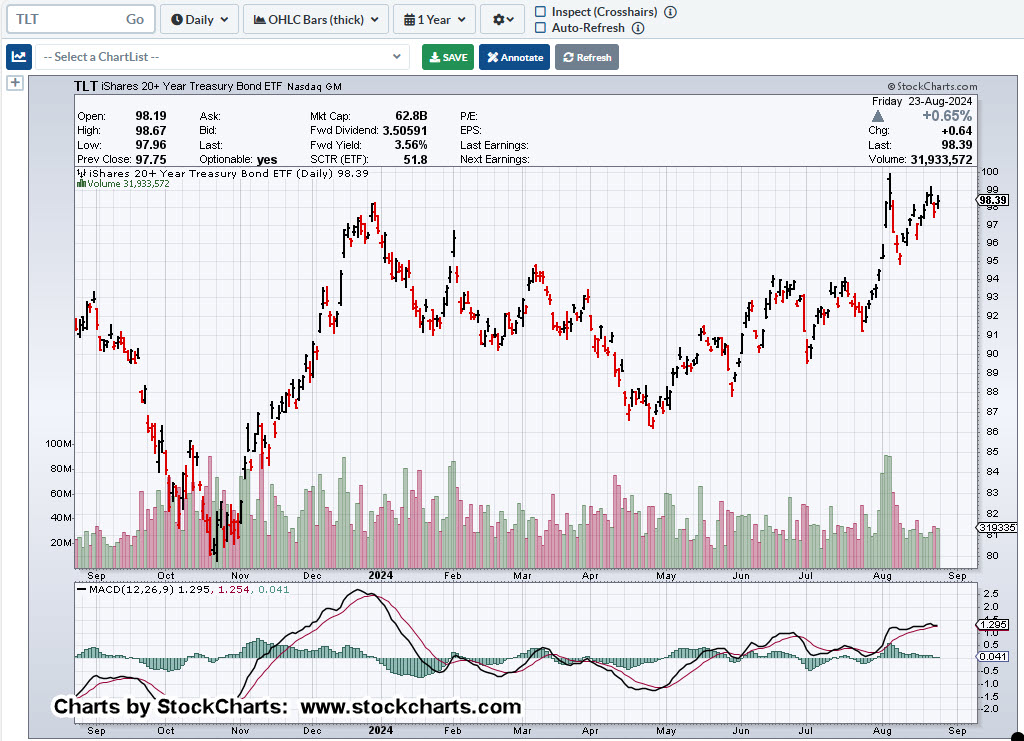
There’s a lot going on in this chart; the mark-up (below) is divided into two.
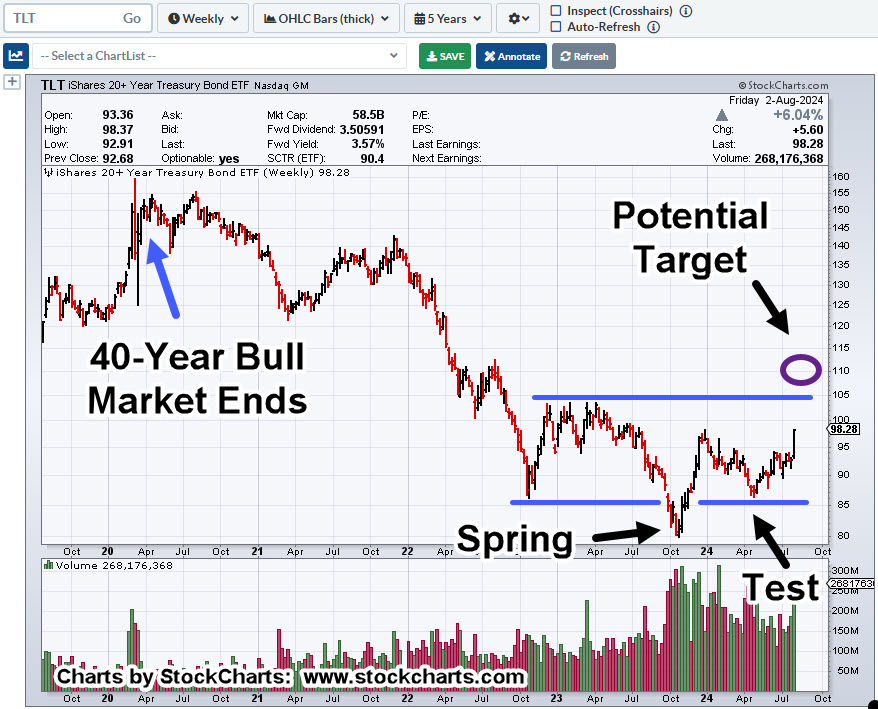
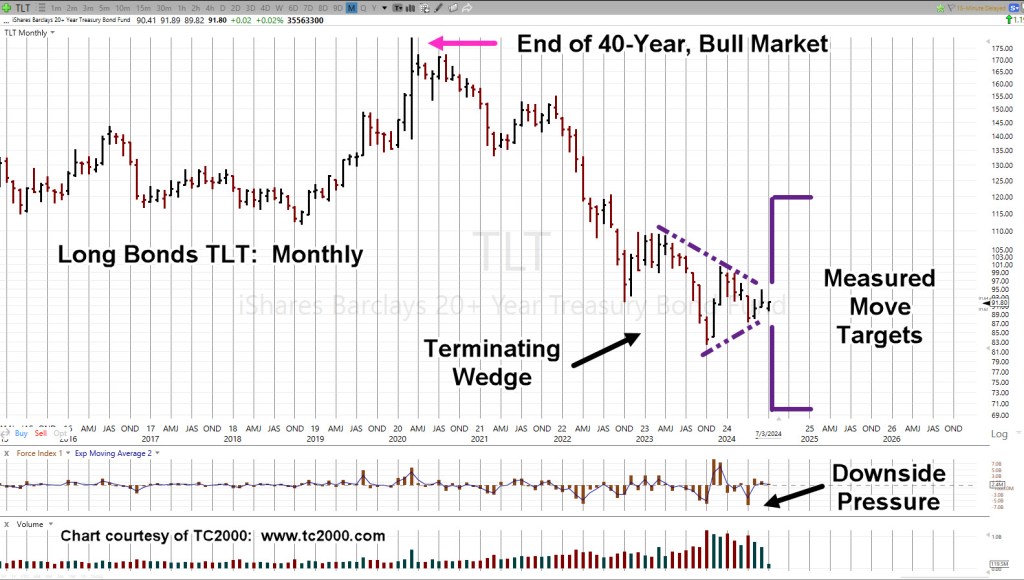
First, is the targeted measured move (that’s been met) out of the wedge formation (not advice, not a recommendation).
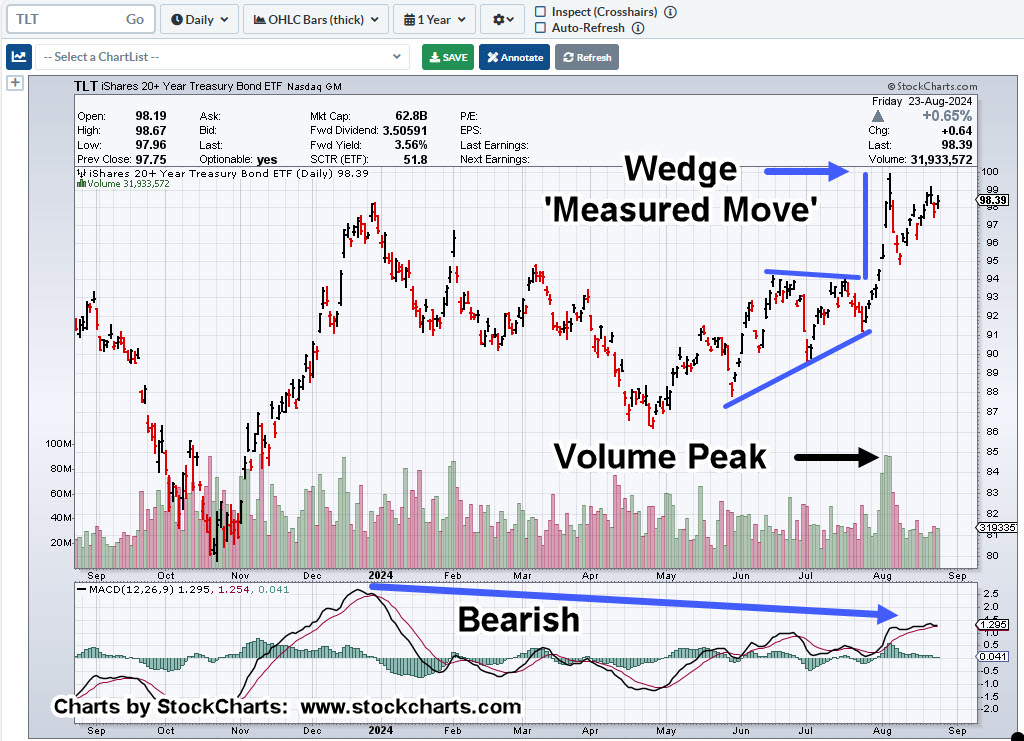
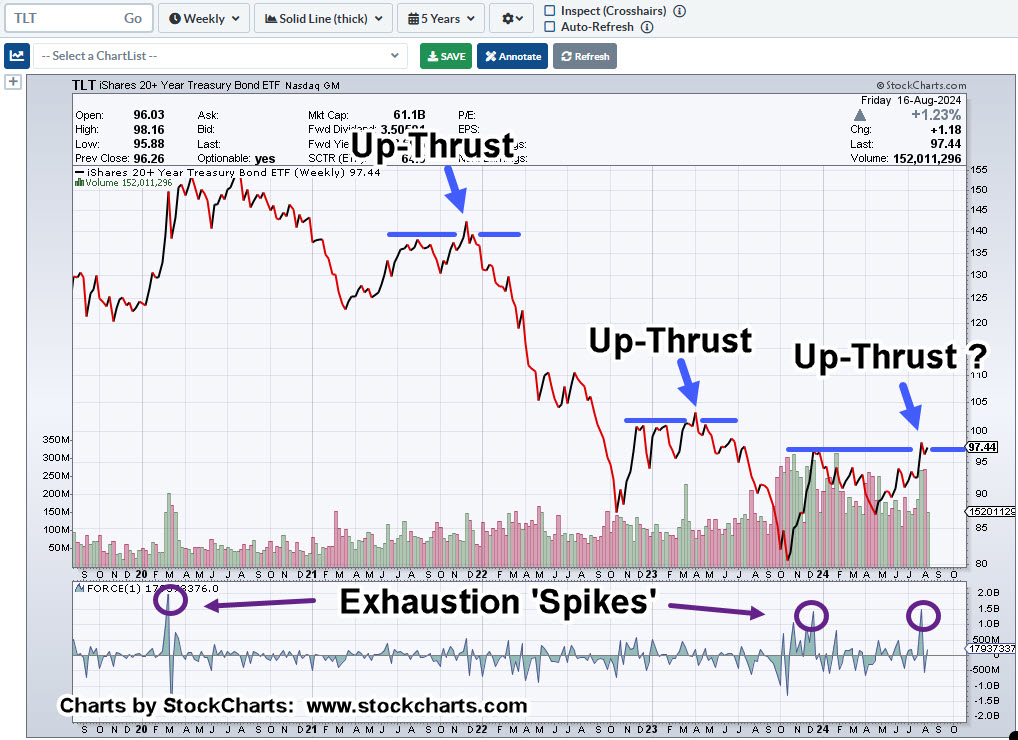
Next, we’re also in a Wyckoff Up-Thrust condition which may have been tested on declining volume, this past week (not advice, not a recommendation).

At this juncture, it’s not unreasonable to say bonds (TLT) are at The Danger Point®
It would appear, the weight of a feather could move prices either way.
The interesting part will be what comes next; Sunday overnight Futures open, is about nine-hours away …
Stay Tuned
Charts by StockCharts
Note: Posts on this site are for education purposes only. They provide one firm’s insight on the markets. Not investment advice. See additional disclaimer here.
The Danger Point®, trade mark: No. 6,505,279