This Time’s Not Like Last Time

The market’s down; bonds down at the same time.
Wait, what?
If the Fed does not lower rates, then bonds risk a reversal to the downside (not advice, not a recommendation).
Of course, no one expects that to happen. No one.
Well, maybe there’s at least one, link here:
‘No pivot anywhere in sight.’
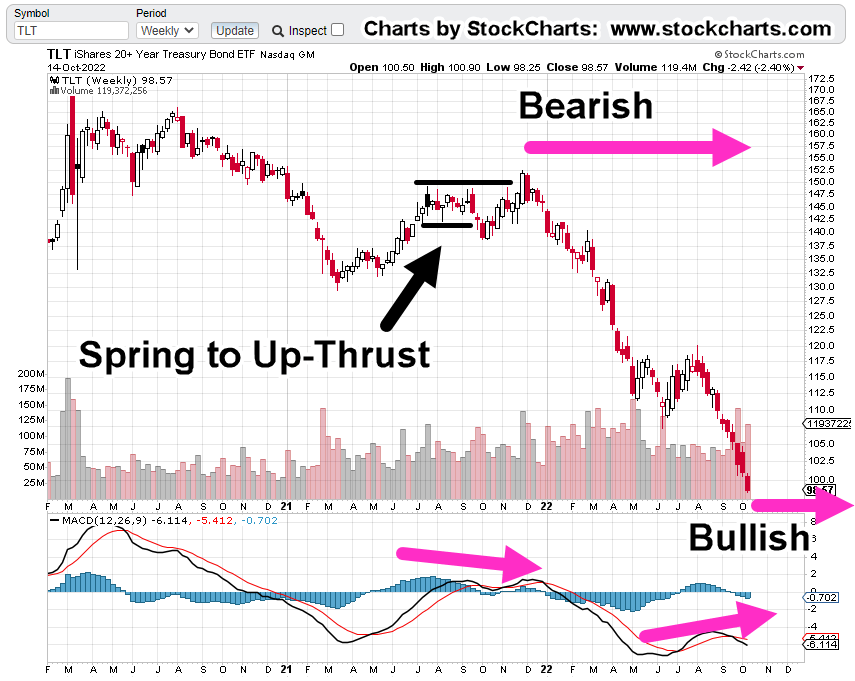
Bad News, Bonds
It gets worse when looking at TLT. As we’ll see below, the chart has a (potential) repeating set-up, link here.
Long Bond Proxy TLT, Daily

The set-up is not complete and may well diffuse into nothing.
However, if it does not and we get back below the magenta resistance line, there’s likely to be some serious confusion in the markets.
Wyckoff said a century ago, those incorrectly positioned in the market, provide the fuel (as they panic and exit) for a directional move.
Just think about who’s (potentially) on the wrong side and what side that is, i.e., the bullish side.
Stay Tuned
Charts by StockCharts
Note: Posts on this site are for education purposes only. They provide one firm’s insight on the markets. Not investment advice. See additional disclaimer here.
The Danger Point®, trade mark: No. 6,505,279