Most of the major indices finished higher today except for the miners, real estate and biotech.
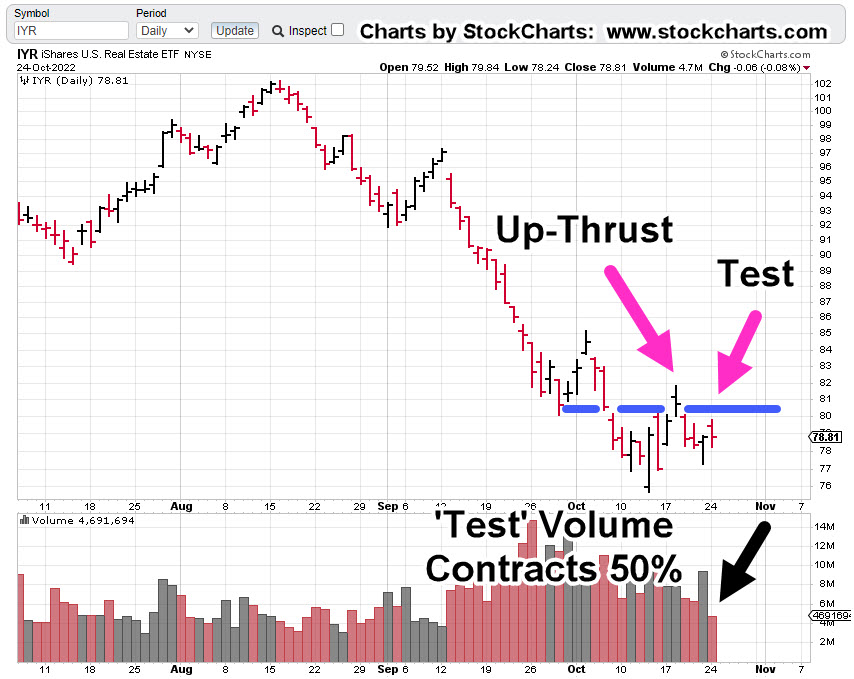
The early session update said IYR, price action may be in a test of its up-thrust (reversal) from October 18th.
If that’s a valid assessment and it was a test, the volume is important.
Whether it’s an up-thrust or a spring, when the set-up gets tested, the volume gives additional clues.
What we’re looking for is when price action comes back to test, volume contracts.
If that happens, it means (with good probability) there’s no commitment to sustain prices at the test level.
Real Estate IYR, Daily
The real estate situation may be about to get interesting.
Volume contraction is near-textbook.
This is one of the rare times, there’s a high probability expectation; that is, IYR price action resumes its downtrend (not advice, not a recommendation).
Note: Posts on this site are for education purposes only. They provide one firm’s insight on the markets. Not investment advice. See additional disclaimer here.
We’re going to use the chart from yesterday’s post to set the stage for getting closer-in.
This past Friday’s early morning ‘spike’ is barely visible; the 30-minute (inverted) chart below, has more detail.
SPBIO, 30-minute (Inverted)
Price action rejected the lower levels (higher on SPBIO) and pulled away throughout the session. That ‘pulling away’ continued on, all the way into the close.
That’s a clue there may be follow-through at the next session.
If the early session opens ‘gap-higher’ (SPBIO, lower), into the resistance area (four magenta arrows, hourly chart), it would be the fourth time pressuring at this area; markets rarely hold a fourth attempt.
Summary
Of course, other markets are being watched like real estate (IYR), Tesla (TSLA), and even Basic Materials (DJUSBM), a potential sleeper for significant downside.
Updates are planned if/when low risk shows up.
Positions: Current Stance (courtesy only, not advice).
The following is the positioning of my firm’s main (largest) account.
Note: Posts on this site are for education purposes only. They provide one firm’s insight on the markets. Not investment advice. See additional disclaimer here.
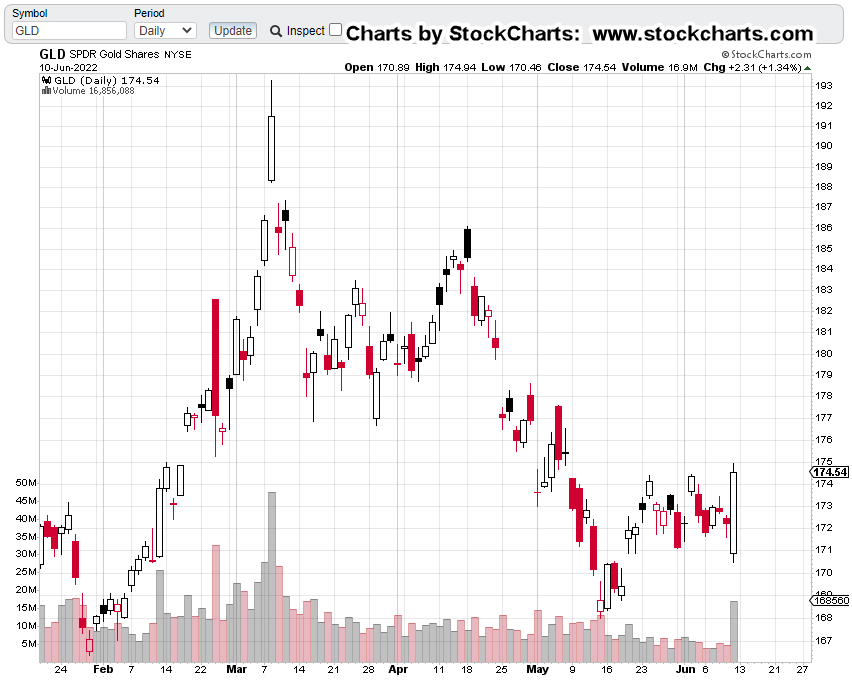
What kind of idiot would think that gold (GLD) is going lower?
Well, for starters, it’s not what one ‘thinks’ that’s important.
Way back, when I was being mentored by the late David Weis, he never started our sessions with ‘what do you think’.
No, he always started by presenting a chart and then asking (and I quote), “What do you see?”
It was never ‘what’s the Fed doing’ or ‘what’s Cramer saying’ (that’s an easy one), or ‘what are earnings’ or any other number of useless, distracting rabbit-holes.
“What do you see?”
With that, we’re going to look at the long-term chart of gold (GLD) on a weekly close basis.
Gold (GLD) Weekly Close
With the passing days, weeks and now months, we can see there’s been a significant, potentially long-lasting reversal to the downside.
The prior report linked here, contains no fewer than seven other links to gold (GLD) that identified ‘changing of hands’ in various stages as it transpired.
Slow Motion Train-Wreck
So far, events in gold have been moving slowly and thus hypnotizing the gold bulls.
It was nearly two-years (20-months) between the Wyckoff Up-Thrust high (8/6/20), and the test of that high (3/8/22).
Enough time to put everybody to sleep.
At this point, GLD is back down near support levels … another bounce higher is not unreasonable.
However, it’s trading in a downward channel (not shown) that’s declining at approximately – 30%, annualized.
The above linked report presents long-term downside targets for GLD (not advice, not a recommendation).
The ‘Event’
As Pinball Preparedness puts it, each day that passes brings us one day closer to ‘the event’.
None of us in the proletariat know what the event will be.
Note: Posts on this site are for education purposes only. They provide one firm’s insight on the markets. Not investment advice. See additional disclaimer here.
According to this, just out on ZeroHedge, that’s what’s happened.
As we’ll see below, there’s certainly something unprecedented going on, specifically in biotech.
The prior update made the argument, biotech SPBIO, has a unique distinction that’s showing up on the leveraged inverse fund LABD, shorting the sector.
For illustration purposes, we’re going to do a little ‘trick’.
The weekly close of SPBIO, is shown below.
This index does not provide volume but we’re going to ‘fix’ that by putting in the lower panel, weekly volume for leveraged inverse fund LABD.
It’s clear, as SPBIO reached all-time highs and reversed, short activity via LABD picked up significantly.
However, the past several weeks tells us from a Wyckoff perspective, something major could be about to happen.
As SPBIO, has moved counter-trend higher, activity going short (via LABD) has gone off the scale.
Spring-To-Up-Thrust
If the unprecedented volume activity weren’t enough to draw attention, we also have a repeating set-up that’s well, repeating; Spring-to-Up-Thrust.
With the idea originally obtained from the late Daivd Weis, later confirmed time and again, it’s a unique (high probability) characteristic of market behavior.
That’s where we are now.
SPBIO: Up Close & Technical
It may be hard to see in the above chart.
The next one, moves closer-in.
The upward advance of SPBIO slowed dramatically last week, closing up just +1.68%, for the week.
Contrast that move with the week prior at +13.83%, and the slowdown is evident.
All Hands, On Deck
Figuratively speaking, everything’s been dropped to focus exclusively on this sector. It’s obvious, what’s going on at this juncture is unprecedented.
That goes for the rest of the markets as well.
However, this sector alone, is telling us to ‘look here’; potentially setting up for a major reversal.
Note: Posts on this site are for education purposes only. They provide one firm’s insight on the markets. Not investment advice. See additional disclaimer here.
And so it was. Short position in real estate, closed out.
Even with all the analysis, real estate (IYR) has pushed higher. The short position via SRS (SRS-22-01) was exited just below the stop @ SRS 16.33.
Exiting a trade, frees the mind to look elsewhere for opportunity.
Typically, one would have to wait days or even a week or so for something else to be available.
However, despite appearances, the market is moving very fast at this juncture.
Looking around in those markets, we have a textbook entry signal (to go short) the FXI (not advice, not a recommendation).
David Weis & The Video
Many times, on this site (actually, for years), the Weis video has been recommended.
Next to Wyckoff’s treatise from 1910, Studies In Tape Reading, that video is probably the most important one could ever watch concerning the markets.
In it, he describes a ‘trick’ as he calls it, to get aboard a market that’s already underway. At the time, his discussion was using DE (if memory serves), as the trading vehicle.
That ‘trick’ is highlighted below on FXI
China Index FXI, Daily
This is how the chart looks early in today’s session.
Next, we’re going to invert the chart to mimic what’s seen on leveraged inverse fund YANG.
And now, the signal zoomed-in
The above price action is nearly exactly as presented in the Weis video; even though it was recorded fifteen-years ago.
The above signal is not a guarantee.
It is, however, a high probability low risk set-up (not advice, not a recommendation).
The entry signal was triggered at approximately YANG 11.75, with a stop at YANG 11.02, for a ‘risk’ of 0.73/share (not advice, not a recommendation).
Summary
As this post is being created, YANG is retracing and is currently trading near 11.67, narrowing the distance from any potential entry to the stop.
On a very long term (Monthly) basis, there are interesting things happening in FXI. We’ll be covering that soon in another update.
Note: Posts on this site are for education purposes only. They provide one firm’s insight on the markets. Not investment advice. See additional disclaimer here.
The Danger Point®, trade mark: No. 6,505,279
Active: YANG (YANG-22-02), entry @ 11.83, with stop @ 11.30
Is this trade set-up still viable and/or worth the pursuit?
Short answer (at this point) is yes, and yes.
We’re going to look at the tape (the chart) and let it tell us what’s happening from a Wyckoff analysis perspective.
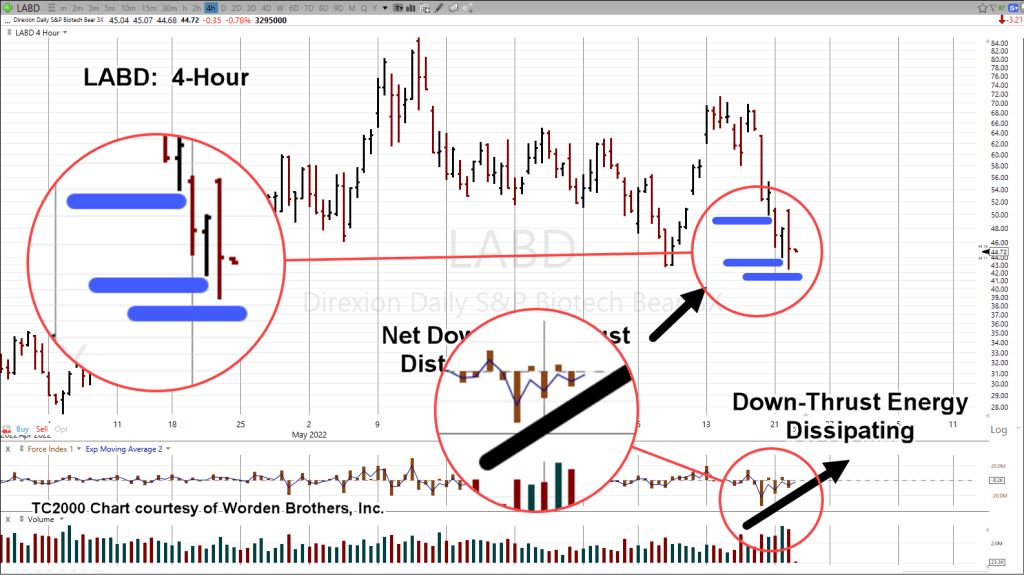
Since we’ve just past mid-session (12:37 p.m. EST), we’ll use the 4-Hour chart.
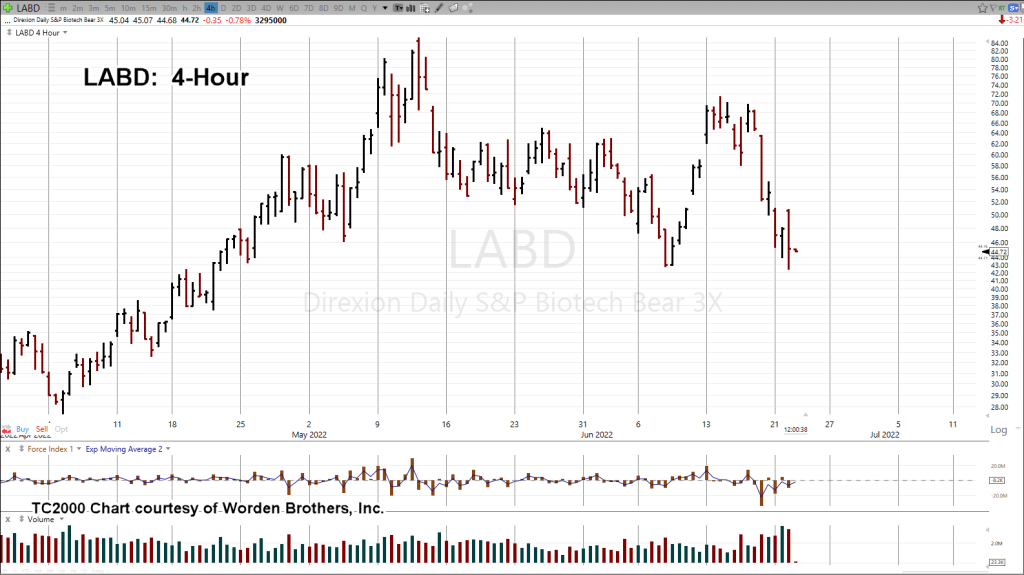
Biotech SPBIO, Leveraged Inverse LABD: 4-Hour
The unmarked chart above, looks like a mess.
Volatility everywhere in the past four sessions; including the Fed announcement on June 15th.
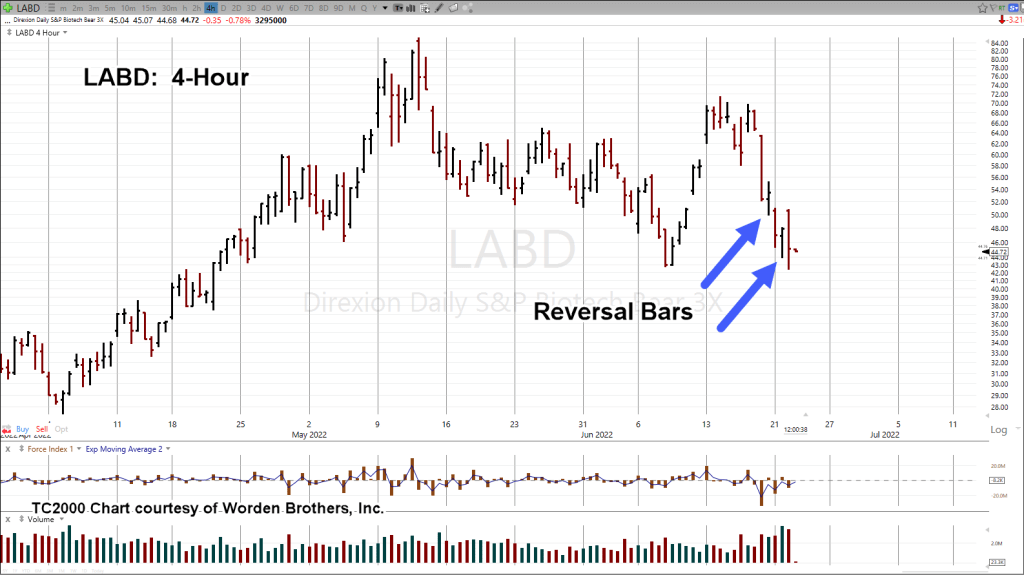
The marked-up chart below shows two distinct 4-Hour reversal bars.
Each of those bars were subsequently penetrated to the downside thus negating any entry signals.
However, it’s the next chart that draws from the secrets of Wyckoff analysis.
That is, “Shortening of the thrust”.
Discussed by David Weis in his training video, when thrusts become shorter, probabilities favor we’re nearing the end of the move.
As shown below, net downward thrusts on the chart have narrowed significantly.
Note that each downward thrust has successively less energy as shown on divergence of Force Index.
The next chart zooms-in.
Positioning
Based on the above, as much as price action gives the appearance of moving lower for LABD (higher for SPBIO), the energy to do so, appears to be spent.
Obviously, the accounts being managed have gone through a draw-down over the past trading sessions.
One account was stopped out @ 44.58 and then re-positioned at 44.01. The other account was allowed to draw down (not advice, not a recommendation).
The LABD-22-04, trade remains intact.
Summary
If the trend remains down for SPBIO, it’s highly unlikely the index will make new daily highs beyond this session.
If it does, then we can consider the trade set-up invalid.
A reasonable stop location at this point for inverse LABD, would be near or below the lows for the day (thus far), currently @ 42.37 (not advice, not a recommendation).
Note: Posts on this site are for education purposes only. They provide one firm’s insight on the markets. Not investment advice. See additional disclaimer here.
Note: Posts on this site are for education purposes only. They provide one firm’s insight on the markets. Not investment advice. See additional disclaimer here.
It’s been a while since we’ve talked about the chief cook and bottle washer in this whole financial collapse scenario.
However, biotech has not been forgotten.
There are two indices (ETFs) being tracked: IBB and SPBIO.
Both entered bear market territory long ago. SPBIO topped out, way back in February 2021; IBB topped later, in August the same year.
Leveraged inverse funds are LABD, and BIS, respectively. LABD is 3X inverse with BIS a 2X inverse.
The Long Term
One thing unique to David Wies, was to look at the long term: Monthly, Quarterly and Yearly charts.
Doing so, puts one in a strategic mindset … not easily swayed by the latest prattle from media sources.
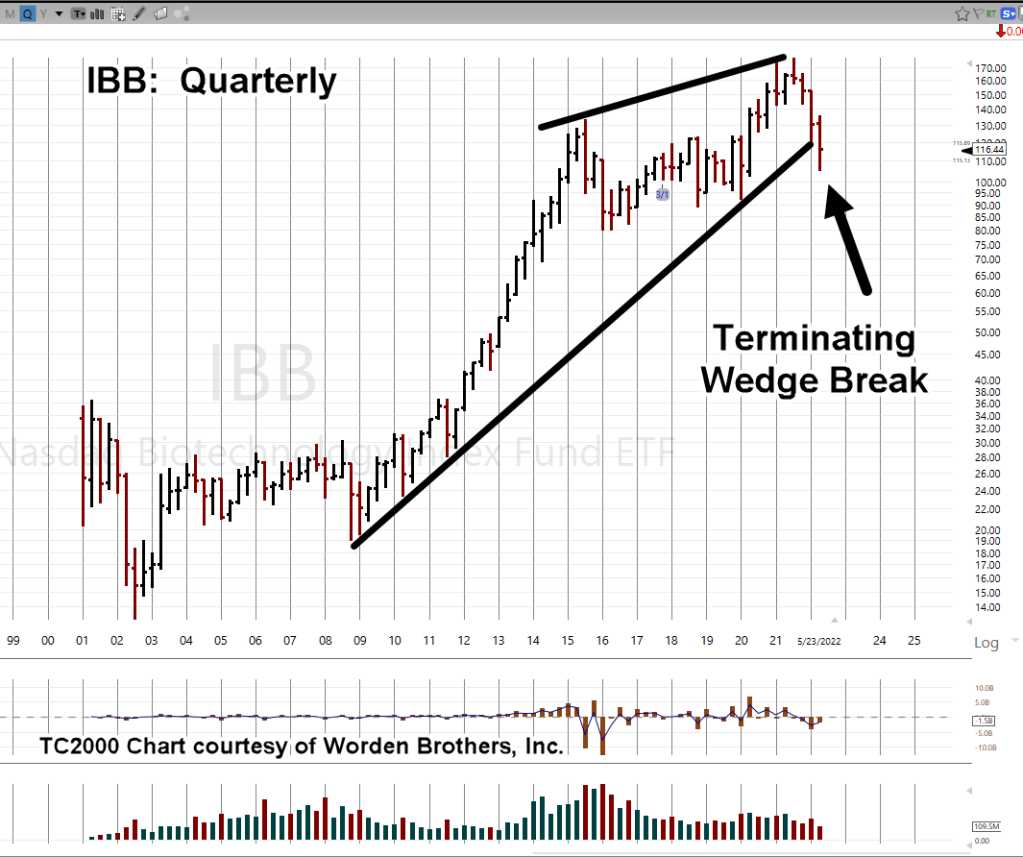
If we look at biotech, IBB, on a quarterly basis we have the following chart.
Biotech IBB, Quarterly
The mark-up of this chart is where it gets interesting.
A terminating wedge that’s been over seven years in the making has just broken to the downside.
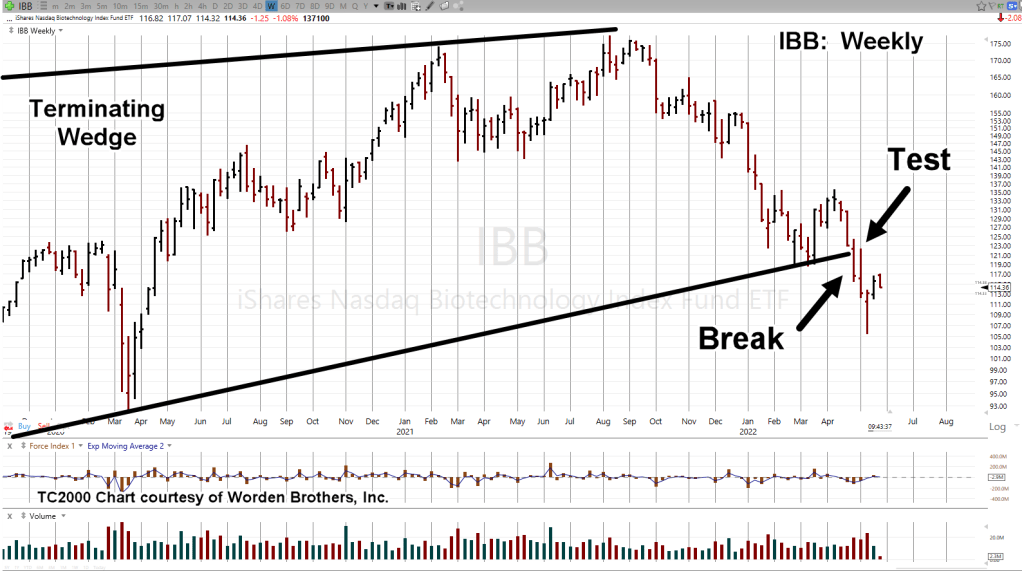
Not only that, when we get closer-in (on the weekly), we can see the wedge break has been tested and now today, appears to be reversing to the downside (shown on daily).
Biotech IBB, Weekly
With zoom
The daily shows a Fibonacci retrace to 38%; then today, a downside reversal.
You can see where this is going.
Based on the above analysis a short position in IBB, has been opened via BIS (not advice, not a recommendation).
The trade is BIS-22-01, with an (initial) entry @ 28.5173
Summary
The news on specific biotech companies is already out if one knows where to look.
Stated time and again on this site, we’re just in the beginning stages of the repercussions.
It even looks like they’ve moved on from the initial scam and are cooking up a new one.
Note: Posts on this site are for education purposes only. They provide one firm’s insight on the markets. Not investment advice. See additional disclaimer here.
Using a method presented by the late David Weis in his training video (still available, linked here), we’re going to look at specific days on the daily chart of IYR, shown below.
In brief, the method looks at price action (and volume) on specific days, then formulates an assessment using Wyckoff analysis, on next move probability.
Real Estate, IYR, Daily
This is how it looks with no markup. Force Index, shown in the lower panel.
We’re going to address each numbered bar of the price action shown.
No. 1
Price action penetrates resistance (blue line) on moderate volume and posts a sharp upward spike on Force Index.
Such action can be labeled as a breakout or up-thrust (potential reversal) position.
No. 2
After hovering and then testing the breakout resistance/support level, price action attempts to pull away and move higher … but it’s unable to close higher and volume contracts.
Force Index as a result, posts a significantly lower peak than three trading sessions, prior.
This is the first sign of trouble to the upside.
No. 3
Three sessions later, IYR attempts to move higher again.
This time it’s able to close higher but volume contracts again and posts a lower Force Index.
This is the second sign of trouble to the upside.
No. 4
Five sessions later after IYR comes back down to resistance/support there’s another attempt to move higher.
This time, the range has narrowed while volume increases and subsequently posts yet another lower peak on Force Index.
Narrow, labored upside action with increasing volume suggests the market’s under distribution.
Summary
The day before price action bar No 4., this post was created to indicate real estate IYR, may be in position for downside reversal.
On the day labeled No. 4, a short position was opened via leveraged inverse fund DRV as DRV-22-01, with current stop at last Thursday’s DRV low of 32.64 (not advice, not a recommendation).
Heading Into Monday
The futures market is now about one hour into the Sunday night session.
The S&P is trading down 15 – 16 points or about – 0.36%.
Let’s see if that negative bias carries over to the Monday open.
Note: Posts on this site are for education purposes only. They provide one firm’s insight on the markets. Not investment advice. See additional disclaimer here.
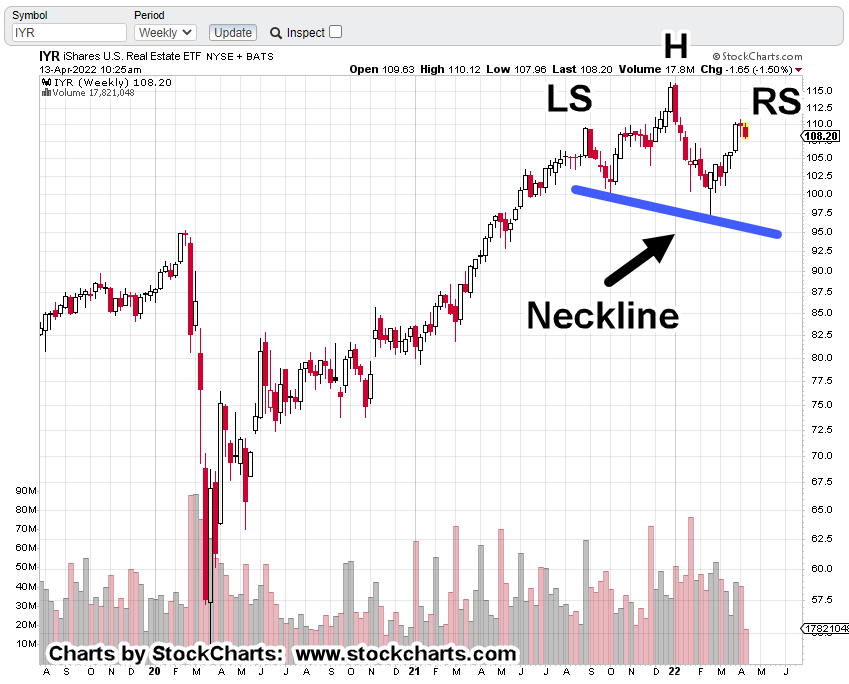
The Head & Shoulders pattern on the weekly chart of IYR, could mean reversal ahead.
Price action’s been attempting to move higher over the past twelve trading days.
‘Attempting’, because it’s not making any significant net progress.
Essentially, we’ve got what’s called ‘evidence of a struggle’ where the bulls may be exhausting themselves.
The last update on bonds (TLT), said they’re at the danger point where an upside reversal was possible.
That update also said:
“At this juncture, there’s either a reversal and much higher levels or down, with rates higher; in turn, leading to the subsequent collapse of real-estate, a-la 2007 – 2008.“
Since then, bonds are lower, rates higher. Housing affordability has collapsed.
Real Estate, IYR, Weekly
At this point it’s a clear H&S, pattern.
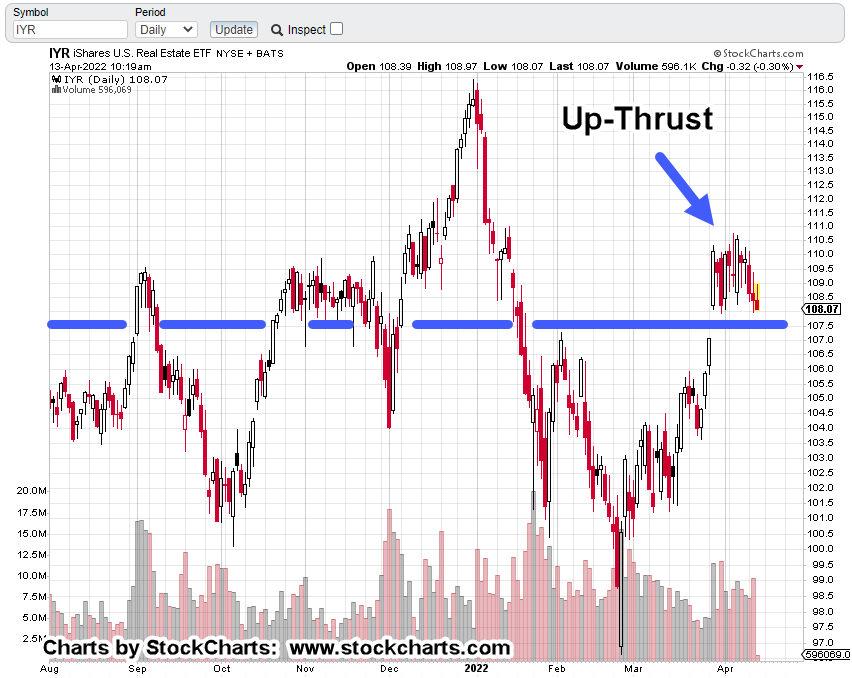
The daily chart shows IYR, oscillating around an axis, support/resistance line; struggling to move higher (in up-thrust condition) with no real progress.
As with bonds in the April 3rd, update, we’re at the danger point with IYR.
A decisive move below the axis (blue) line would indicate the bulls may be exhausted.
Because price action’s been in this range for over two weeks, lends support to the possibility any breakdown (or breakout higher), may be a sustained, directional move.
Note: Posts on this site are for education purposes only. They provide one firm’s insight on the markets. Not investment advice. See additional disclaimer here.

















 The Danger Point®