Top Or Channel?

The market itself, tells us where to look.
The past five ‘Silver Top’ updates have looked at recent action, as a potential top and downside reversal.
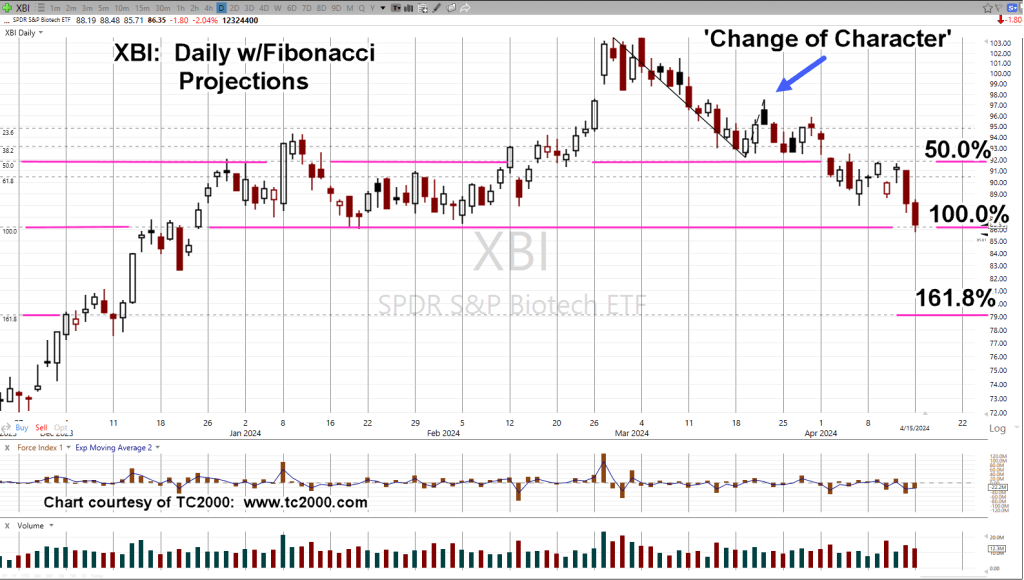
The ‘Part V’, update (link here), included a ‘measured move’ target.
In the markets, an infinite number of events can be true simultaneously. Dr. Elder covers this in his book, with individual traders working multiple timeframes.
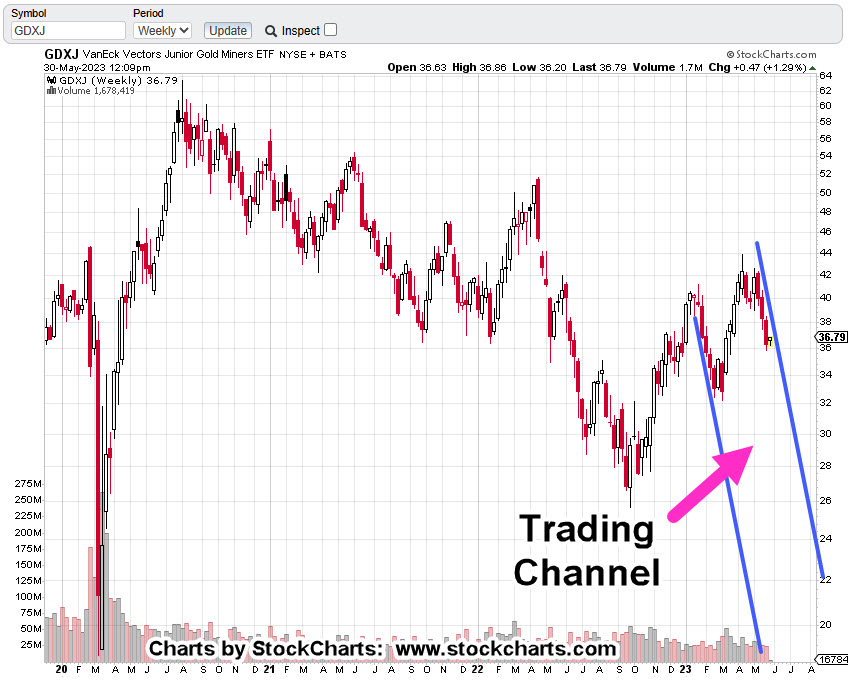
All of which brings us to the chart below.
Silver SLV, Monthly
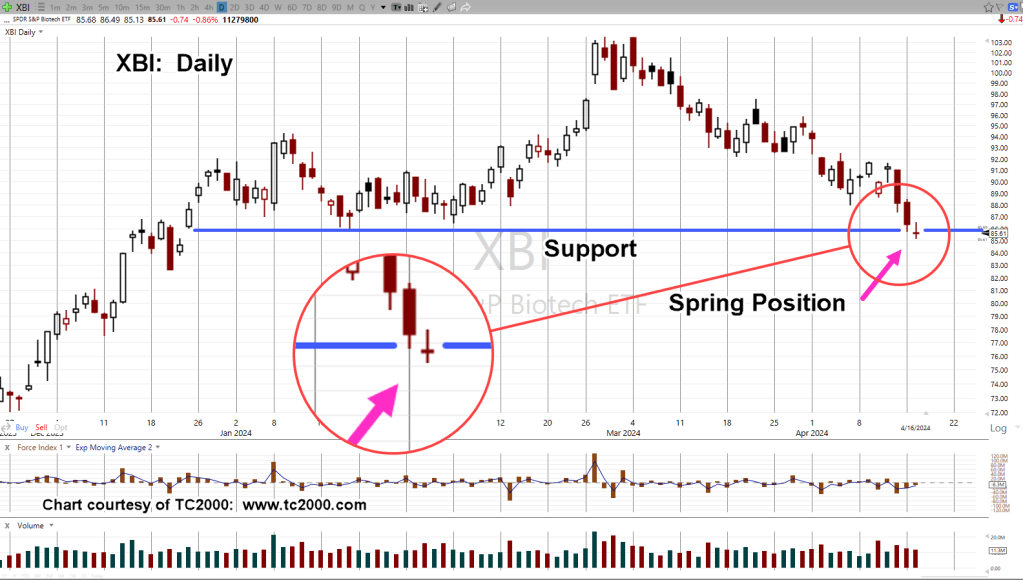
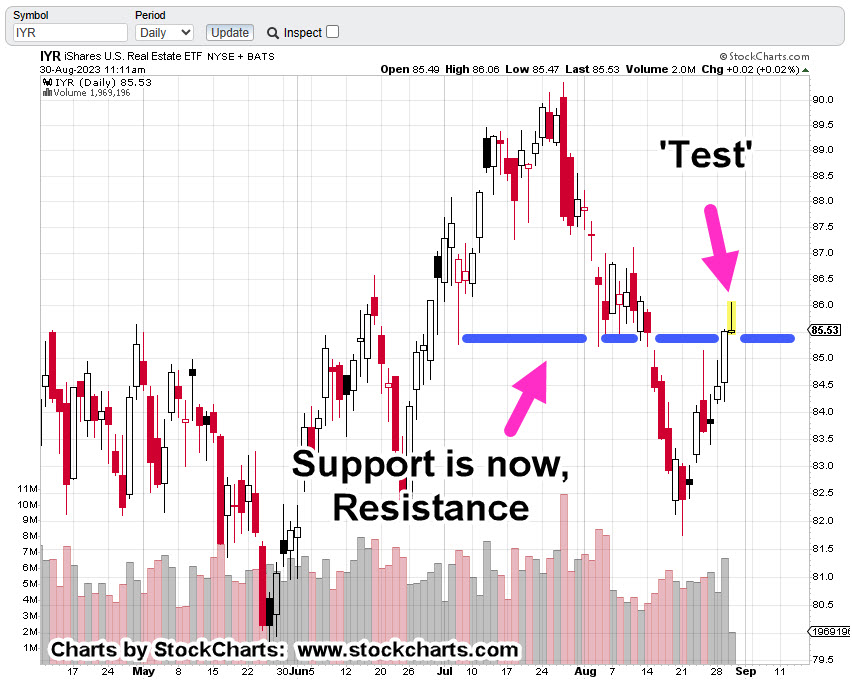
From previous updates, we’re hovering around the support resistance zone.
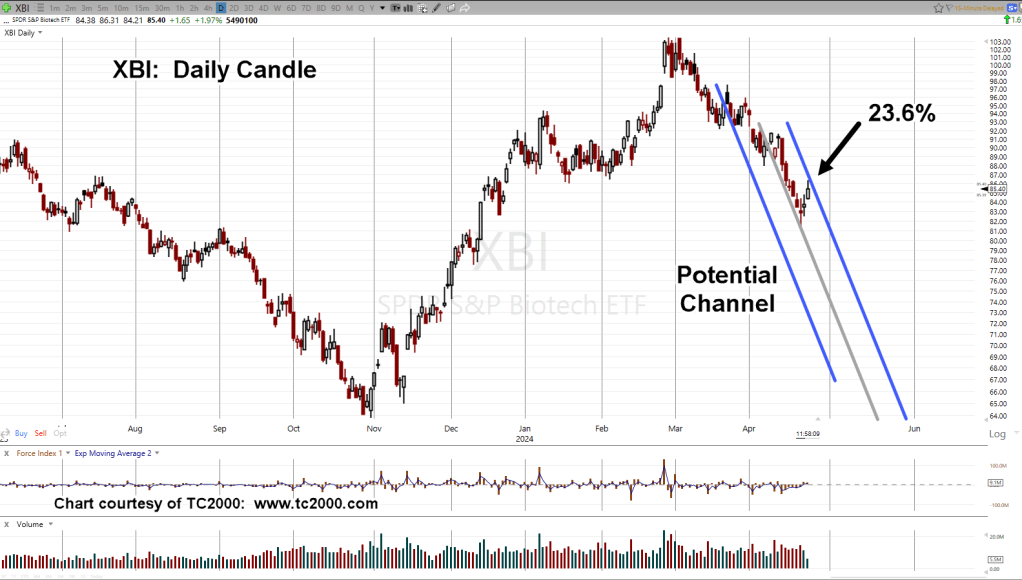
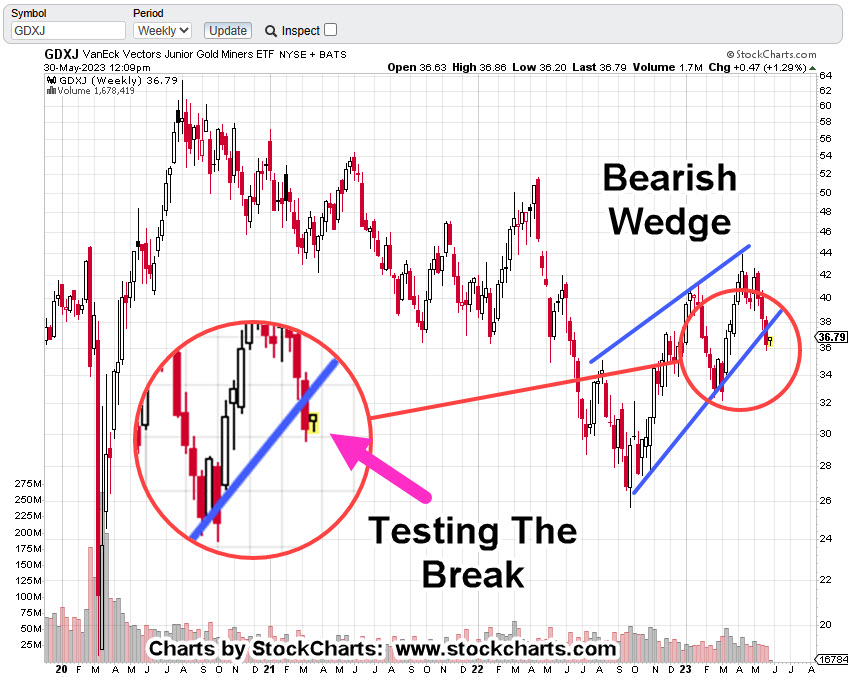
Now, we can see price action’s also hitting the top of a trading channel.
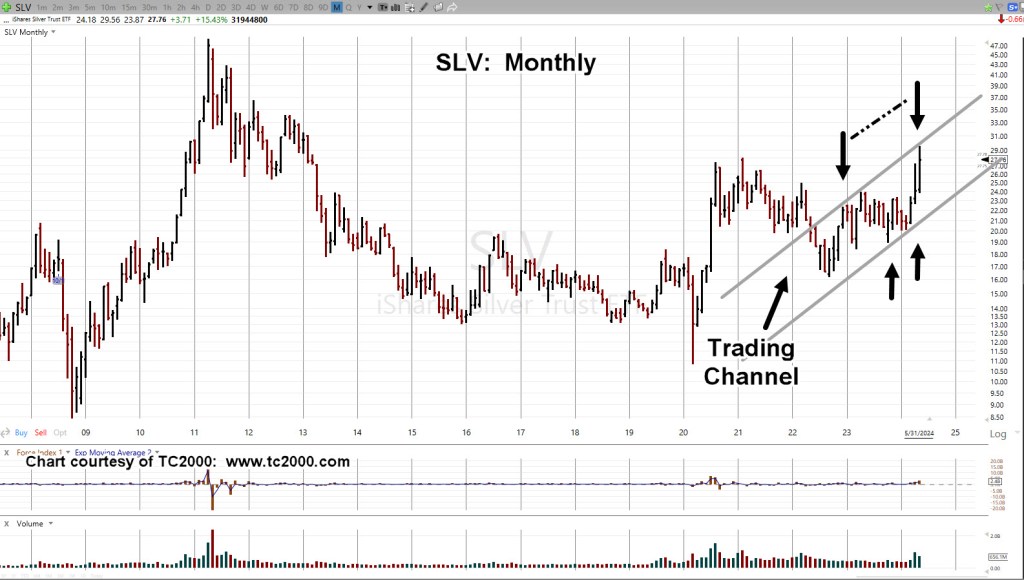
The question of course is, what’s the next likely outcome?
Even without considering what else is going on in other markets, a pause, sideways congestion, or downward testing seems to be the highest probability (not advice, not a recommendation).
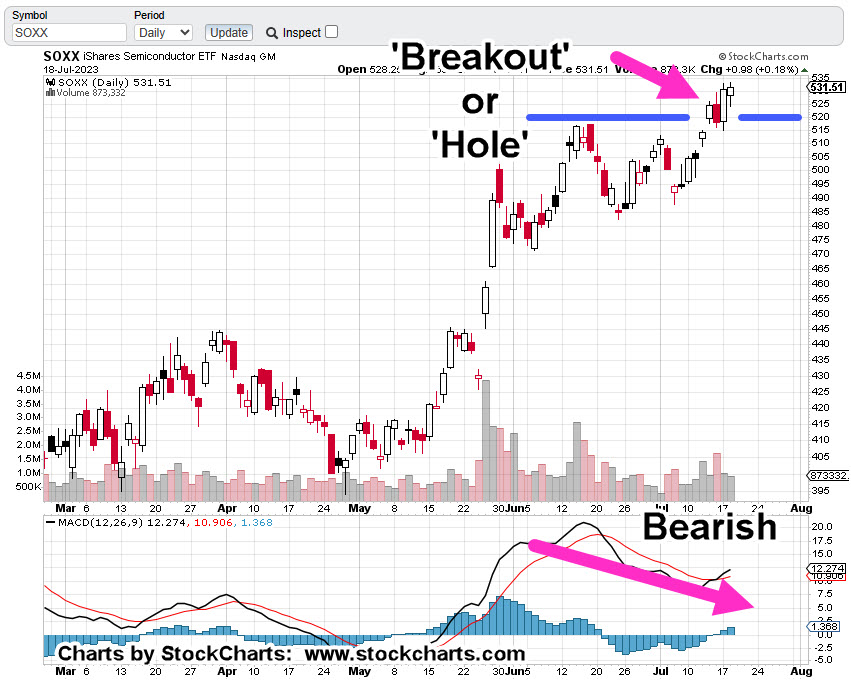
Did The ‘Bubble’ Just Pop?
When we do take other events into account, wide swings in the SOXX on Friday, Nvidia posting a narrow range weekly bar, a potential top indicator, Ed Dowd said, when this all implodes, there’ll be margin calls aplenty.
The technical situation of the SOXX, is planned for tomorrow’s update.
Stay Tuned
Charts by StockCharts
Note: Posts on this site are for education purposes only. They provide one firm’s insight on the markets. Not investment advice. See additional disclaimer here.
The Danger Point®, trade mark: No. 6,505,279