The real kicker though, is Dowd’s statement at time stamp 34:30 in the link; when the market finally does turn to the downside, ‘It will be quick’ (not advice, not a recommendation).
Note: Posts on this site are for education purposes only. They provide one firm’s insight on the markets. Not investment advice. See additional disclaimer here.
From a price action standpoint, we have an outside down weekly bar as well as (potential) monthly reversal.
Despite fever-pitch, ‘the world’s ending’ talk on gold and (supposed) silver breakouts, we’re reminded here (time stamp 3:10) to expect a downward spike in gold should there be (serious) international trouble (not advice, not a recommendation).
Newmont’s the largest cap in the GDX; let’s take a look at the sector.
Senior Miners, GDX, Weekly
GDX, in the same vein as IWM, NVDA, SOXX, SPY, and TLT (to name a few), posting its own terminating wedge.
Noted in the chart, GDX has entered back into the wedge formation after a ‘throw-over’; typically, a bearish sign (not advice, not a recommendation).
Note: Posts on this site are for education purposes only. They provide one firm’s insight on the markets. Not investment advice. See additional disclaimer here.
Before we get started, recognize there’s a huge public service available with the (media, YouTubers, et al.) discussion on potential gold, silver, rally ‘to the moon’.
Now that Nvidia (NVDA) has posted a reversal, it’s likely the bull market, if not completely over, is seriously damaged.
As Ed Dowd, former BlackRock fund manager suggested, (link here), when the market turns lower, everything’s likely to head down … everything; at least, initially.
The public service: We get to see (in real time) which analysis method is best suited to determine the truth of what’s really happening.
With that, let’s move on to the chart.
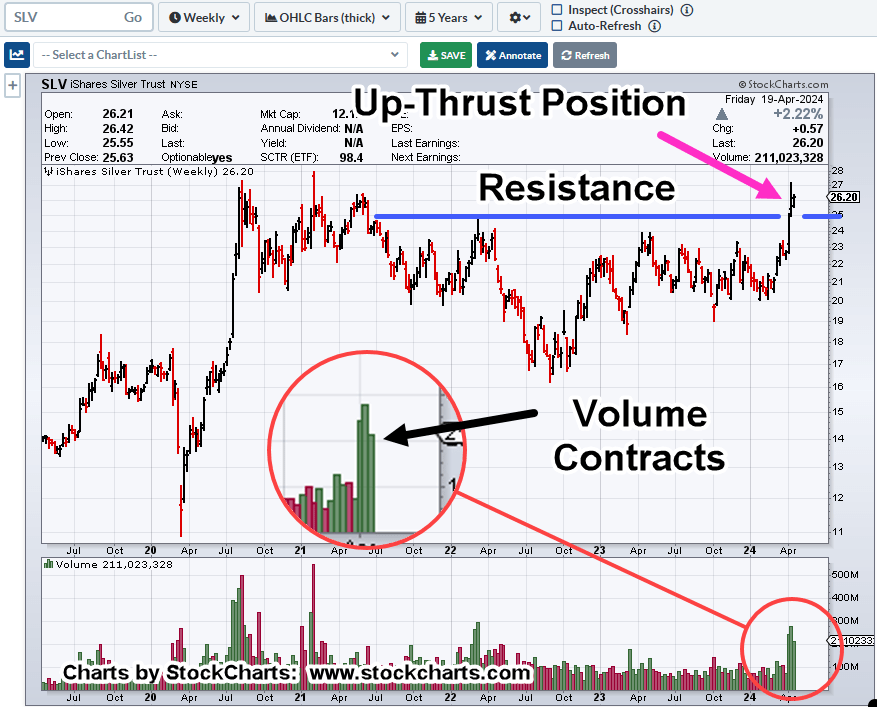
Silver SLV, Tracking ETF, Weekly
If this is an initial thrust to move higher, it’s losing energy; narrow range (weekly) bar with volume contracting.
If we’re in an up-thrust about, to reverse lower or consolidate, this is the type of market behavior to expect (not advice, not a recommendation).
Delusional In … Delusional Out
Like the Artificial Intelligence (AI) delusion, hyped-up beyond all conceivable expectations, it takes a while to deflate.
This past Friday may have been the start.
So too, it could be with precious metals.
If indeed, this time is different, and were in a sustained, long term (years-long) rally for silver (SLV), then look for the character of the price action to change.
One potential example of that would be, successive gaps higher of $5/oz., $10/oz., or more.
A real bull market breakout (like the S&P in 1995), does not let you get aboard comfortably.
Note: That breakout in ’95, was a complete shock to the typical market watcher.
The S&P had oscillated in a trading range for a year before launching decidedly higher in early ’95. In that sense, the breakout is/was the complete opposite of the ‘long awaited’ (potential) bull run in precious metals.
The Mood Has Shifted
Anecdotally, the mood appears to have shifted.
If we’ve just past the top in the market (S&P, Dow, SOXX), then expect the social construct to become unhinged.
Note: Posts on this site are for education purposes only. They provide one firm’s insight on the markets. Not investment advice. See additional disclaimer here.
Before we get started, biotech may have decisively turned the corner to the downside with this, just out … maybe.
‘Zero Respect For Thieves’
Before we get started, with getting started, a brief mention on thievery.
Years ago, Dr. Elder stated he had ‘zero respect for thieves’; those who had stolen his book tile, ‘Trading For A Living’, in various forms.
When you have limited skills and even less insight, thievery is the only way to go … that is, until you’re found-out.
Turns out, the analysis of silver SLV, posted on this site (here and here) nearly two weeks ago, specifically the presence of SLV volume ‘spikes’ at inflection points, may have been ‘lifted’ without citation by a prominent YouTuber (who will not be named … yet).
It may have been just a coincidence. If so, all is well. However, a ‘second time’, not so much. So, let’s all play ‘nice’ shall we? 🙂
Now, on to biotech.
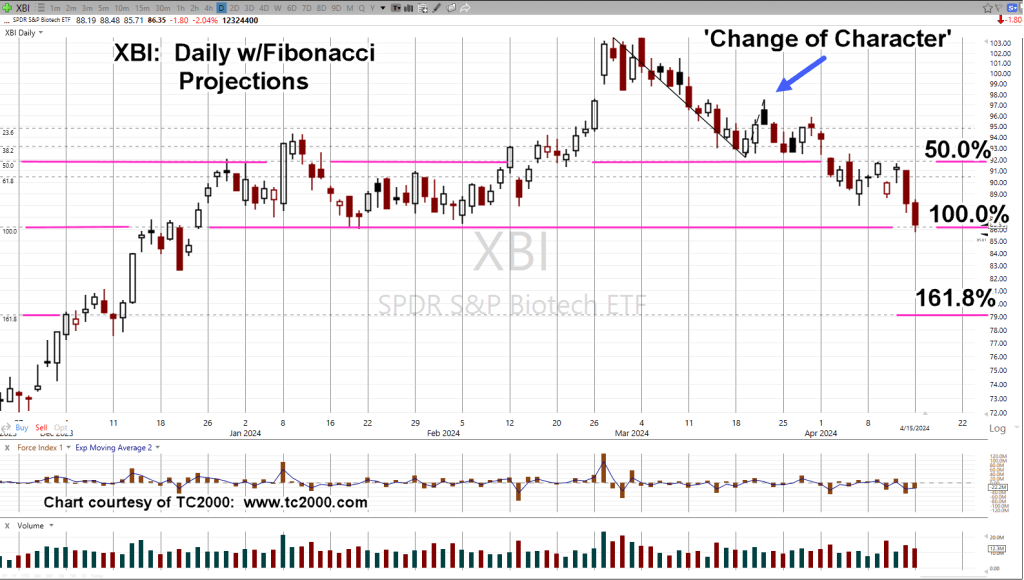
Biotech, XBI, Daily
This update is being released just before the open. It looks like XBI, is about gap-lower.
We see in the chart, XBI, is respecting the Fibonacci projections.
As with the recent oil market analysis and USO, (here and here) we let the market decide what areas are important.
In the case of XBI, and unless significant demand comes in, lower prices appear to be the most probable direction (not advice, not a recommendation).
Note: Posts on this site are for education purposes only. They provide one firm’s insight on the markets. Not investment advice. See additional disclaimer here.
YouTube content creators have noticed the public’s inability, refusal, and denial to recognize (or accept) the truth:
Michael Bordenaro; ‘everybody’s so weak, so sensitive, they can’t handle the facts.’
Patera, Appalachia’s Homestead; discussing her lineage (Cherokee) and history, seeing the similarities of today, applying the lessons; some are more concerned about her hair and makeup.
Then, Uneducated Economist; ‘no amount of wishing is going to bring events back to the way it was. It’s effectively a new construct.’
Interest Rate Ruse
The 40-year bull market in bonds is over; rates are not going lower, they’re going higher (not advice, not a recommendation).
Ignoring or refusing to recognize this (highly probable) truth when analyzing markets, is a potential strategic error.
The longer the ruse goes on, the more violent the reaction may be when the masses (finally) ‘awake’.
All of which brings us to biotech, XBI, SPBIO, $SPSIBI.
Biotech Truth
Truth about biotech is brutal; described here, here and here.
Exactly how this will all hit the mainstream in force, is unknown. However, let’s not forget, ‘when price action goes south, bad news comes out’.
Biotech XBI, Daily
Heading south at this point, is biotech XBI.
Market test of the Wyckoff up-thrust (reversal) appears complete; previously discussed here, here and here.
As of 1:40 p.m., EST, XBI is trading back into congestion (92 – 96) and looks to have formed a trading channel.
Left channel contact line shown as No. 1, is supported by this post, potential long-term reversal.
Note: Posts on this site are for education purposes only. They provide one firm’s insight on the markets. Not investment advice. See additional disclaimer here.
‘They [The Fed] are totally tricking the markets’ (time stamp 3:30), link here.
Yes, it’s a real chess game going on and the other side, makes up the rules.
This update presents that despite all the manipulation and head-fakes, significant market pivots in the miners were identified (correctly) with Wyckoff analysis.
That analysis, in turn, helped develop a long-term strategy (not advice, not a recommendation).
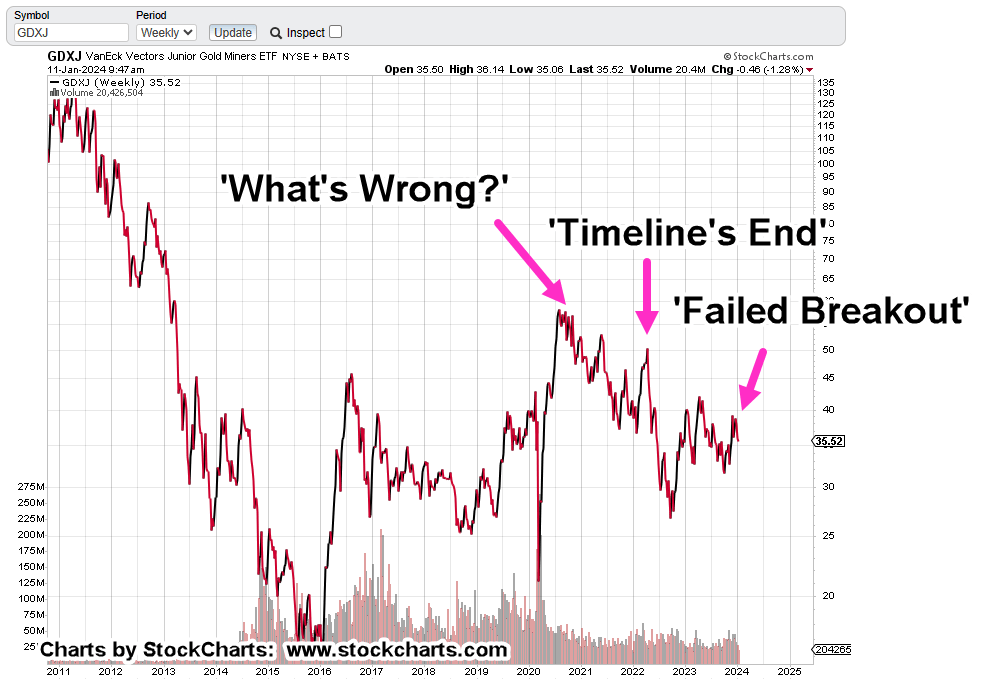
Junior Miners GDXJ, Weekly Close
Three key points are shown on the chart.
The first goes all the way back to October of 2020, link here. There’s something wrong with the miners.
Potential for another downward pivot, link here, was identified to-the-week, if not, to-the-day.
The subsequent move printed the most impulsive price action since the spike melt-down of early 2020.
Which brings us to today.
Another potential pivot has been identified, link here.
As of this post (11:20 a.m., EST) the Juniors GDXJ, continue to rachet lower.
The Long Term
As Ed Dowd points out in this interview, what’s happening now will affect us all for decades, if not centuries to come.
Therefore, it’s a good idea to have a long-term strategy.
From the above chart, it’s clear that Wyckoff analysis has been on the correct side of GDXJ price action; the bearish side (not advice, not a recommendation).
Note: Posts on this site are for education purposes only. They provide one firm’s insight on the markets. Not investment advice. See additional disclaimer here.
Note: Posts on this site are for education purposes only. They provide one firm’s insight on the markets. Not investment advice. See additional disclaimer here.