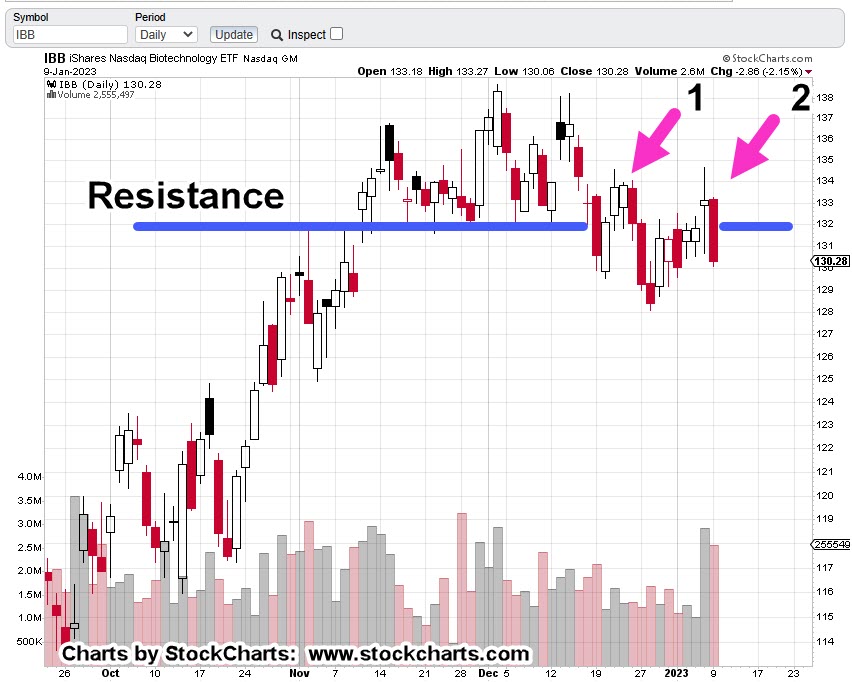
The majority of the indices are at their right-side channel lines.
We’ll cover semiconductor SOXX, and QQQs, below. However, biotech IBB, and SPBIO, are in similar positions.
From a calendar and data standpoint, there’ll be plenty that could be used as an ‘excuse’ for market moves but let’s ignore the (intended) distractions and take a look at what the market is saying about itself.
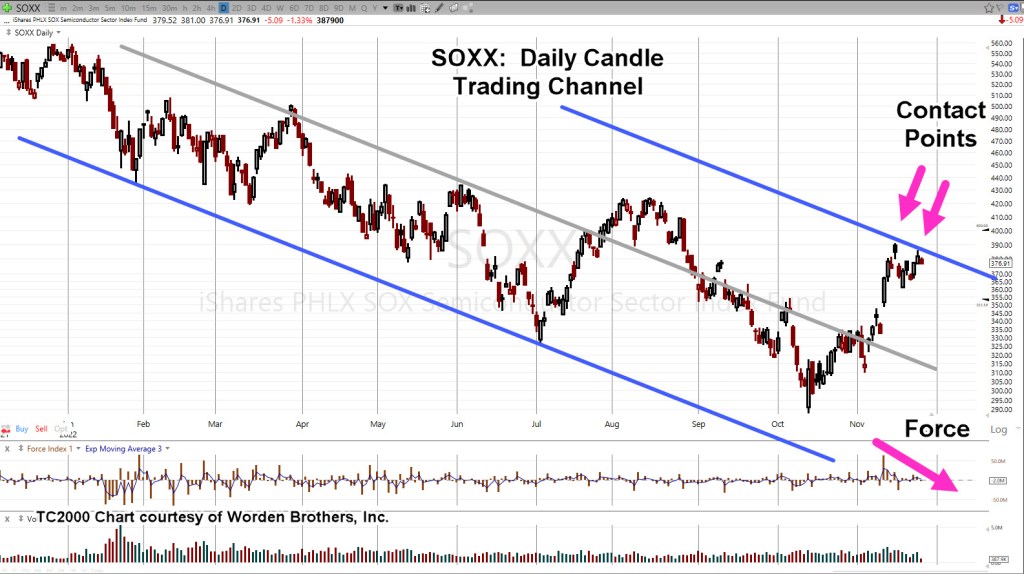
First up, is the semiconductor index, the SOXX.
Semiconductor’s, SOXX, Daily
The chart has Fibonacci retrace levels shown. Price action has retraced to 38.2% and stalled.
But wait, there’s more.
Putting in a trading channel, we could be at a reversal point.
Note the upward thrust energy (‘Force’) has dissipated.
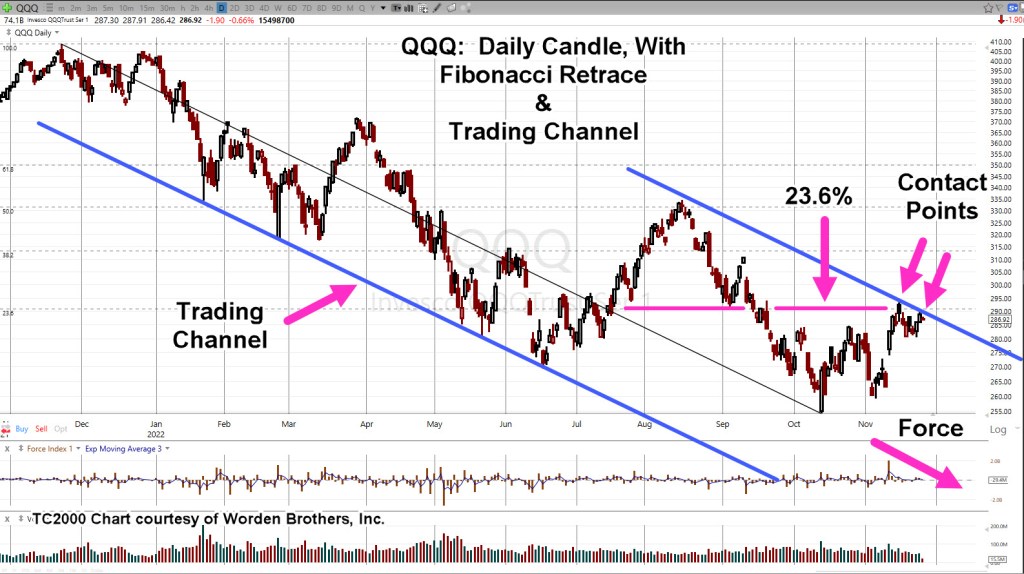
the NASDAQ is in a similar situation but weaker from a retrace standpoint.
NASDAQ, QQQ, Daily
Looking at the monthly chart for the Q’s (not shown), it’s been a Fibonacci 13-months since all-time highs.
Force dissipation and ‘Contact Points’ are near identical to the SOXX.
Summary
Biotech IBB and SPBIO, are in similar positions. In fact, the overall markets appear poised for downside reversal.
As discussed in the last update, the bond market could be signaling danger ahead with its sharp upward reversal; now (potentially) entering its sixth week.
Note: Posts on this site are for education purposes only. They provide one firm’s insight on the markets. Not investment advice. See additional disclaimer here.
The last update, posted late in the session, said with the upward bias provided by the sizable Op-Ex event, we can look for the weakest (or one of the weakest) sectors.
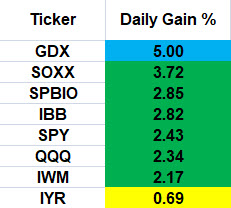
The chart below summarizes yesterday’s action:
Friday 10/21/22, Single Day Gains
Gold miners GDX, is the outlier at the top and real estate IYR, the outlier at the bottom.
Before anybody gets excited about ‘hyperinflation’, just a reminder; silver SLV’s, action has retraced to a weak 38.2% (chart not shown), as it was forecasted to do from last week’s update:
“Silver (SLV) is currently at support levels; therefore, some upward action (staying below SLV: 18.5) is normal behavior.”
Price action is the final arbiter; we’ll see what happens next.
Back to real estate.
Professional Wisdom: ‘The Crash’
We’re going to use the experience and insight provided by Scott Walters concerning the potential for real estate; that is, we’re in a world-wide event the scale of which, no one alive (and possibly, ever) has seen before.
The Economic Ninja has just seconded that opinion (time stamp 3:45) with his quote:
“Right now, we are in the greatest collapse since The Great Depression; and I believe it will be as severe, if not worse, sharper, faster, than what people experienced in 1929”.
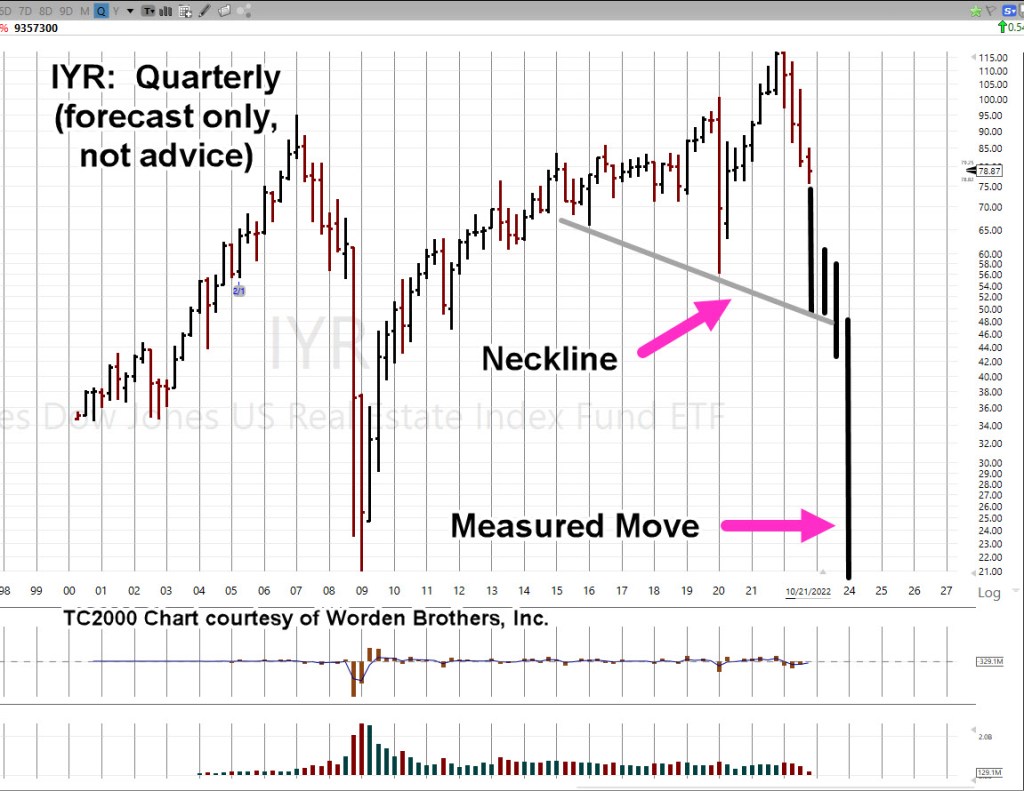
So, what would that ‘collapse’ look like on a chart of real estate, IYR?
Ah, yes. That’s the hard part.
To take useful wisdom like that above, and somehow map it into potential market behavior.
For that, we’re going to use the Quarterly chart of IYR.
Real Estate IYR, Quarterly
There are still two months and one week left to go in the 4th, Quarter.
We’re at a confluence of price action as we’ll cover in the Hourly chart farther down; first, what’s the potential?
Here is one artist’s rendition (not advice, not a recommendation).
That puts it into perspective.
We may know at the very next open, if we’re pivoting higher or continuing the decline.
Butterfly In The Amazon
Of course, the market’s not going to tell anyone its next move. We have to decipher that (read the tape) ourselves.
Sometimes, as Wyckoff said a century ago … ‘It’s as if the weight of a feather is all that’s needed, to push the market further or to reverse.’
So, let’s look at that feather (the butterfly) on the hourly chart.
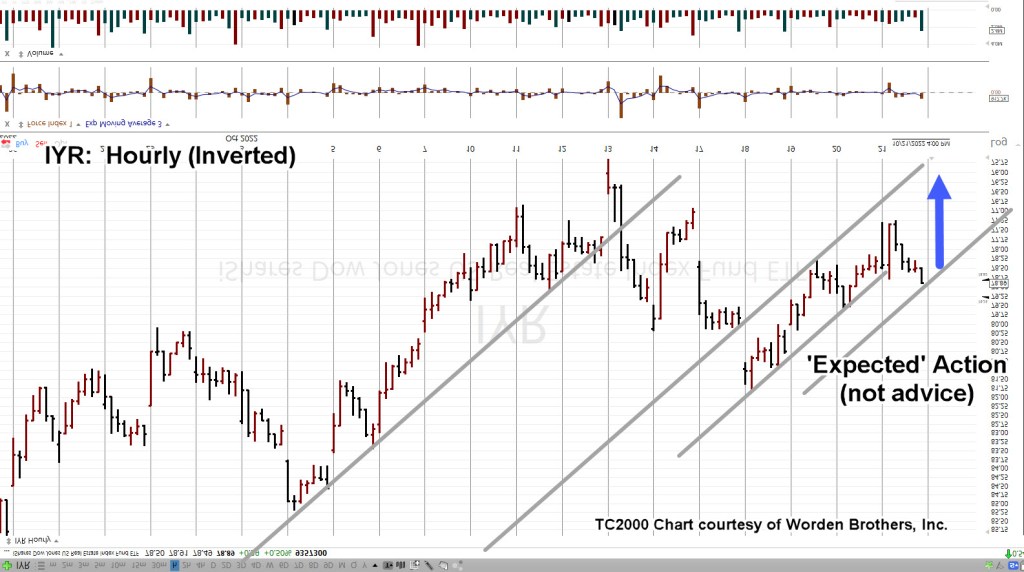
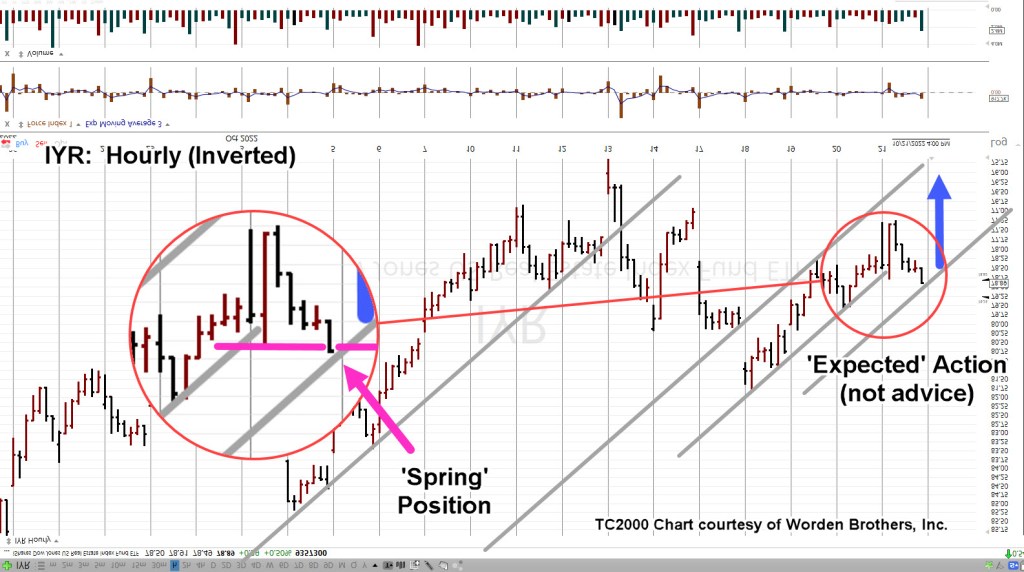
Since we’re positioned short (DRV-22-05), the chart’s inverted to mimic leveraged inverse fund DRV.
Real Estate IYR, Hourly (Inverted)
The important part is we see a repeating pattern of trendlines.
Moving in closer, we have this. The blue arrow is ‘expected’ action based on the analysis up to this point (not advice, not a recommendation).
Moving even closer, the zoom shows IYR, finished the day in Wyckoff spring position; having pushed past minor support (resistance on non-inverted).
Summary
If IYR opens lower or gap-lower, we’ll have to wait and see if it posts a new daily low (below IYR ,77.24).
If that happens, we have some confirmation lower prices are ahead and can then set a definitive stop for DRV-22-05.
Obviously, a higher open (pushing past IYR 78.91), negates the trade.
Note: Posts on this site are for education purposes only. They provide one firm’s insight on the markets. Not investment advice. See additional disclaimer here.
It looks like having a real (positive) P/E, may be about to be important.
The prior biotech update said that so far, no P/E, negative P/E, and ‘no money down’ was not affecting the sector.
That is, until now.
Well, ok. I made up the ‘no money down’, part. 🙂
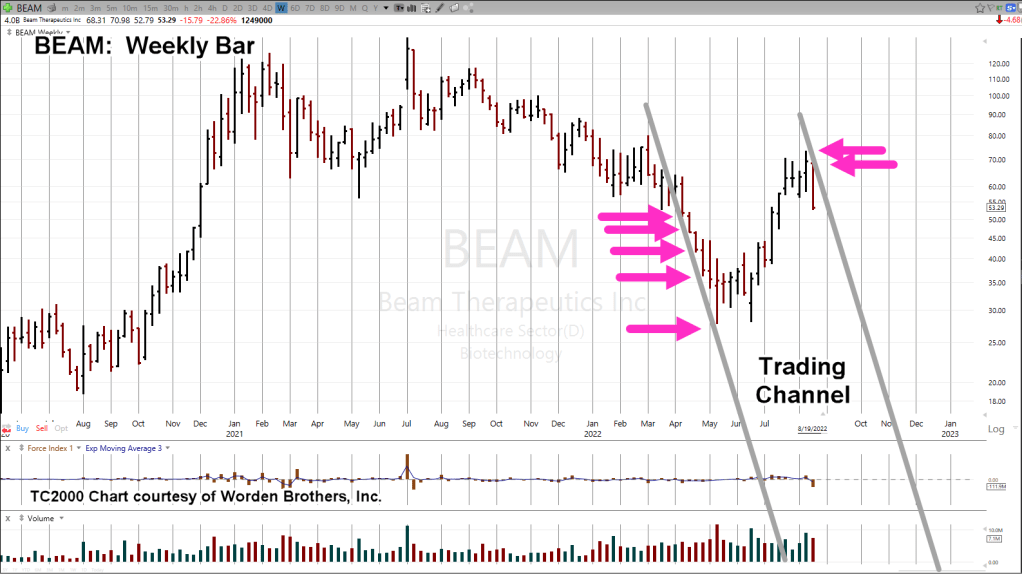
That little jest does not take away from the fact, biotech SPBIO, and its top three weightings, BEAM, TWST and FATE, have all reversed, decisively to the downside.
For the week just ended, BEAM is down – 22.86%, TWST down – 19.18%, and FATE down – 14.16%.
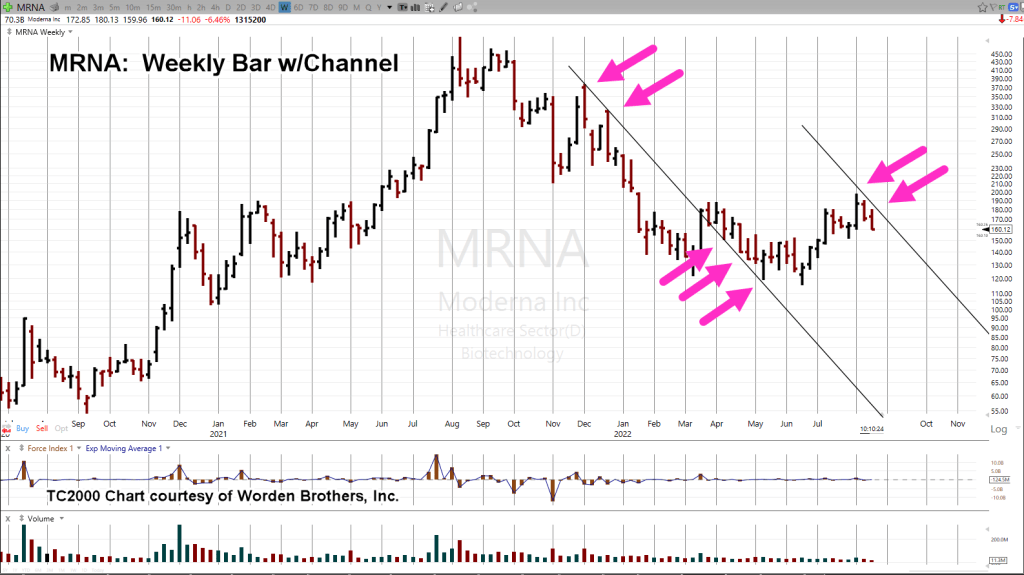
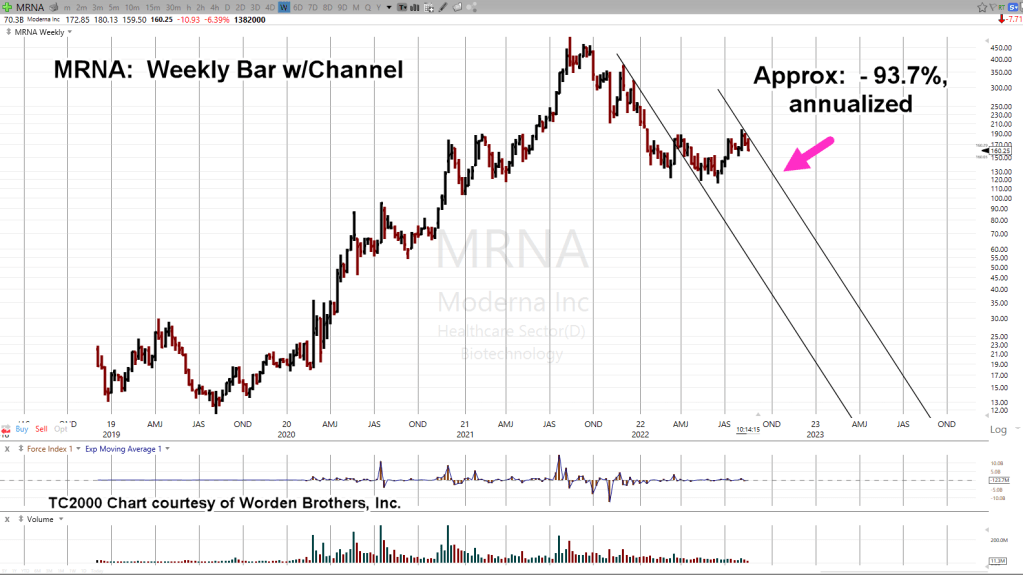
Back at the ranch in the IBB index, Moderna (MRNA) is also down – 14.65% for the week.
So, we have confirmation the entire industry is now continuing its downward course.
Contrast the reversal of index SPBIO, at – 7.04%, with S&P (SPY) at – 1.16%, and the market itself is telling us where to go for opportunity (not advice, not a recommendation).
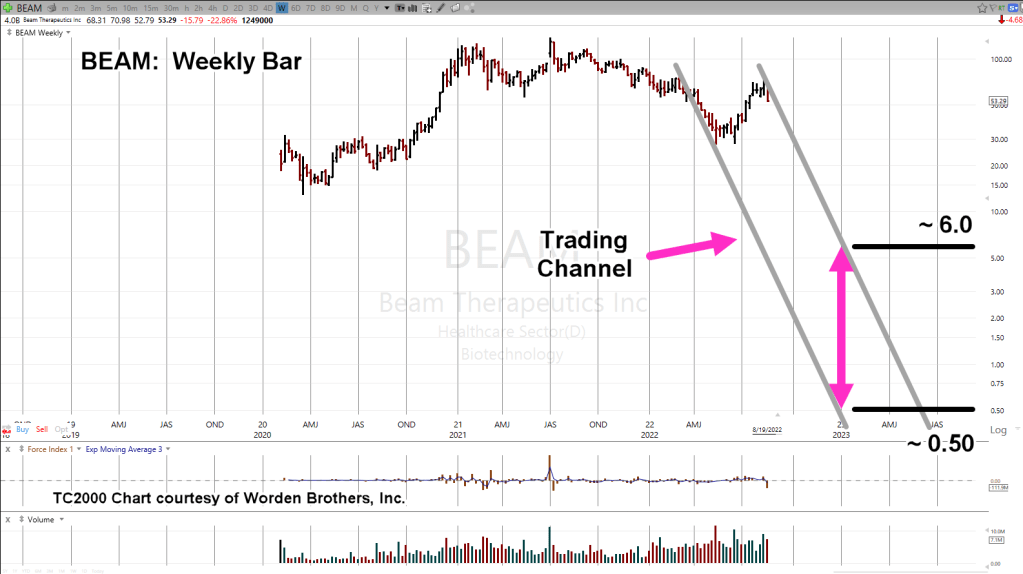
At this point, all three amigos (BEAM, TWST, FATE) are in downward trading channels.
Trading channel for BEAM is the most aggressive. The weekly chart is below.
Beam Therapeutics (BEAM) Weekly
If BEAM maintains its channel for the rest of this year, the chart below shows the target area(s) for price action.
The coming week may let us know if this channel will be confirmed or negated.
Recall, the S&P is topping out and appears to be reversing.
Goldman says the squeeze is over but that ‘downside is limited’.
Note: Posts on this site are for education purposes only. They provide one firm’s insight on the markets. Not investment advice. See additional disclaimer here.
Last Friday’s action was volatile with the op-ex short-covering apparently coming into play. Biotech was affected more than any other index.
If it really was short covering, then we already know what’s likely to happen next.
First, we’ll go over the charts and then build a case for the next probable direction.
The focus is on SPBIO, instead of IBB, as it’s the weakest of the two indices.
From a weekly standpoint, this is where SPBIO, left-off this past Friday.
Biotech SPBIO, Weekly Bar
Adding the mark-up to show we’re at support and resistance.
Getting closer in on that area.
We can see based on the price action itself, we’re at an important juncture.
Two years ago, in March of 2020, price action formed a support level.
Fast forward to now.
Price action bounced off that same level, attempted to move higher (for over three weeks), was rejected, moved lower, and last week, came back up for an underside test.
Most Probable Direction
If there was a short squeeze as a result of options expiration, fuel for that move is gone.
The options have expired.
in addition, that fuel was only able to get SPBIO, to the underside of resistance.
So, you can see where this is going.
Upside fuel is gone. SPBIO, is currently at underside resistance; most probable direction is down.
Measured Move
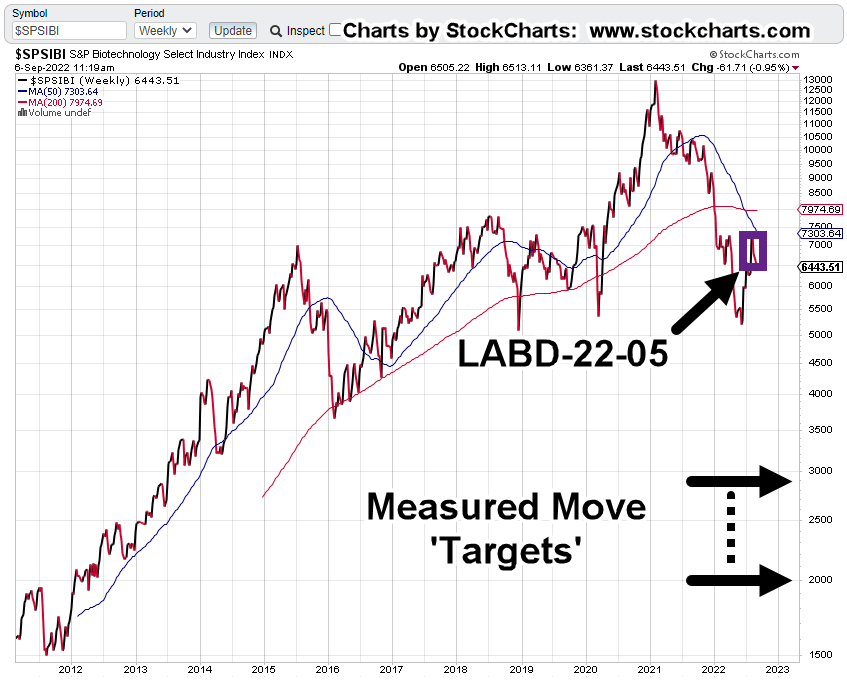
If the action from all-time highs during the week of February 12th, 2021, to the current support/resistance area is a trading range, then we may have a ‘Measured Move’ target as shown.
Under the current conditions, i.e., financial, societal, collapse along with the ‘elephant‘ going mainstream, a downside objective that’s an – 85.6%, decline from all-time highs, is entirely reasonable.
The 3X Inverse LABD, Weekly
The unmarked chart
First, the rule of alternation.
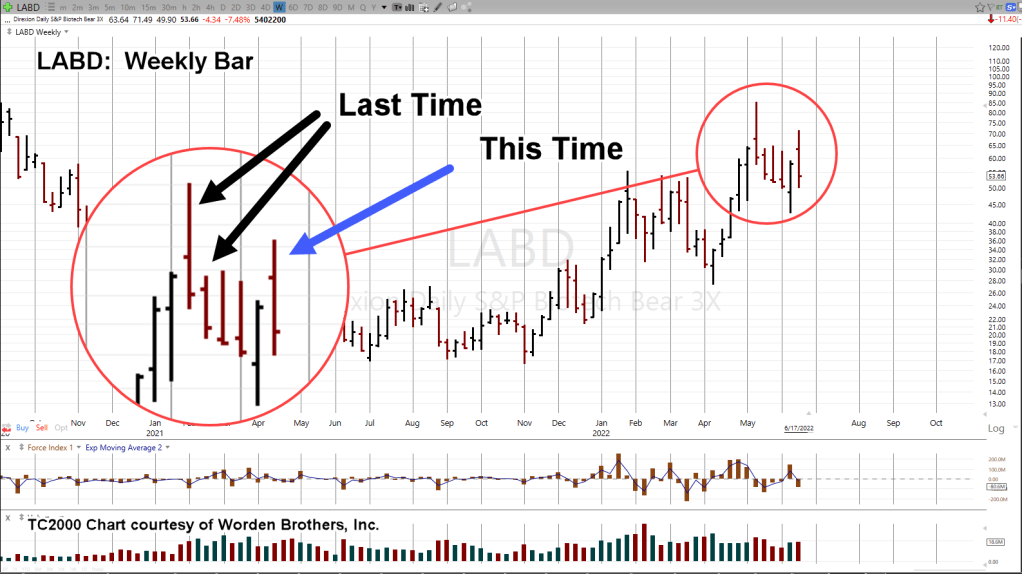
Last time is not this time.
Last time there was a reversal bar and the next week continued lower, then lower again and so on.
The rule of alternation says, whatever happened last time will not happen this time. Price action will (likely) have a different form.
Obviously, if the short squeeze referenced above is over and the trend remains down, one could expect LABD, price action to be higher at the next session (SPBIO, lower).
Positioning
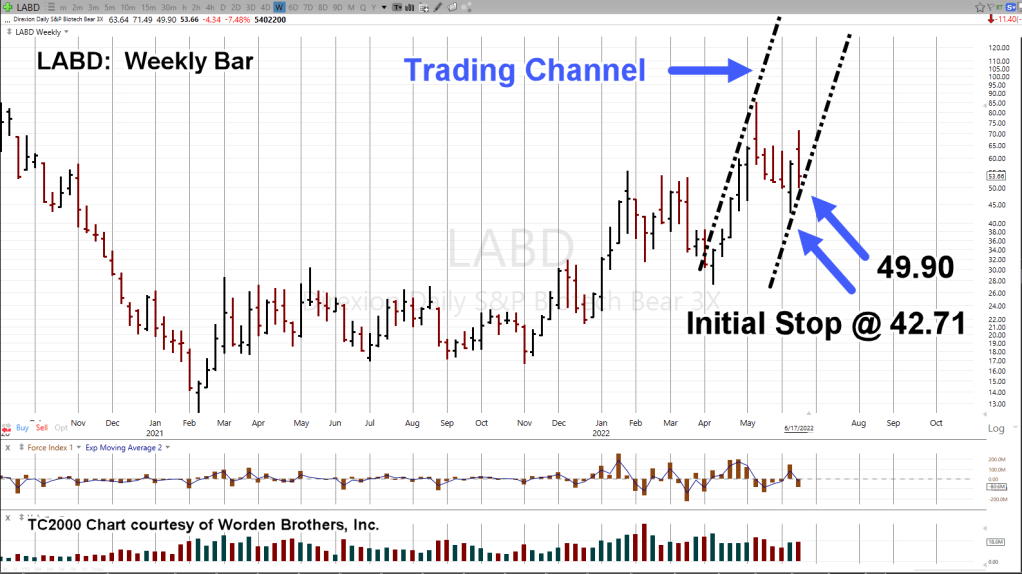
The weekly chart shows progression and location of the stop orders on LABD-22-03 (not advice, not a recommendation).
The initial stop has been moved up to last week’s low.
There may be a trading channel as well.
Potential exit target(s) if not stopped out, would be contact points at the upper channel line.
Summary
If the position is stopped out at the next session, we’ll re-evaluate.
If not, and SPBIO, continues to move lower (LABD, higher), we’ll be looking for additional confirmation of the right-side trend line and the next likely area to move the stop.
Note: Posts on this site are for education purposes only. They provide one firm’s insight on the markets. Not investment advice. See additional disclaimer here.
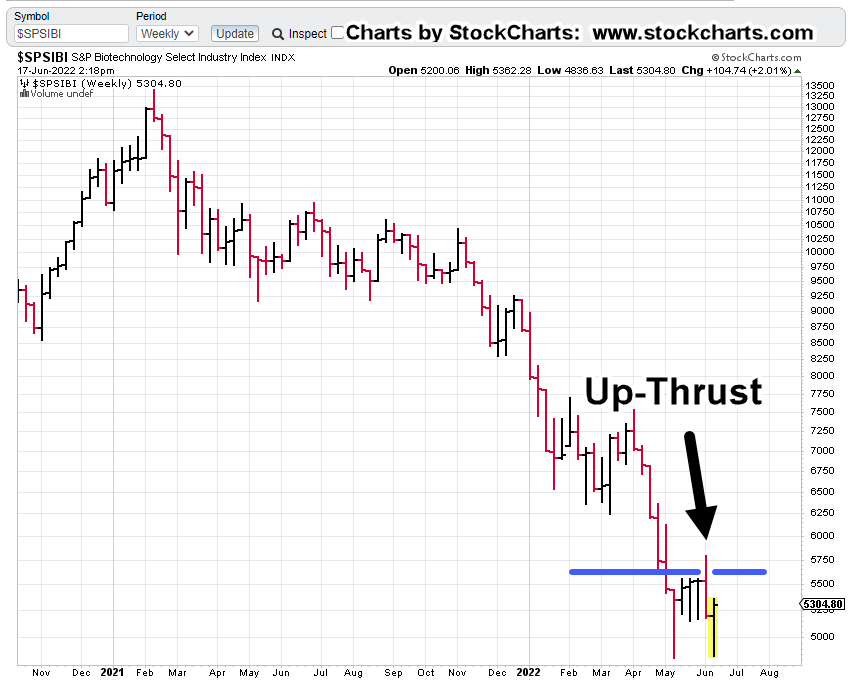
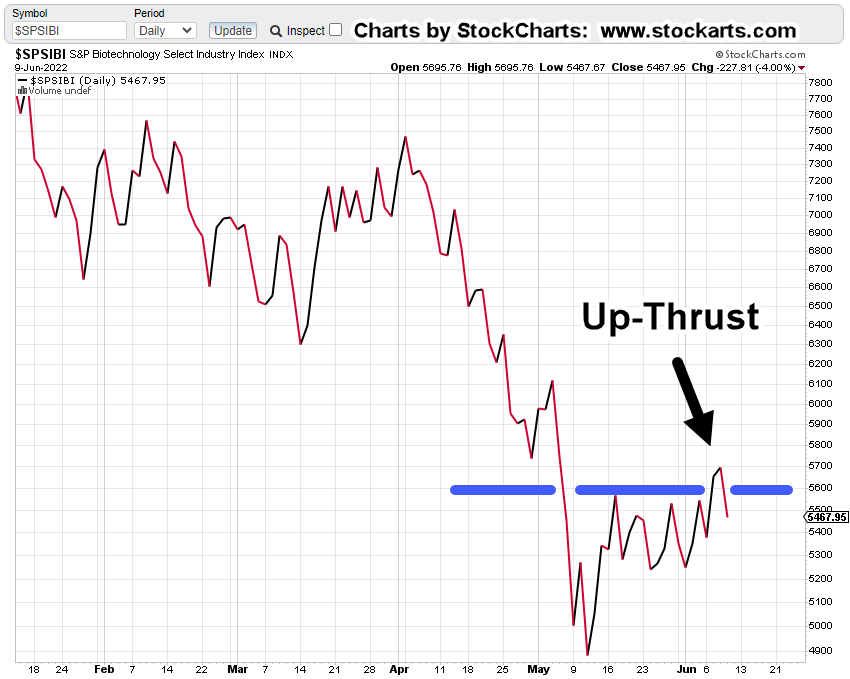
If we look at it from the perspective of an up-thrust test, as we’ll do below, such tests if they don’t fail are the precursor to dynamic moves.
At the minimum, today’s action allows the stop to be moved on short position LABD-22-03 (not advice, not a recommendation).
It’s interesting, the biotech sector both IBB and SPBIO, with inverse funds BIS, and LABD, respectively are the only ones taking a major hit today.
Using a cue from Nicolas Darvas and his observations (as a dancer), the market will initially go opposite its main direction as if to get ready for the move; like a dancer crouching down before lifting the female partner.
That may or may not be the case now, as we’ll see below.
Biotech SPBIO, Weekly Chart
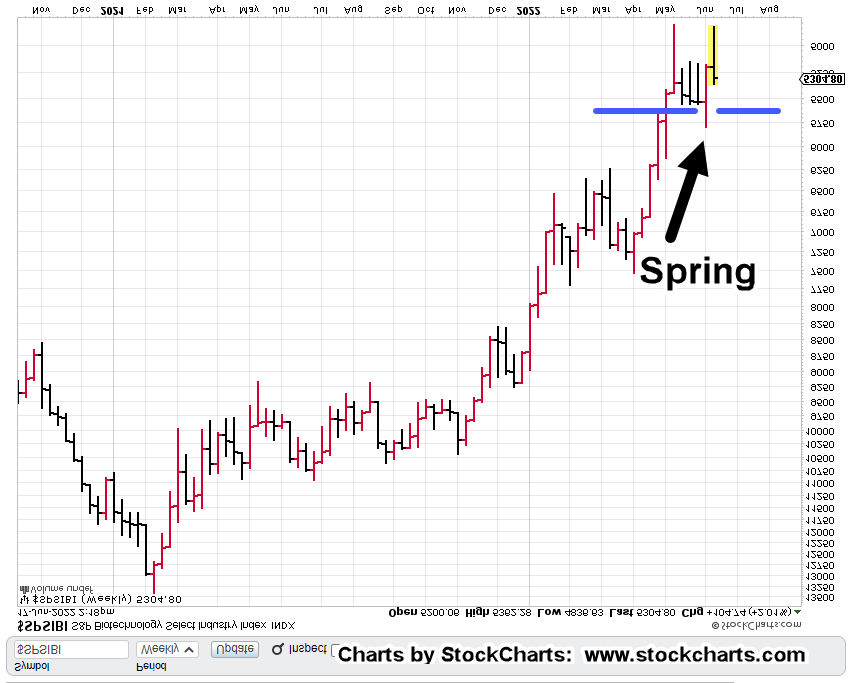
Next, we’re going to invert the chart (to mimic inverse LABD) and then label the up-thrust as a Wyckoff ‘Spring’.
Biotech SPBIO, Weekly Inverted
Next, we get closer to the action as shown.
Is the ??? area, a test or a failure of the set-up?
The short answer with about 90-minutes to go before the close, is unknown.
If SPBIO, closes down for the week, painting a red bar, probabilities are to the downside.
Closing higher for the week starts to bring a potential failure of the trade into question.
Summary
No matter what happens, the stop on the short position via LABD is going to be moved to the low of this session; currently LABD 49.90 (not advice, not a recommendation).
We may get into speculation later, on why biotech seems to be the only index in a major squeeze, preparing for downside.
Some who monitor this site, and those ‘awake’, may already have a good idea as to the potential why.
Note: Posts on this site are for education purposes only. They provide one firm’s insight on the markets. Not investment advice. See additional disclaimer here.
From the outset of the bull market’s end, biotech has been the downside leader.
Of the two indices being tracked, IBB and SPBIO, the latter of the two, is the weakest.
Over the past several weeks, it’s been like a terrier on a mailman’s leg concerning positioning short this index (not advice, not a recommendation).
In the end (as we’ll see below), it turns out that waiting for an actual penetration, print, and close above resistance, was the best approach.
Now, it’s obvious, we’re in a reversal.
The unfortunate part from an economic standpoint, this could be the next big leg lower.
Biotech SPBIO, Daily Close
Penetration and close above resistance (blue line).
Then, price action retreats below resistance and back into the trading range; Wyckoff, Up-Thrust (reversal).
It’s important to note, if SPBIO closes at this level or lower, the prior analysis of ‘grinding to a halt‘ on a weekly close basis, remains valid.
Positioning
Right or wrong, the short position LABD-22-03, was never fully exited (not advice, not a recommendation).
Everyone has their own style.
From a personal standpoint, I despise ‘chasing’ the market. Chasing is for the lazy or frightened who are too afraid to pull the trigger. No thank you.
In fact, the LABD-22-03, position was increased near the end of yesterday’s session.
The intuition, the gut feel, if you will, was ‘This sector’s going to reverse. When it does, it’s going to reverse hard’.
With today’s pre-market action (about fifteen minutes before the open), LABD, trading higher by 3.10-points, or +6.35%, that intuitive assessment is proving correct.
At this point, an obvious stop level would be yesterday’s LABD, low @ 45.77
Note: Posts on this site are for education purposes only. They provide one firm’s insight on the markets. Not investment advice. See additional disclaimer here.
As we speak, economic activity is shutting down … fast.
Amazon shipments cancelled, gas stations going dry, banks halt lending, real estate sales collapse.
Meanwhile, the market’s in a short-squeeze.
What happens next?
We’ll discuss real estate and biotech farther down but first the data sources.
Dan from i-Allegedly reports here, he still has a couple of rubes (my word) that think the market just bottomed out.
Good luck with that.
As we’ll show below, the real estate bear market (IYR) rebound, was identified ahead of time.
Next, we have Red Hurricane describing one semi-trailer load after another being cancelled. He hauls for Amazon.
Shipping activity’s contracting, seemingly, by the minute.
Lastly, this link where the D-word, ‘Depression’ is used within the first one-minute, twenty seconds.
Bottom-out in the stock market? Probably not.
So, let’s take a look at real estate IYR, and see where it might go next.
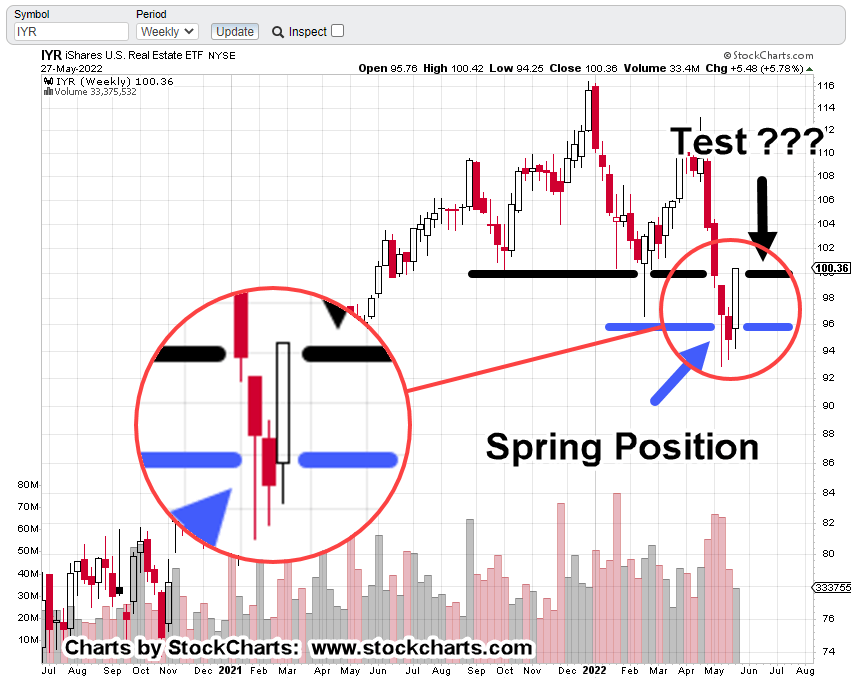
Real Estate IYR, Weekly Chart
The last update (link, here) showed potential to rise into a test of resistance. That’s exactly what happened.
Back then:
And now:
With zoom
Obviously, the upward test happened much quicker than anticipated … but it was anticipated … no surprise.
Real estate got itself into Wyckoff spring position; so, a rebound (test) is normal market behavior … short-squeeze or not.
If it was a squeeze and if it’s over, we can expect an immediate drop in price action. We’ll analyze that as it plays-out in the coming week.
Now, on to biotech, SPBIO
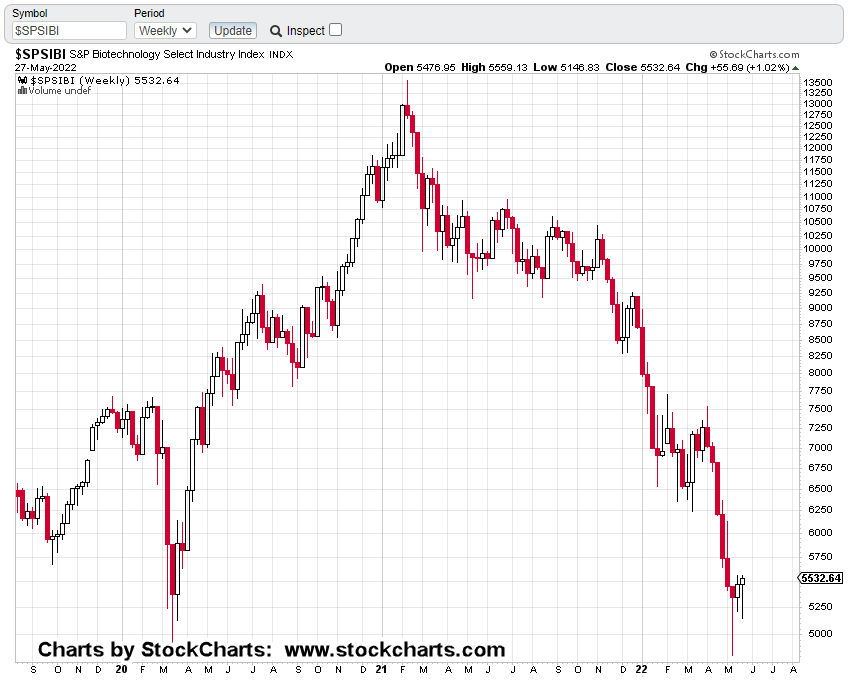
Biotech SPBIO ($SPSIBI), Weekly
Some housekeeping first.
Obviously last week, with being short, more downside action was anticipated resulting in upside for LABD.
On Friday, that did not happen. Biotech was part of the squeeze as well.
The short position via LABD, identified as LABD-22-02, was reduced but not exited completely (not advice, not a recommendation).
At present this is where we are.
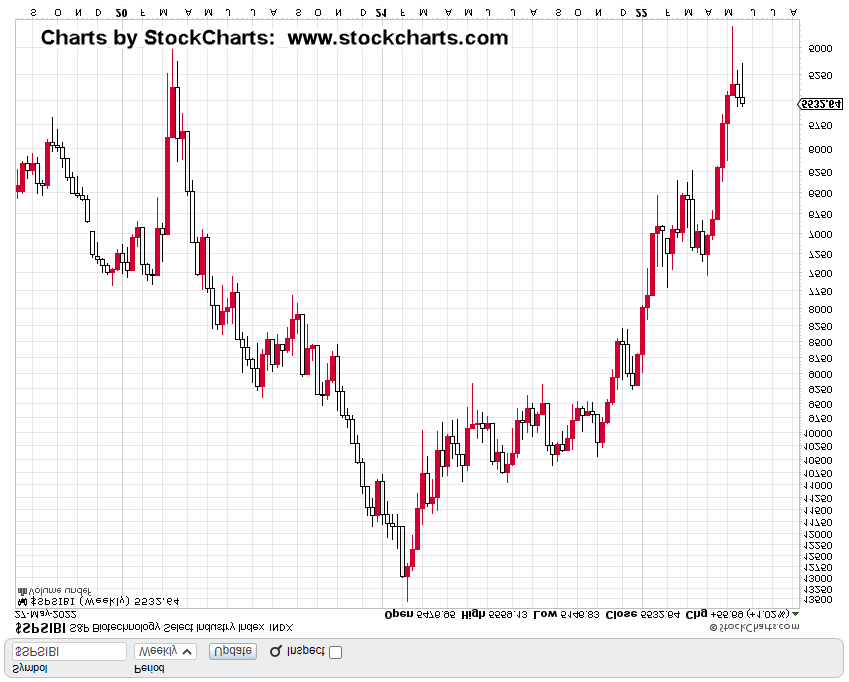
First, we’ll start by inverting the chart to mimic the action of 3X inverse, LABD.
Next, we’ll zoom-in and highlight the ‘squeeze’.
Doesn’t look like much when viewed that way does, it?
Next, we’re going to zoom-in, on the zoom
In spite of all the squeeze chaos on Friday, price action could not post a new weekly low (high on the non-inverted).
We’ll see this Tuesday, if that’s important or not.
This post is getting long but let’s end with the rule of alternation. The same chart is marked up below.
If this rule is still in-effect, we’re at a juncture where one can expect a ‘simple’ alternation.
We’ve already had complex action on the prior congestion; so, we can expect current action to be simple in character.
That means, price action’s not likely to stick around at these levels whether it’s going up or down.
Based on the above analysis, the expectation for Tuesday’s open is a gap lower for SPBIO and higher for LABD.
If that does not happen, something else is at work … we’ll report on that as necessary.
Summary
Has the market bottomed out? Not likely.
Those who are at this late stage, still arguing with Jerimiah Babe and Dan (and Patera), that the market’s rebounding, everything’s fine, are in a state of delusion.
The mindless herd following spending with ever newer cars, moving up to the McMansion, opulent vacations, posting it all on Facebook is most decidedly, gone.
It’s finished. It’s Done.
The problem is, as J.B. notes above (time stamp 7:15 and 8:30), those still living that life don’t seem to know it’s over.
For the leaders, the tiny minority and those reading this post, who are, or who have been preparing for years, it means potential huge (life changing) opportunities.
That is, as long as the markets, the banks and other infrastructure stay open; not guaranteed in any way.
Note: Posts on this site are for education purposes only. They provide one firm’s insight on the markets. Not investment advice. See additional disclaimer here.
It’s been a while since we’ve talked about the chief cook and bottle washer in this whole financial collapse scenario.
However, biotech has not been forgotten.
There are two indices (ETFs) being tracked: IBB and SPBIO.
Both entered bear market territory long ago. SPBIO topped out, way back in February 2021; IBB topped later, in August the same year.
Leveraged inverse funds are LABD, and BIS, respectively. LABD is 3X inverse with BIS a 2X inverse.
The Long Term
One thing unique to David Wies, was to look at the long term: Monthly, Quarterly and Yearly charts.
Doing so, puts one in a strategic mindset … not easily swayed by the latest prattle from media sources.
If we look at biotech, IBB, on a quarterly basis we have the following chart.
Biotech IBB, Quarterly
The mark-up of this chart is where it gets interesting.
A terminating wedge that’s been over seven years in the making has just broken to the downside.
Not only that, when we get closer-in (on the weekly), we can see the wedge break has been tested and now today, appears to be reversing to the downside (shown on daily).
Biotech IBB, Weekly
With zoom
The daily shows a Fibonacci retrace to 38%; then today, a downside reversal.
You can see where this is going.
Based on the above analysis a short position in IBB, has been opened via BIS (not advice, not a recommendation).
The trade is BIS-22-01, with an (initial) entry @ 28.5173
Summary
The news on specific biotech companies is already out if one knows where to look.
Stated time and again on this site, we’re just in the beginning stages of the repercussions.
It even looks like they’ve moved on from the initial scam and are cooking up a new one.
Note: Posts on this site are for education purposes only. They provide one firm’s insight on the markets. Not investment advice. See additional disclaimer here.