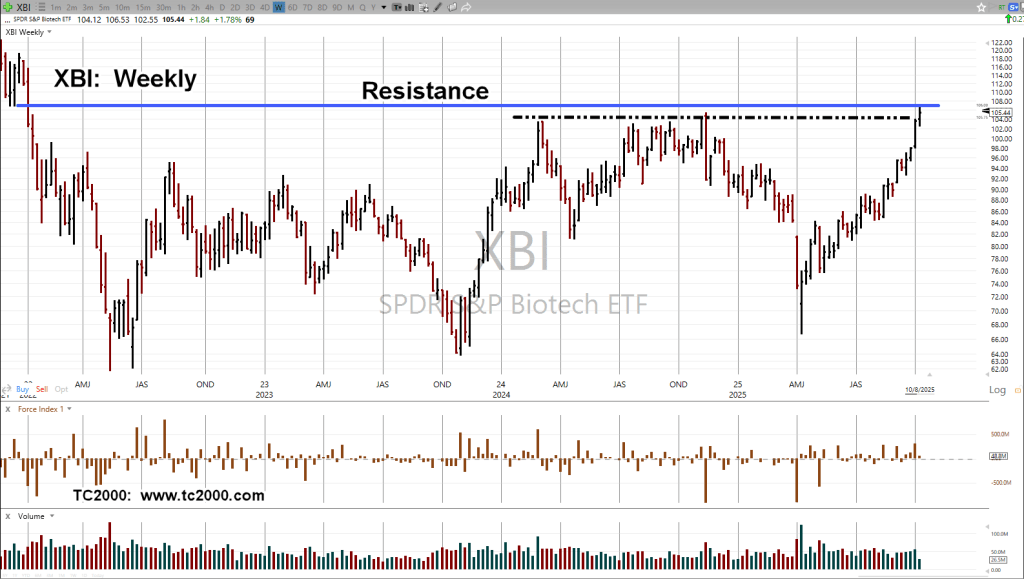
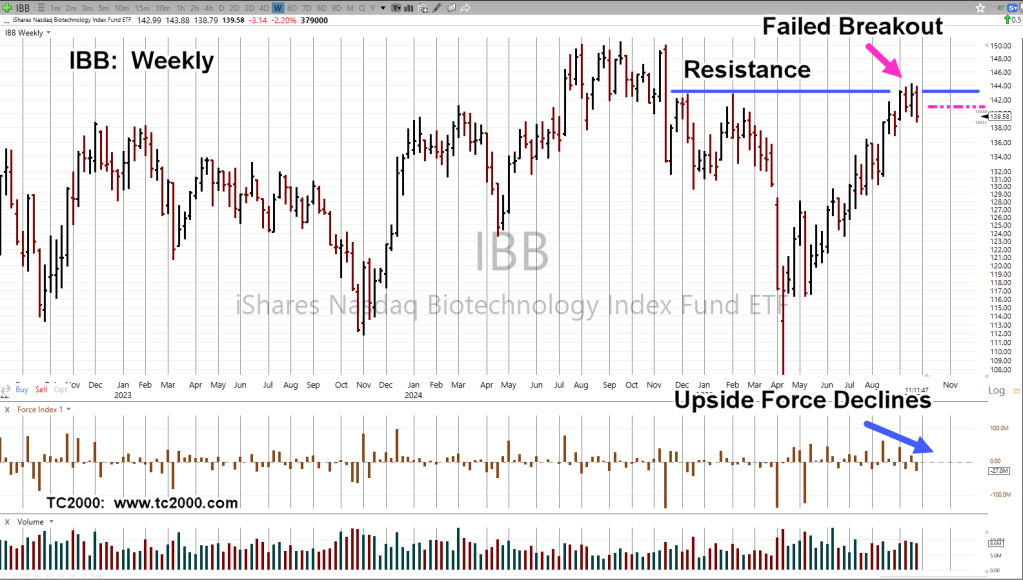
Both biotech funds, IBB, and XBI, are now in an up-thrust (potential reversal) condition.
In each case, the ETFs have pushed through a long-established trading range, straight into resistance.
The last update focused on less liquid IBB, because it was not known if heavily traded XBI, would push through its trading range (being the weaker of the two).
Since that initial update, both indices are now above their trading range.
Of course, what happens next is the question.
Biotech XBI, Weekly
The blue line is long established resistance.
The black dashed line is the top of the trading range and the up-thrust condition.
At this point anything can happen.
XBI, could reverse immediately or grind its way along, dissipate momentum, or even move higher.
We’re at the point where the risk of being wrong on a short position is least (not advice, not a recommendation).
Note: Posts on this site are for education purposes only. They provide one firm’s insight on the markets. Not investment advice. See additional disclaimer here.
Note: Posts on this site are for education purposes only. They provide one firm’s insight on the markets. Not investment advice. See additional disclaimer here.
The last update, presented a case for the SOXX top, a proxy for A.I.
Note: If the SOXX, has made its final high, it’s still very early in the reversal:
Wyckoff said a century ago, ‘It’s as if the weight of a feather can move the market in either direction’.
That’s where we are now.
For biotech (IBB, XBI), different forces are at work.
Biotech IBB, Weekly
The 38.2%, retrace from 9/19 high, to 9/25 low, is in the vicinity of 140.90 (magenta dashed line).
Fridays are typically biased to the upside.
There’s a possibility IBB, may test (upward) throughout the session, heading to (at or near) 38%, by the end of the day (not advice, not a recommendation).
Note: Posts on this site are for education purposes only. They provide one firm’s insight on the markets. Not investment advice. See additional disclaimer here.
Note: Posts on this site are for education purposes only. They provide one firm’s insight on the markets. Not investment advice. See additional disclaimer here.
Unfortunately, the (mad scientist) graphic at left, is not too far removed from what’s really going on in biotech.
While the S&P, Nasdaq Qs, Gold Miners, Semiconductors, Financials, The HOOD, ORCL, and others, continue to make all-time highs, conspicuously absent is biotech, XBI and IBB.
Now, it appears that quietly, in the background, XBI is reversing to the downside.
Biotech XBI, Daily Close
The up-thrust is there, but is a weak penetration of resistance.
Even so, on the ‘test’, volume contracted by -49.24%, when compared to volume on the upside penetration.
Until proven otherwise, this set-up appears to (currently) be the best short opportunity.
With that said, all other short positions have been closed to focus on biotech.
Leveraged inverse fund LABD is being used at this juncture: Trade LABD-25-10, with stop at the session low (not advice, not a reocmmendiaton).
Note: Posts on this site are for education purposes only. They provide one firm’s insight on the markets. Not investment advice. See additional disclaimer here.
There are sure to be plenty of post-mortems over the weekend; usual suspects giving us their assessment on what’s already happened. 🙂
Sometimes the question, is not ‘what’s happened’, but ‘what has not happened’.
That’s where the opportunity may lie.
Market Implosion
Over the past week, there were wide price bars, with action unstable in all major indices (ETFs): DIA, IBB, IWM, IYM, IYR, QQQ, SOXX, SPBIO, SPY, XLF, and XOP.
However, what did not implode (completely), are the car dealerships; specifically, CarMax and Carvana.
For this update, we’ll look at CarMax.
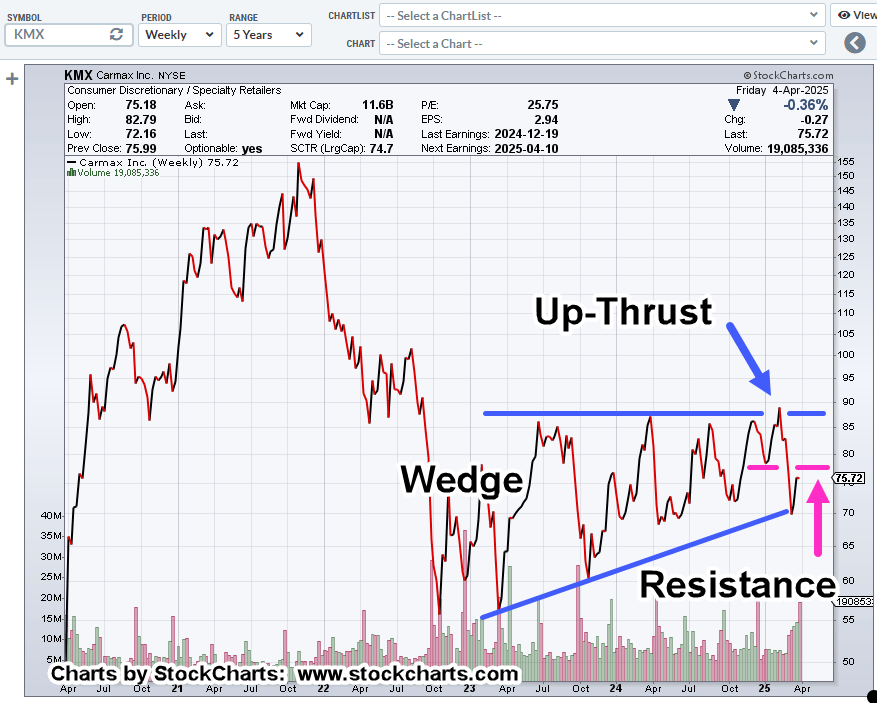
CarMax, KMX, Weekly Close
On a close basis, KMX, has bounced off the lower wedge boundary and is near the resistance area (magenta line).
Price action could be positively biased in the coming week as a result of ‘tax refund’ car buying (not advice, not a recommendation)
Note: Posts on this site are for education purposes only. They provide one firm’s insight on the markets. Not investment advice. See additional disclaimer here.
Over and again, this sector (IBB, XBI) is not participating in tandem with the other major indices.
Today’s pre-market mayhem higher over supposed slower outlays of possible trade tariffs to happen some-time, some-day, caused the major indices to launch upward. 🙂
Well, everybody seemed to be blasting higher except one sector, biotech.
Wyckoff Directed Action
No matter what the ‘narrative’ may be, Wyckoff analysis directs us to look at what the market is actually doing, then interpret the action.
Early after the open, trade TZA-25-01, was exited, +8.9% gain, short position opened in biotech via LABD, Trade: LABD-25-01 (not advice, not a recommendation).
Biotech XBI, Daily
Today posted outside down, taking out both the high and low of the prior session.
Note the trading channel and width, Fibonacci 13-Days.
Also note the two ‘breakaway gaps’. The second one on January 10th, much wider than November 12th, last year.
Note: Posts on this site are for education purposes only. They provide one firm’s insight on the markets. Not investment advice. See additional disclaimer here.
For a clue to the (potential) answer, we can look at what’s happening to Pfizer, link here and here.
However, let’s not get ourselves wrapped around the axle on events, forecast years ago.
Rather, let’s go straight to the truth, the price action and see what it’s telling us.
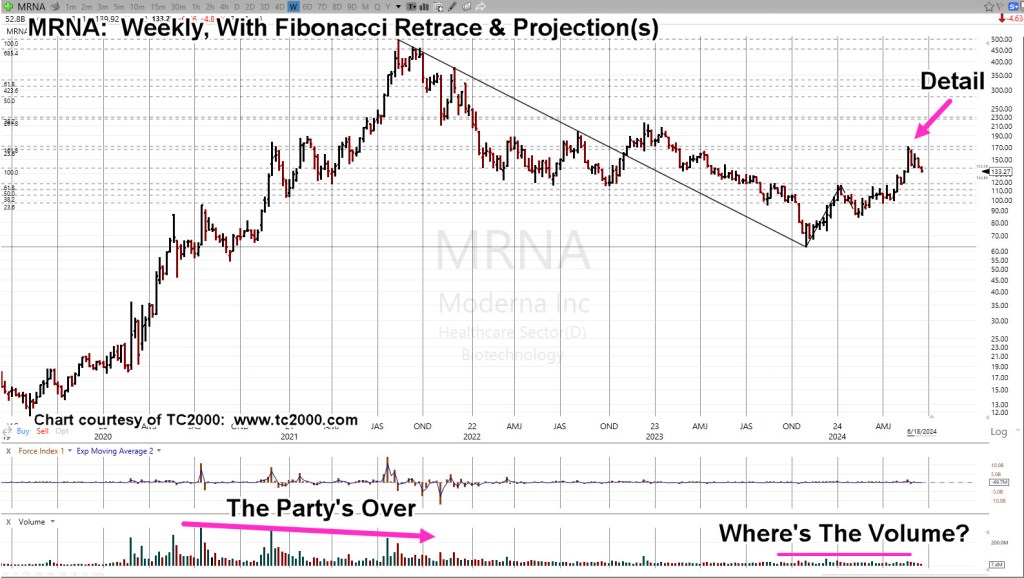
Moderna MRNA, Weekly
The entire move from low to highs is shown. Included on the chart, are two Fibonacci indicators.
One is the standard ‘retrace’ indicator; the other, is a ‘projection’ indicator.
The ‘projection’ is based off the ‘a-b-c’ move from the lows of November 2nd, 2023, to the highs on May 24, 2024.
The retrace and projections are hard to see, so the ‘Detail‘, arrow is where we’re headed next on the daily.
Moderna MRNA, Daily
If there ever was a chart to once-and-for-all, refute, dismiss, trash, the whole ‘Fundamentals’ argument, that earnings, interest rates or some other ‘Voodoo economics’, moves prices, this is it:
MRNA, price action hit the 23.6% retrace level (exactly) for two days before moving on to hit the 161.8%, projection (exactly) before reversing.
Note the ‘100%‘ level as well; price action confirmed this area (exactly) three times! Once on the way up and two times on the way down (third time, not shown).
A century ago, Livermore said, ‘It’s all about the numbers’.
Strategy, First
Just as Livermore was primary a strategist, so is this site’s method of analyzing the markets, i.e., Strategy, Tactics, Focus, in that order (not advice, not a recommendation).
The news has been replete with reports like this one and this one.
Another panic ahead?
Sounds like it but at least in the case of Moderna, the chart itself says (effectively):
‘There’s no money in it’.
That means, another wave like we saw several years ago, is not the most likely future event (not advice, not a recommendation).
Note: Posts on this site are for education purposes only. They provide one firm’s insight on the markets. Not investment advice. See additional disclaimer here.
Note: Posts on this site are for education purposes only. They provide one firm’s insight on the markets. Not investment advice. See additional disclaimer here.
Note: Posts on this site are for education purposes only. They provide one firm’s insight on the markets. Not investment advice. See additional disclaimer here.