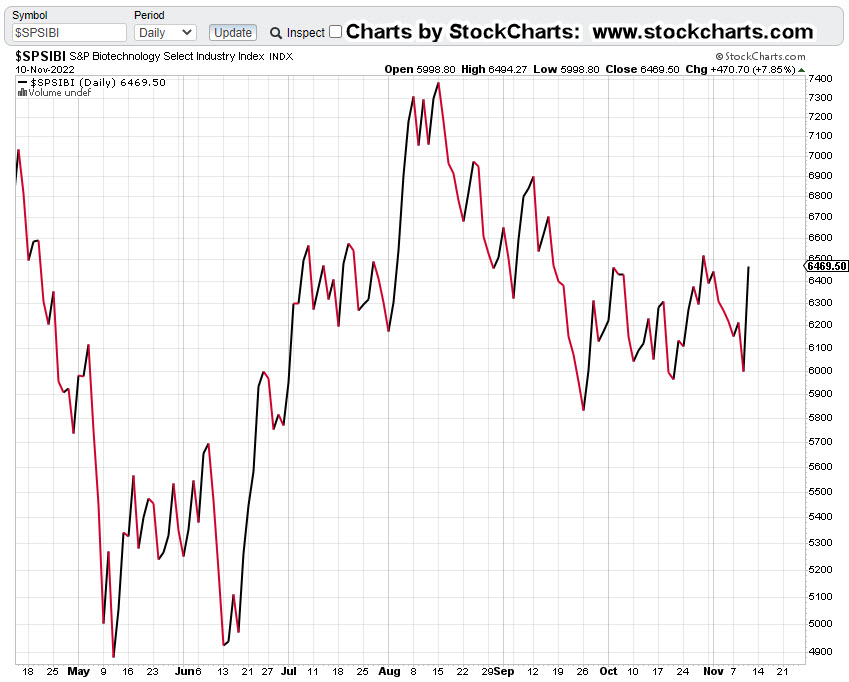
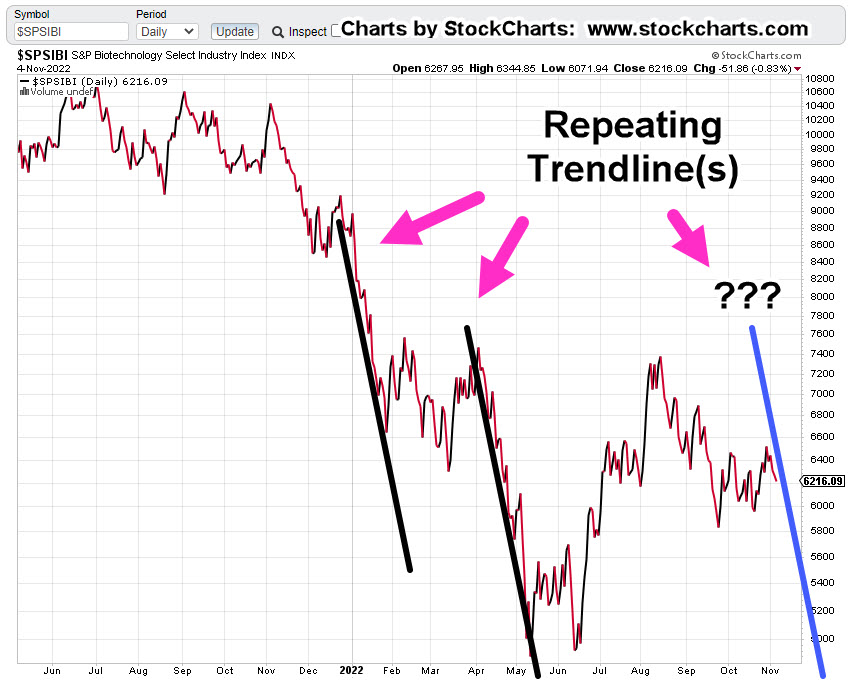
When looking at biotech sector (SPBIO) on a close basis, today’s action stopped just short of making a new closing high since the up-thrust (reversal) of October 28th.
Effectively, it’s a test of that reversal.
On to the analysis.
SPBIO, Daily Close
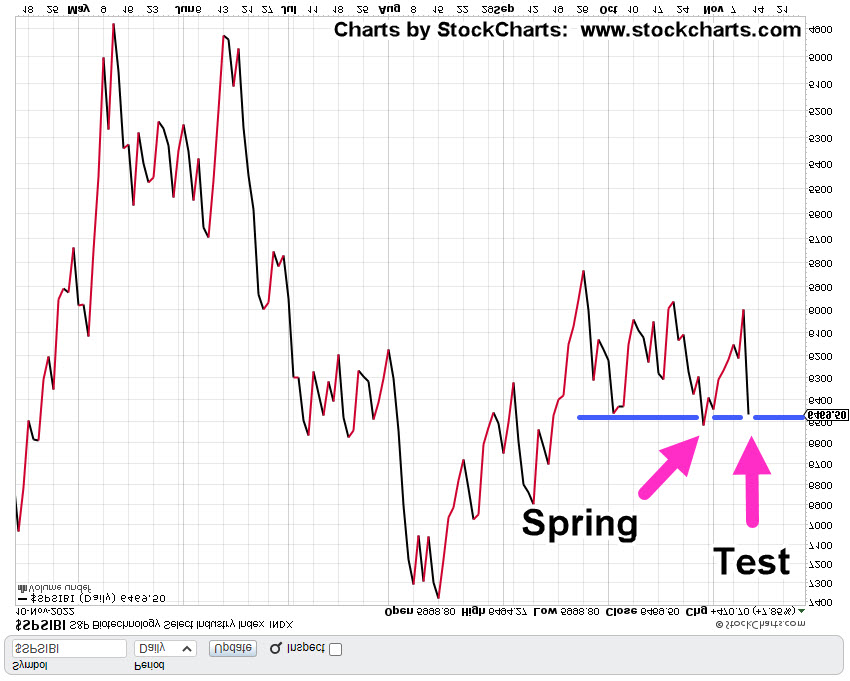
We’re going to put the chart below with no mark-up; then invert to show the potential trade set-up.
SPBIO, Daily Close, Inverted
Now, we’re inverted and marked to show penetration below support and then, today’s test.
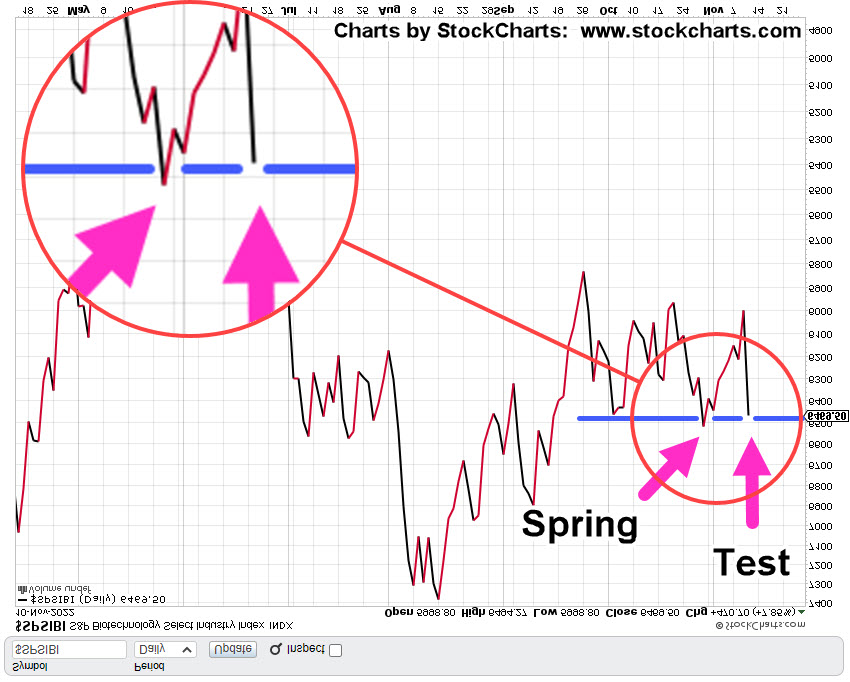
The zoom gets closer-in.
The market is stretched, no doubt.
In a way, it’s a good thing. Either the test will hold and SPBIO, will decline from here (in earnest) or there’s something else going on and we’ll exit to look for another trade (not advice, not a recommendation).
Positions, Market Stance (courtesy only, not advice).
LABD-22-09:
As stated, in the prior update, LABD-22-09, position size was reduced during the session by about 10%.
Special Note:
This sector and leveraged inverse LABD are highly volatile. Character of the market can change at any time.
Note: Posts on this site are for education purposes only. They provide one firm’s insight on the markets. Not investment advice. See additional disclaimer here.
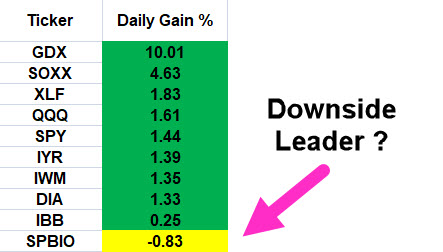
It looks bad for being short biotech and maybe it is.
However, as we’ll see below, the leveraged inverse fund LABD, could be completing its reversal set-up.
While today’s thrust higher in the overall markets was not unexpected (shown here and here), one should take note of the violence.
As of this post, from yesterday’s low to today’s high, the Dow has moved over 1,000-pts.
It’s what happens next that’s important.
Weak shorts are probably terrified, have covered, now wondering what went wrong.
So, let’s take a look at the short position on biotech SPBIO, and see if it really is ‘wrong’ (not advice, not a recommendation).
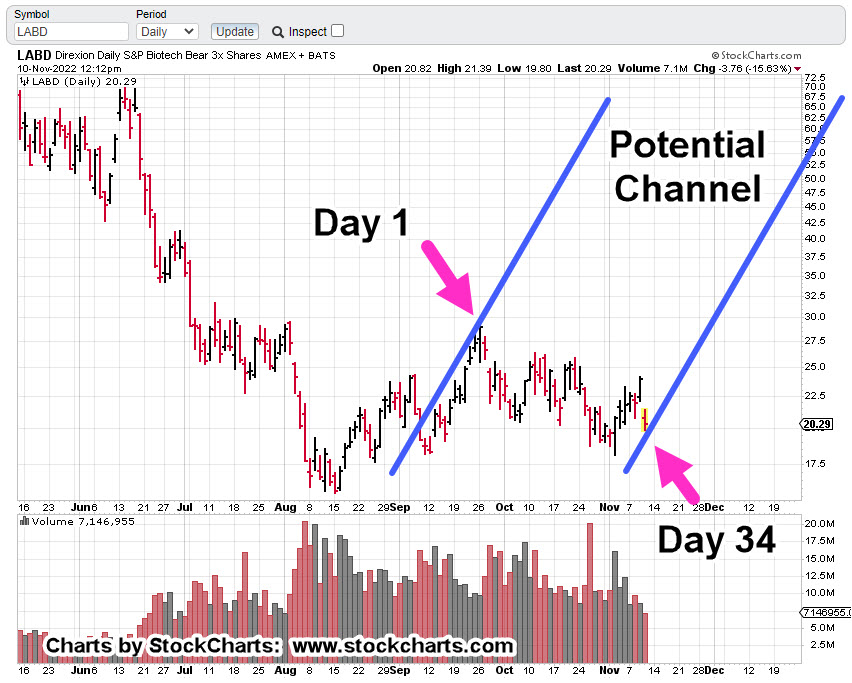
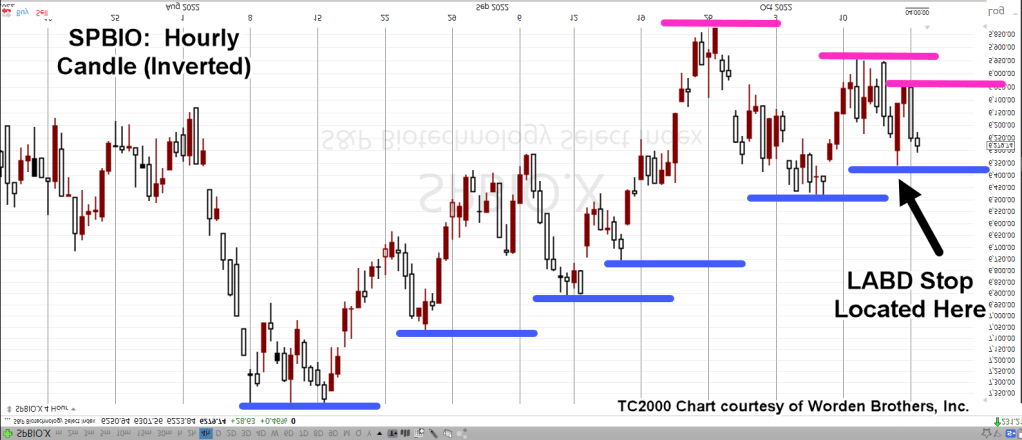
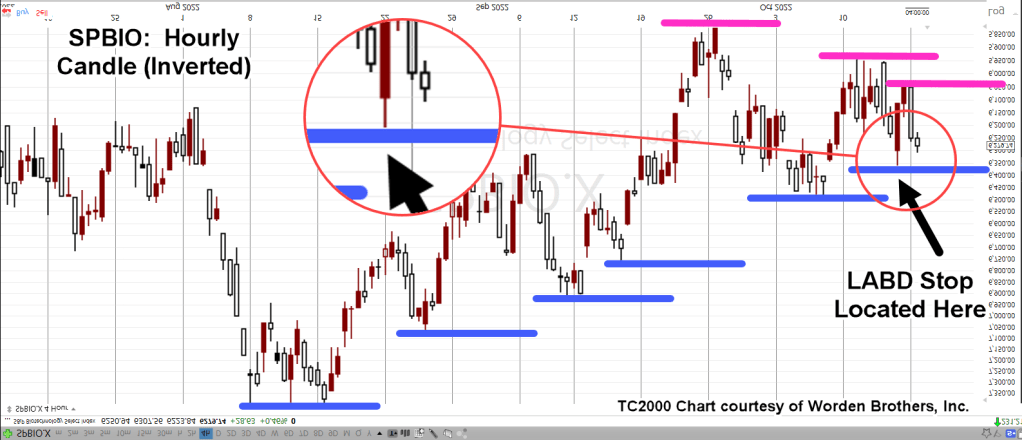
SPBIO, Leveraged Inverse Fund LABD, Daily
What we can see (above) is that LABD, is following the Wyckoff Schematic near exact for a spring set-up.
It’s just that today’s move is especially sharp and so one would think the set-up has failed … not so fast.
Another reason to think we’re completing a test of the spring, is below. Today is Fibonacci Day 34, from the high (low on SPBIO), set on September 26th.
We also have a potential trading channel as well.
As this post is being created, LABD is hovering at its lows; currently (as of 1:30 p.m., EST) trading at 19.89
Summary
Yesterday was an important day but it was not obvious, and not (yet) directly related to the markets.
A report was released on ZeroHedge (link here) which essentially confirms what some of us in the proletariat have known for years … if not decades.
It’s now out in the mainstream.
How long before the ‘elephant’ makes its way there also?
If indeed we’re at a reversal test of biotech and if that test passes (SPBIO downside continues), the move has the potential to be historic.
Positions, Market Stance (courtesy only, not advice).
LABD-22-09:
Price action blew through the stop located at 20.21 and is now hovering at those levels. The LABD position is being maintained but will likely be reduced in size as we head into the close (not advice, not a recommendation).
Special Note:
This sector and leveraged inverse LABD are highly volatile. Character of the market can change at any time.
Note: Posts on this site are for education purposes only. They provide one firm’s insight on the markets. Not investment advice. See additional disclaimer here.
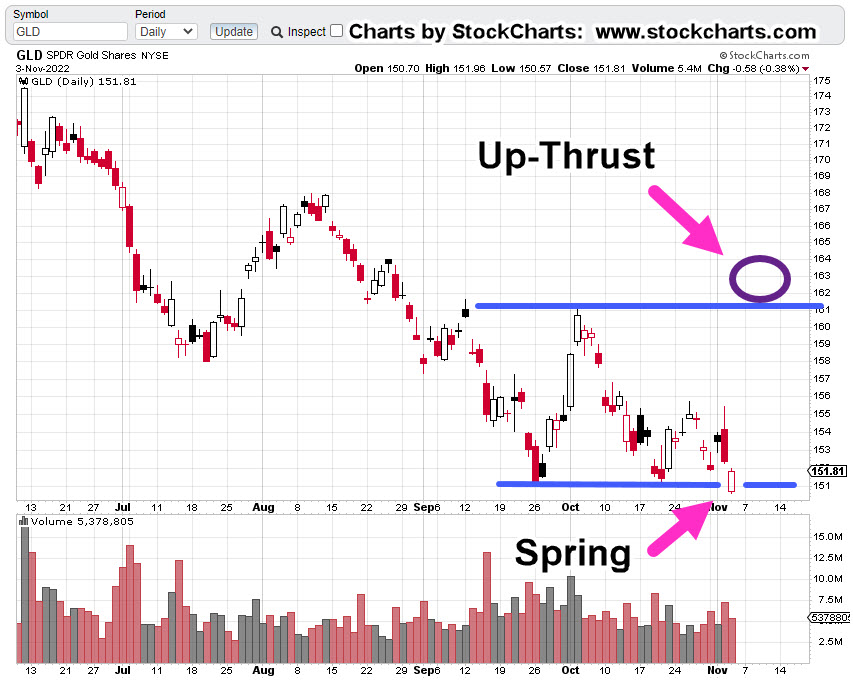
That first link even shows how far GLD, is likely to go, which at this point, is just ticks away.
Gold GLD, Daily
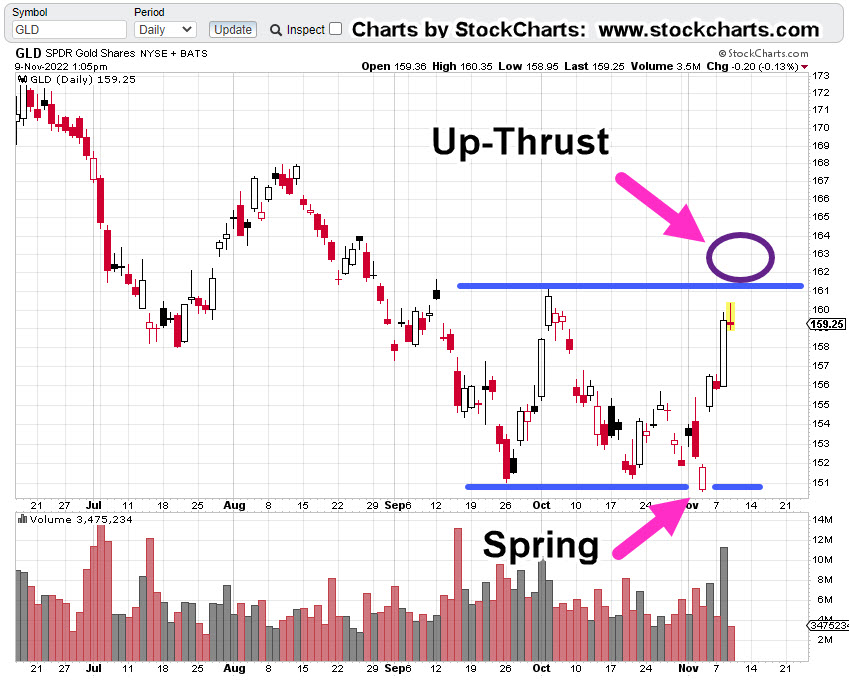
We’ll start first with the original forecast.
And the result (as of 1:20 p.m., EST).
We can see price action nearing the up-thrust (reversal) location.
Note: Penetration to the upside above resistance, does not necessarily mean it’s a short opportunity.
Any opportunity will be determined by price action itself.
Summary
Wyckoff analysis not only can provide potentials for price movement; when that move happens, it can also be a stabilizing factor so that one is not caught up in the usual media hysteria.
Meanwhile, back at the ranch, biotech sector (SPBIO) is still on track (ever so slowly) for a potential sustained move to the downside (not advice, not a recommendation).
Positions, Market Stance (courtesy only, not advice).
LABD-22-09:
Special Note:
This sector and leveraged inverse LABD are highly volatile. Character of the market can change at any time.
Note: Posts on this site are for education purposes only. They provide one firm’s insight on the markets. Not investment advice. See additional disclaimer here.
There’re a lot of moving parts to biotech and it’s like a game of chicken.
Is there going to be another ‘planned’ event pulled out of the bag that requires ‘protection’ or will this side (and this one) win-out before that happens?
Price action’s always the final arbiter and right now, it’s positing lower.
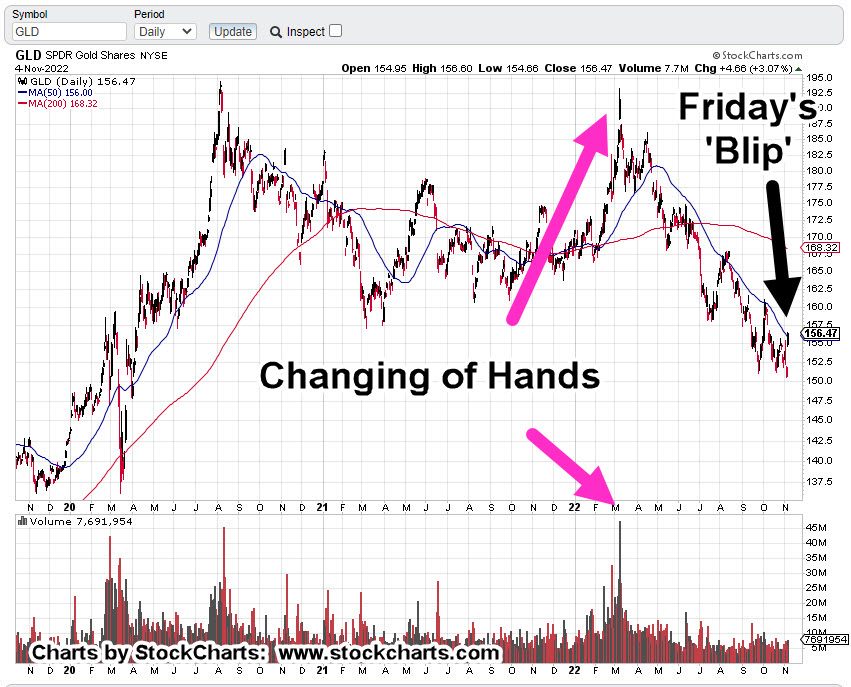
Gold:
Gold (GLD) ‘blipped’ higher on Friday and the usual suspects are out touting the hyperinflation narrative.
Owning (some) precious metals seems to be a good thing.
However, the public constantly knee-jerks into this sector and is absolutely rabid in their behavior (i.e., silver stockpiles are running out!!!).
It suggests at least, there’s something else afoot.
Prechter published in the early 2000’s, Central Banks, are followers, not leaders. The fact they are buying gold at this point, may be a contrary indicator.
Talk about going against the herd. 🙂
Over and again, it’s the boring (does not generate ‘clicks’) food supply first, then gold and silver (not advice, not a recommendation).
Real Estate:
What can be said?
It’s the largest manufactured bubble in world history and it has already popped.
Thinking it’s all going to sort itself out in a year or two is delusional. We’ve probably got decades of bear market.
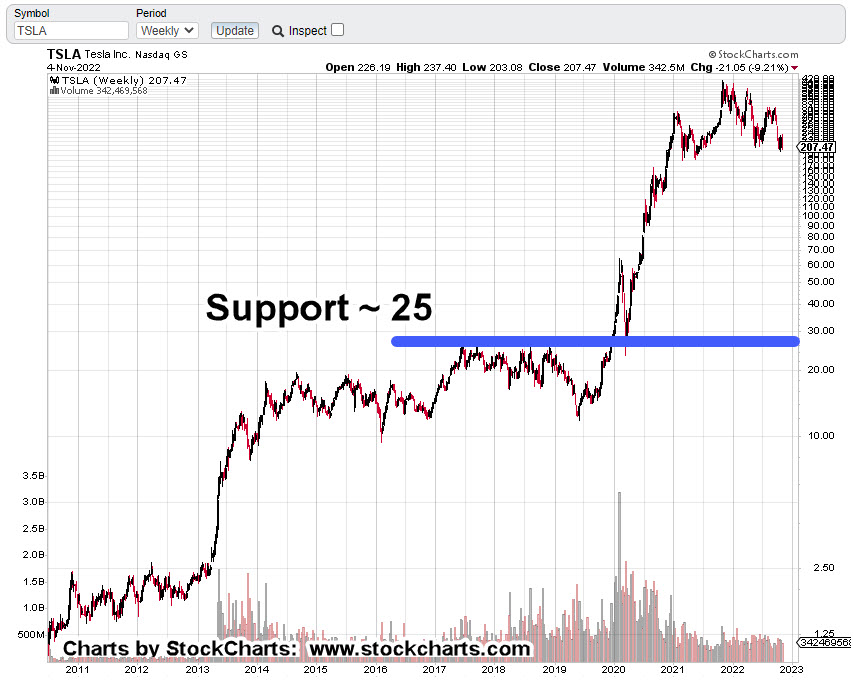
Tesla:
Anyone with an anode of research capability, knows the whole EV premise, is based on a falsehood.
However, that fact is probably not what’s going to bring Tesla (and the rest of the market) down.
Let’s stop for a moment and consider the above link which has been available for nearly four-years.
How many views? Just 9,824 (as of this post)
That equates to only 0.003% of the U.S. population.
As the global supply chains implode, getting parts and having stable infrastructure (i.e., electricity) will probably be the defining factor.
Now, on to the charts.
Biotech SPBIO, Daily Close
The following sessions will let us know if we’re at the right edge of the downtrend line.
We’ve already had an up-thrust reversal and a test of that reversal. last Friday was lower … probabilities point down.
Gold GLD, Daily
Looking at the chart on the strategic, longer term, Friday’s blip is hardly noticeable. We’ve already presented how this could be a minor up-thrust (reversal) in itself.
To keep the upside intact, price action must remain and continue above current levels.
Real Estate IYR, Daily
Real estate may be working its way into an up-thrust condition. As shown, Fibonacci Day 21 from the October 13th, low is this coming Thursday, the 10th.
According to the Economic Calendar there are several potential catalysts that may push the price above resistance (temporarily).
Note: Posts on this site are for education purposes only. They provide one firm’s insight on the markets. Not investment advice. See additional disclaimer here.
In probably his best video update since he stared in early 2015, he lays out the details of what’s ahead.
Although not well versed in the markets (and he says so), he has enough experience, life-knowledge, to understand the current potential and likely outcome.
That is, ‘relentless collapse’.
Those of us who have been getting ready for years, know that we still aren’t ready. How can anyone be fully ready for a complete systems breakdown.
One ‘system’ that’s set for implosion and has been since before ‘The Speck’, is biotech.
Biotech: Cue The Implosion
It’s been an on again, off again, back on, and so on, with this index (SPBIO).
Every day now, sometimes multiple times a day, we see the effects of their ‘protection’. Wheels are in motion and we’re most likely just getting started … for decades to come.
Yesterday’s Fed announcement, may have (finally) provided the up-thrust and reversal needed to get this index in a sustained down move.
Biotech SPBIO, Daily Close
The daily chart shows the up-thrust test and reversal.
We’ll get into downside potential(s) in an upcoming post.
For now, the positioning remains unchanged (not advice, not a recommendation).
Positions, Market Stance (courtesy only, not advice).
TMF-22-01:
Entry @ 7.166, Stop @ 6.77
LABD-22-09:
Entry @ 19.88, 19.71, Stop @ 18.69
Note: Positions may be increased, decreased, entered, or exited at any time.
Note: Posts on this site are for education purposes only. They provide one firm’s insight on the markets. Not investment advice. See additional disclaimer here.
Of course, the already hammered bond market (TLT), got hammed some more.
It’s what happened next, and what’s happening today, that’s important.
That is, the sell-off was quickly reversed (to the upside) with that upside continuing this session.
The bond supply is being absorbed.
So, what does that mean?
It’s possible, the bounce, melt-up, squeeze or whatever one wants to call it could be over. There may already be a ‘flight to safety’ if there’s such a thing these days.
But let’s not hypothesize on what could be happening. The market itself (price action), tells us.
Bonds TLT, Daily
At about mid-session, this is where we are.
We’re right at the downtrend line.
The attempt to mover lower (yesterday), has been rejected.
As a result of today’s new daily high, the stop on position TMF-22-01, has been moved up (not advice, not a recommendation).
So, we’re now between the downtrend and the ‘rejection’; something’s likely to break.
Summary
The S&P (SPY) just posted an up-thrust reversal early this session and is still moving lower as of this post.
Keep in mind, all of this is happening before any Fed announcement … as if the market has already decided.
A quick note on biotech, SPBIO.
Position size has been increased in SPBIO, leveraged inverse LABD, as shown below (not advice, not a recommendation).
This sector remains at The Danger Point®
If the bounce really is over, biotech is likely to get hit the hardest.
Positions, Market Stance (courtesy only, not advice).
TMF-22-01:
Entry @ 7.166, Stop @ 6.77***
***, Indicates change
LABD-22-09***
Entry @ 19.88, 19.71***, Stop @ 18.69***
Note: Positions may be increased, decreased, entered, or exited at any time.
Note: Posts on this site are for education purposes only. They provide one firm’s insight on the markets. Not investment advice. See additional disclaimer here.
Instead of upside follow-through, we had downside test and reversal.
Gold:
GLD, closes lower and is now down seven consecutive months … a record for the tracking ETF.
Biotech
Index SPBIO, has been attempting to move higher, with it posting into an up-thrust last week.
Today it couldn’t hold the upside; now looking like a nascent reversal.
Note: Position changes at the bottom of this update.
The test and reversal in bonds (TLT) is obvious and there’s no open position in GLD.
So, we’ll focus on biotech.
Biotech ($SPSIBI, SPBIO) Daily
The zoom area of the chart shows price action just can’t seem to get above resistance (blue line).
Successive attempts were made throughout today’s session to go higher, but it didn’t happen.
Getting in closer on the hourly chart, we see the apparent upside failure during the last hour of trading.
Biotech SPBIO, Hourly
There is no doubt where at The Danger Point®
Right about mid-session, a short position was opened via LABD (not advice, not a recommendation) as LABD-22-09.
Summary
Today’s expectation for bonds was a follow-through to the upside … it didn’t happen.
In response, the initial TMF-22-01, position was closed with the secondary remaining open (not advice, not a recommendation).
Meanwhile, biotech SPBIO, was having its own problems; that is, being in up-thrust condition and not being able to make a new daily high. i.e., The Danger Point®
Positions, Market Stance (courtesy only, not advice).
TMF-22-01:
Entry @ 6.705, 7.166, Stop @ 6.68
Partial Exit @ 7.053***
***, Indicates change
LABD-22-09***
Entry @ 19.88***, Stop @ 18.94***
Note: Positions may be increased, decreased, entered, or exited at any time.
Note: Posts on this site are for education purposes only. They provide one firm’s insight on the markets. Not investment advice. See additional disclaimer here.
After the last post, was released, looking at the after-hours action, there was one more possibility for SPBIO, to subdivide (higher) and still be in an overall downtrend.
It was the skinniest of margins, the eye of the needle but that’s what we got with yesterday’s price action.
While the rest of the market remains hypnotically fixated on bull or bear and who’s right, one is reminded of the old Ned Davis, trading adage; ‘Do you want to be right, or do you want to make money?’
The tape is always right.
Yesterday, biotech SPBIO, made one last subdivision to the only level it could go while still remaining in a downtrend.
Follow The Rules … Break The Rules
That title is borrowed from the interview with Ed Seykota in the book Market Wizards.
Late Monday night, looking at the after-hours, it was obvious price action might blow through the LABD stop at the next session.
With that in mind, a forecast of price action was drawn on the hourly chart of LABD.
That forecast (drawn on the broker’s platform) showed the conditions under which the rules would be broken, the position held, and the stop temporarily ignored.
Replicated on the Worden Brothers, platform (below), is a representation of that forecast.
SPBIO, Leveraged Inverse LABD, Hourly
Wednesday (today) Early Session
Judge for yourself. We’re interested in the form of the action and not necessarily the time required.
It was thought the reversal would be complete in a day; looks like it’s a day and an extra 30-minutes. 🙂
The Challenge
To those seriously addressing (working) the markets; Challenge yourself to draw the ‘excepted action’ of the market before and after taking a position.
If your forecast does not match, then obviously something else is happening. Is that ‘something’ in line with acceptable price action for your position … only you can decide.
Summary
The short position in biotech (LABD-22-08) has been maintained (not advice, not a recommendation). Now that it looks like a reversal, this sector could be in serious trouble.
All the while, the fundamentals continue to build.
Note: Posts on this site are for education purposes only. They provide one firm’s insight on the markets. Not investment advice. See additional disclaimer here.
As we’ll see below, SPBIO, has oscillated itself into a decision point.
From a positioning standpoint, my firm has taken a bearish stance on biotech via LABD (not advice, not a recommendation).
Yesterday’s update anticipated more SPBIO, downside which did not happen.
Instead, we got a test of the latest SPBIO, high.
This testing action does not negate the short via LABD, but it’s now very close.
Once again, we’ll use an inverted chart of SPBIO to mimic the action of leveraged inverse fund LABD.
Biotech SPBIO, Hourly (Inverted)
The blue lines are subdivisions higher and the magenta, subdivisions lower.
The zoom chart below shows just how close we’re to short-set-up, exit. If SPBIO posts a new daily high, by definition it will push past the LABD, stop and the trade will close (not advice, not a recommendation).
Strictly speaking, in the chart above, the ‘risk’, is the distance between the latest hourly low for SPBIO (Inverted) and the stop location at the black arrow.
That’s approximately 50-pts on the SPBIO, chart which corresponds to about 0.43pts for LABD.
After hours action (5:57 p.m., EST) has LABD, trading lower -0.37pts, or -1.68%, @ 21.68, but still above the prior stop location @ LABD 21.23.
Note: Posts on this site are for education purposes only. They provide one firm’s insight on the markets. Not investment advice. See additional disclaimer here.
We’re going to use the chart from yesterday’s post to set the stage for getting closer-in.
This past Friday’s early morning ‘spike’ is barely visible; the 30-minute (inverted) chart below, has more detail.
SPBIO, 30-minute (Inverted)
Price action rejected the lower levels (higher on SPBIO) and pulled away throughout the session. That ‘pulling away’ continued on, all the way into the close.
That’s a clue there may be follow-through at the next session.
If the early session opens ‘gap-higher’ (SPBIO, lower), into the resistance area (four magenta arrows, hourly chart), it would be the fourth time pressuring at this area; markets rarely hold a fourth attempt.
Summary
Of course, other markets are being watched like real estate (IYR), Tesla (TSLA), and even Basic Materials (DJUSBM), a potential sleeper for significant downside.
Updates are planned if/when low risk shows up.
Positions: Current Stance (courtesy only, not advice).
The following is the positioning of my firm’s main (largest) account.
Note: Posts on this site are for education purposes only. They provide one firm’s insight on the markets. Not investment advice. See additional disclaimer here.