Note: Posts on this site are for education purposes only. They provide one firm’s insight on the markets. Not investment advice. See additional disclaimer here.
There are sure to be plenty of post-mortems over the weekend; usual suspects giving us their assessment on what’s already happened. 🙂
Sometimes the question, is not ‘what’s happened’, but ‘what has not happened’.
That’s where the opportunity may lie.
Market Implosion
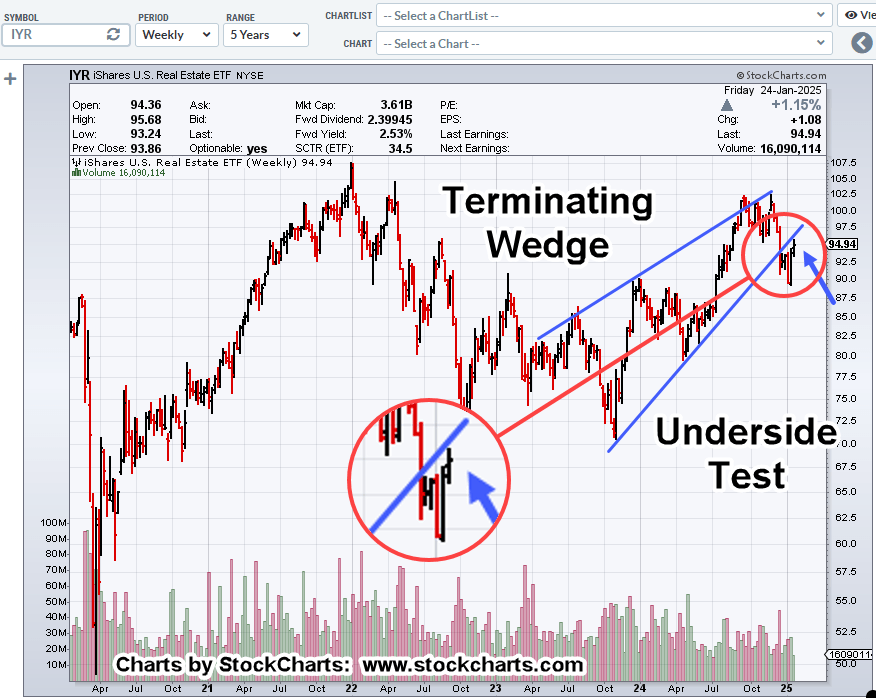
Over the past week, there were wide price bars, with action unstable in all major indices (ETFs): DIA, IBB, IWM, IYM, IYR, QQQ, SOXX, SPBIO, SPY, XLF, and XOP.
However, what did not implode (completely), are the car dealerships; specifically, CarMax and Carvana.
For this update, we’ll look at CarMax.
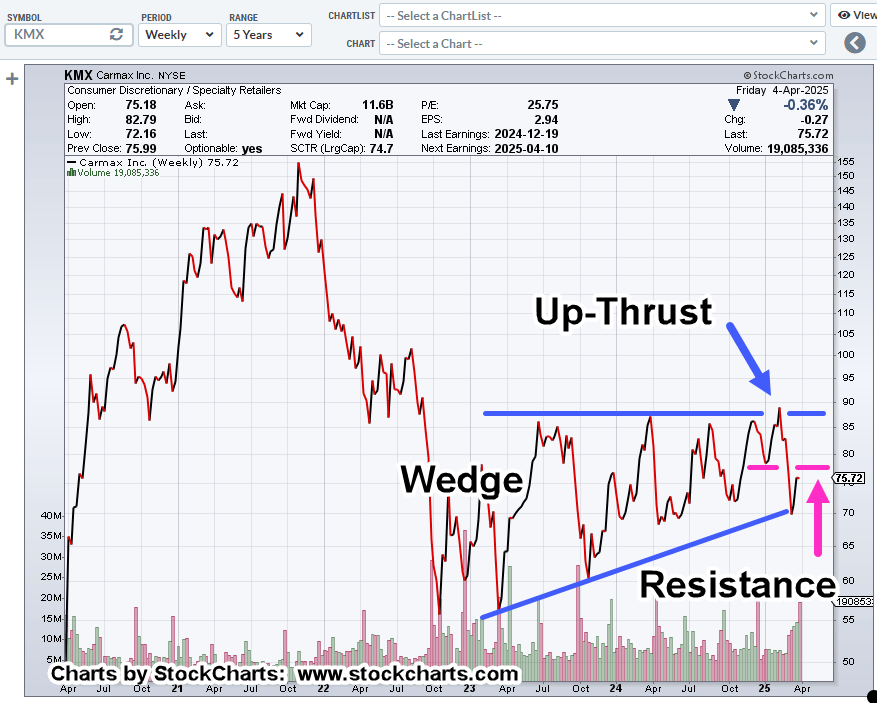
CarMax, KMX, Weekly Close
On a close basis, KMX, has bounced off the lower wedge boundary and is near the resistance area (magenta line).
Price action could be positively biased in the coming week as a result of ‘tax refund’ car buying (not advice, not a recommendation)
Note: Posts on this site are for education purposes only. They provide one firm’s insight on the markets. Not investment advice. See additional disclaimer here.
The Good: Only the Senior Miners, GDX, have managed to claw their way past the highs set nearly five years ago in August of 2020.
The Bad: Junior Miners GDXJ, remain below that August ’20, level.
The Ugly: Silver Miners SILJ, are the worst, having their peak a bit later in February of 2021; they remain over -35%, below their highs.
The Market Rolls Over
Yesterday, Friday, was a down day for the Dow, S&P, The Qs, Transports, Airlines, Semis, nearly everyone.
For some of these indices, their all-time highs were posted months, if not years ago.
There may be some (bidding) ‘defensive’ action with gold (GLD) continuing higher; as said in earlier posts, the rest of the monetary metals are far below their highs.
Let’s look at the weakest; the silver miners, as they are likely going to be the ones most affected by an economic decline (not advice, not a recommendation).
Silver Miners, SILJ, Daily
We’re at an interesting spot.
Friday was a down day that pushed below existing support, shown in zoom area.
We have simultaneous action.
Once resistance was penetrated on March 18th, it could not hold. After eight trading days, on Friday, it posted lower on heavy volume.
However, we can see that SILJ, is now in (a minor) Wyckoff ‘spring’ position. So, the question is, what happens next?
Note: Posts on this site are for education purposes only. They provide one firm’s insight on the markets. Not investment advice. See additional disclaimer here.
Note: Posts on this site are for education purposes only. They provide one firm’s insight on the markets. Not investment advice. See additional disclaimer here.
While everyone else is focused on a ‘tradable bounce’ in the S&P, with others in a freak-out on gold, back at the ranch, biotech has continued to sub-divide lower, getting weaker and weaker, still.
Note: All trades presented on this site during 2024 (ex: UNG), and 2025, have been to the short side (not advice, not a recommendation).
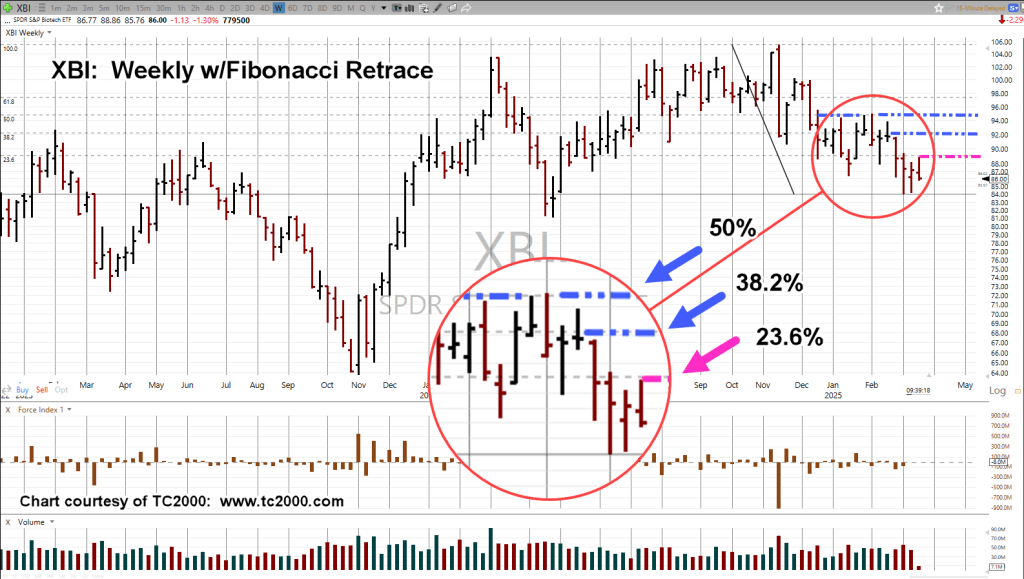
Biotech XBI, Weekly
The chart highlights the Fibonacci retrace levels.
A Fibonacci 23.6%, retrace is rare; markets typically like to go to 38.2%, or 50%.
If this retrace holds, it indicates significant weakness in the sector (not advice, not a recommendation).
As can been seen in the side-bar, current biotech short is LABD-25-03, with stop at yesterday’s LABD, session low (not advice, not a recommendation).
Not shown on the chart, a trading channel that appears to be in-effect.
Note: Posts on this site are for education purposes only. They provide one firm’s insight on the markets. Not investment advice. See additional disclaimer here.
Note: Posts on this site are for education purposes only. They provide one firm’s insight on the markets. Not investment advice. See additional disclaimer here.
Note: Posts on this site are for education purposes only. They provide one firm’s insight on the markets. Not investment advice. See additional disclaimer here.
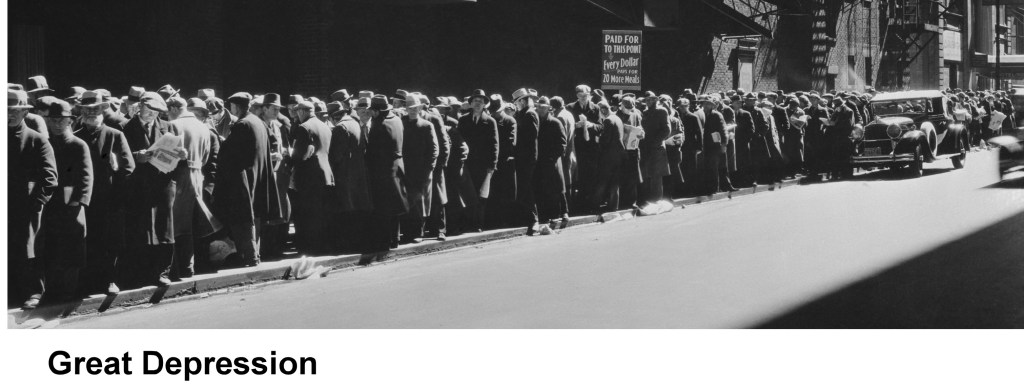
The last time we had a major (sustained) economic melt-down, was 2007 – 2008.
The market (S&P) bottomed on March 9th, 2009, posting a low at 666.79.
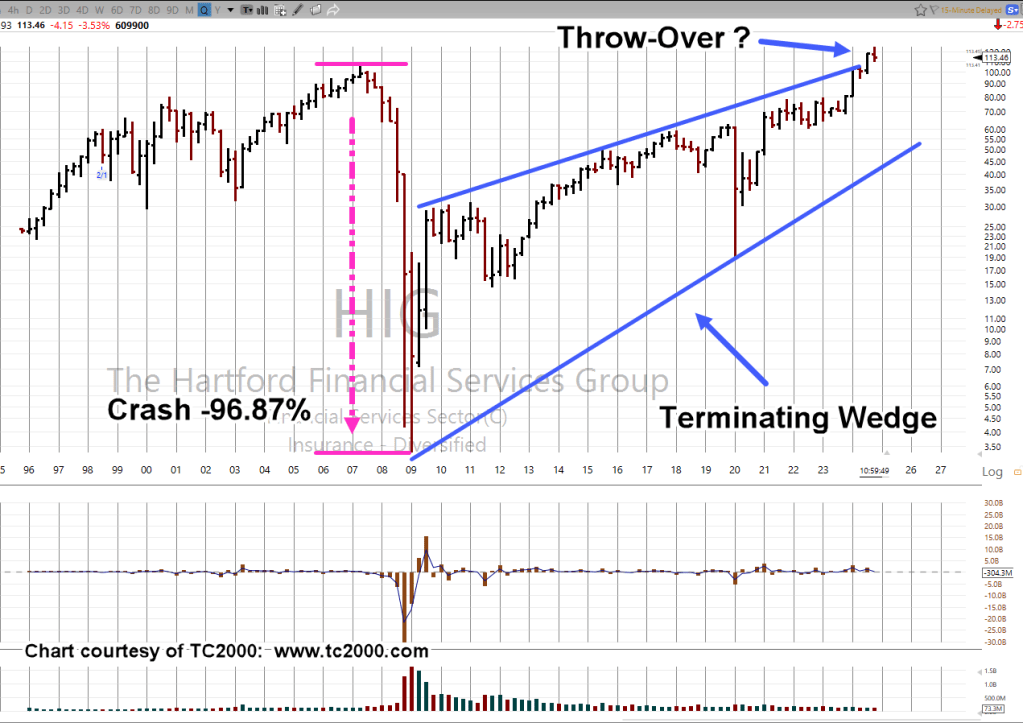
During that collapse, Hartford Financial was one of the hardest hit.
It imploded, crashed, by -96.87%.
It’s important to note, HIG bottomed at 3.33, during the week-ending, 3/6/09; you can’t make this stuff up. 🙂
So, let’s take a look at what HIG, is doing now and if it’s at risk, yet again (not advice, not a recommendation).
We’re looking at the long-term, the Quarterly Chart
Hartford Financial, HIG, Quarterly
With just a few weeks left in the Quarter, HIG is positing a reversal.
From a classical analysis standpoint, a reversal back into the wedge (and then upside test) would be a potential sell-signal (not advice, not a recommendation).
Note: Posts on this site are for education purposes only. They provide one firm’s insight on the markets. Not investment advice. See additional disclaimer here.
From a price action standpoint, we have an outside down weekly bar as well as (potential) monthly reversal.
Despite fever-pitch, ‘the world’s ending’ talk on gold and (supposed) silver breakouts, we’re reminded here (time stamp 3:10) to expect a downward spike in gold should there be (serious) international trouble (not advice, not a recommendation).
Newmont’s the largest cap in the GDX; let’s take a look at the sector.
Senior Miners, GDX, Weekly
GDX, in the same vein as IWM, NVDA, SOXX, SPY, and TLT (to name a few), posting its own terminating wedge.
Noted in the chart, GDX has entered back into the wedge formation after a ‘throw-over’; typically, a bearish sign (not advice, not a recommendation).
Note: Posts on this site are for education purposes only. They provide one firm’s insight on the markets. Not investment advice. See additional disclaimer here.
Note: Posts on this site are for education purposes only. They provide one firm’s insight on the markets. Not investment advice. See additional disclaimer here.