Note: Posts on this site are for education purposes only. They provide one firm’s insight on the markets. Not investment advice. See additional disclaimer here.
According to this link, it’s not only higher taxes, but retirement accounts being hi-jacked through rule changes.
‘The bulk of the wealth of the American people.’
Not to be outdone, the IRS will increase penalties for under and overpayment of taxes as reported by Fox Business via Jerimiah Babe (time stamp 22:16).
At least it’s nice to know, implementation of the ‘$600’ rule will be saved until next year. 🙂
So, we have the context for the year 2023; i.e., wealth destruction, asset confiscation, fines and fees.
It’s a straightforward plan on ‘their’ part.
What’s also straightforward as reported by Babe, a large number of Americans don’t even know what’s going on let alone be willing to take action.
Then, The Elephant
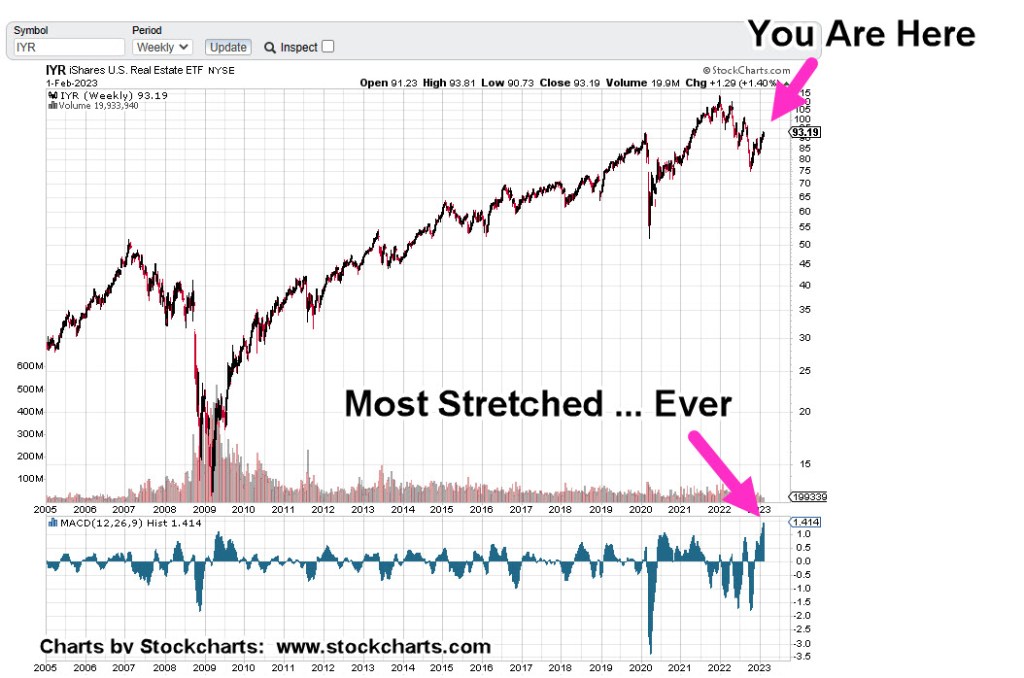
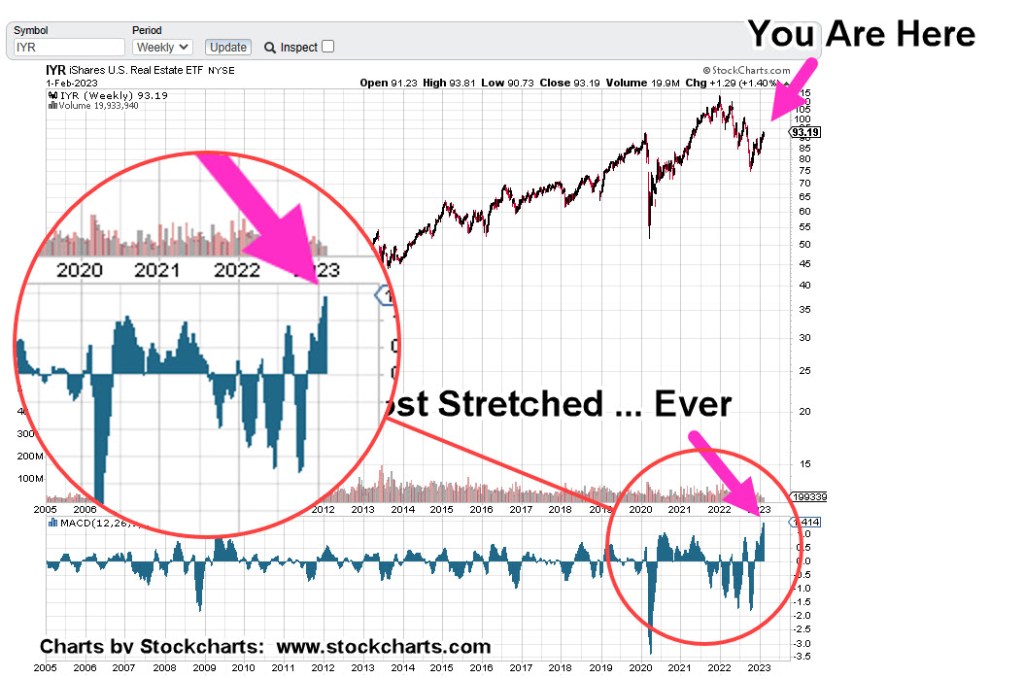
Let’s not forget the ‘elephant’ that’s likely to be the biggest driver for 2023.
We see that elephant every day now and sometimes multiple times a day. It’s starting to reach the fringes of the mainstream with articles like this one.
Scroll down to The List … It’s No. 2
That elephant and its subsequent lack of demand (less population, fewer buyers) as a result, will likely affect real estate in a big way … for decades to come (not advice, not a recommendation).
The last update showed the weekly trading channels in IYR. The next chart goes further out to the monthly and identifies a Fibonacci sequence.
Real Estate IYR, Monthly
So far, we’ve had IYR on the daily (link here), the weekly (link here), and now the monthly, below.
Major inflection points on the monthly have occurred at Fibonacci timeframes.
Original Forecast, October
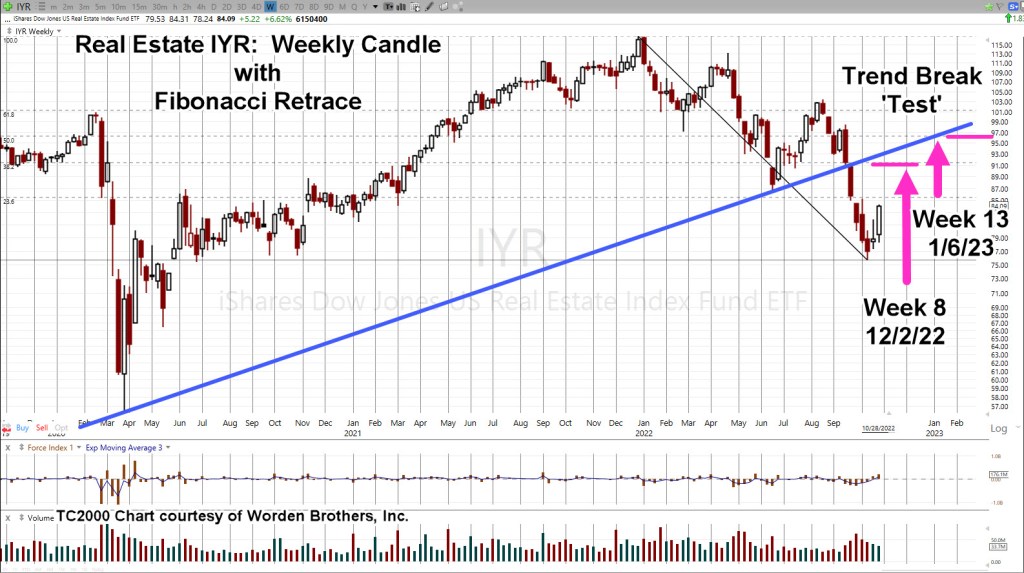
The analysis of the current set-up started way back in late October. Using a weekly chart, a potential Fibonacci sequence was identified that ultimately proved correct.
Real estate IYR, had its print high during Fibonacci Week 8, as shown below in the original forecast.
The next chart shows where we are now, again on the weekly timeframe.
Real Estate IYR, Weekly
Original Analysis & Forecast
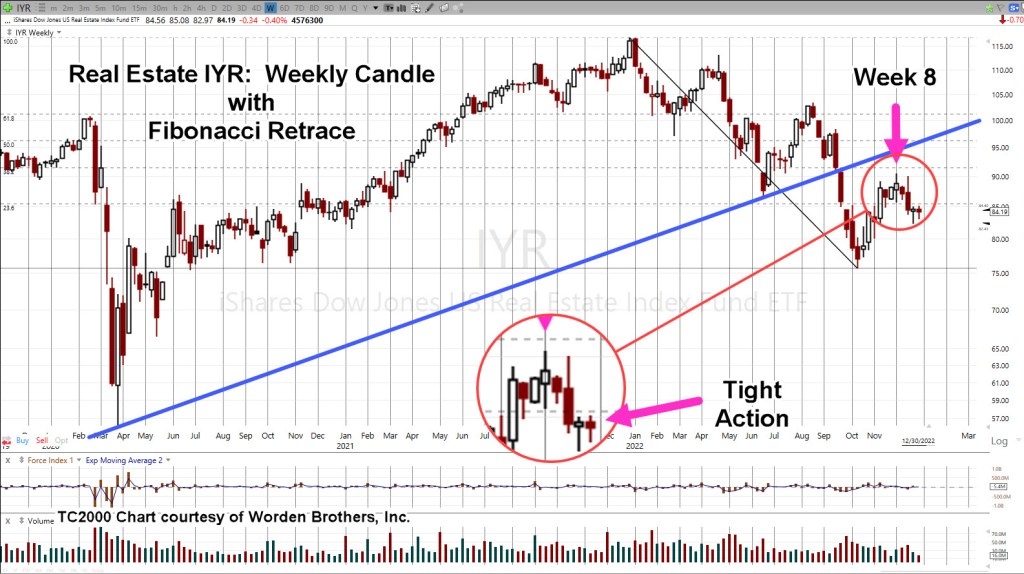
The updated chart shows the subsequent price action.
Real estate IYR, has pivoted lower and posted tight price action over the past two weeks. Tight action typically precedes a breakout or directional move.
Summary
Anything can happen in the markets.
Even though a good analysis has been presented to indicate further downside for IYR, this Tuesday’s action will let us know for sure.
Typical vehicles to go short the sector are leveraged inverse funds DRV (-3X) and SRS (-2X) or to short the IYR directly (not advice, not a recommendation).
Note: Posts on this site are for education purposes only. They provide one firm’s insight on the markets. Not investment advice. See additional disclaimer here.
And so it was. Short position in real estate, closed out.
Even with all the analysis, real estate (IYR) has pushed higher. The short position via SRS (SRS-22-01) was exited just below the stop @ SRS 16.33.
Exiting a trade, frees the mind to look elsewhere for opportunity.
Typically, one would have to wait days or even a week or so for something else to be available.
However, despite appearances, the market is moving very fast at this juncture.
Looking around in those markets, we have a textbook entry signal (to go short) the FXI (not advice, not a recommendation).
David Weis & The Video
Many times, on this site (actually, for years), the Weis video has been recommended.
Next to Wyckoff’s treatise from 1910, Studies In Tape Reading, that video is probably the most important one could ever watch concerning the markets.
In it, he describes a ‘trick’ as he calls it, to get aboard a market that’s already underway. At the time, his discussion was using DE (if memory serves), as the trading vehicle.
That ‘trick’ is highlighted below on FXI
China Index FXI, Daily
This is how the chart looks early in today’s session.
Next, we’re going to invert the chart to mimic what’s seen on leveraged inverse fund YANG.
And now, the signal zoomed-in
The above price action is nearly exactly as presented in the Weis video; even though it was recorded fifteen-years ago.
The above signal is not a guarantee.
It is, however, a high probability low risk set-up (not advice, not a recommendation).
The entry signal was triggered at approximately YANG 11.75, with a stop at YANG 11.02, for a ‘risk’ of 0.73/share (not advice, not a recommendation).
Summary
As this post is being created, YANG is retracing and is currently trading near 11.67, narrowing the distance from any potential entry to the stop.
On a very long term (Monthly) basis, there are interesting things happening in FXI. We’ll be covering that soon in another update.
Note: Posts on this site are for education purposes only. They provide one firm’s insight on the markets. Not investment advice. See additional disclaimer here.
The Danger Point®, trade mark: No. 6,505,279
Active: YANG (YANG-22-02), entry @ 11.83, with stop @ 11.30
Anyone who thinks the Fed’s going to ‘pivot’ because the numbers are weak, does not understand (or won’t admit to) the real purpose of the entity; but I digress.
The Strategy
Way back in December of 2020, this post was released which discussed ‘Genesis 41’, specifically.
It was an intuitive assessment; we’re in a phase where corn and grain (i.e., the food supply) are potentially more important than ‘stacking‘ silver or gold.
Over the ensuing year and a half, how correct, that has proven to be.
Then, nine-months ago, was this post, presenting the ‘elephant’; a massive population decline whose repercussions would last the lifetimes of anyone reading.
Now, we have this. A report that confirms the elephant.
It’s all starting to hit the mainstream, although the language is still being couched to not cause undue panic. Good luck with that.
So, what’s next?
The Danger Point: Real Estate
While mainstream press and money managers alike struggle to figure out the obvious, we have price action itself telling us the next likely direction of the market.
During an economic downturn there are many places not to be such as semiconductors, airlines and other low margin businesses, restaurants and so on.
However, the most illiquid of all, is real estate. It does not matter how bad one wants to sell, if there is no buyer, there is no sale.
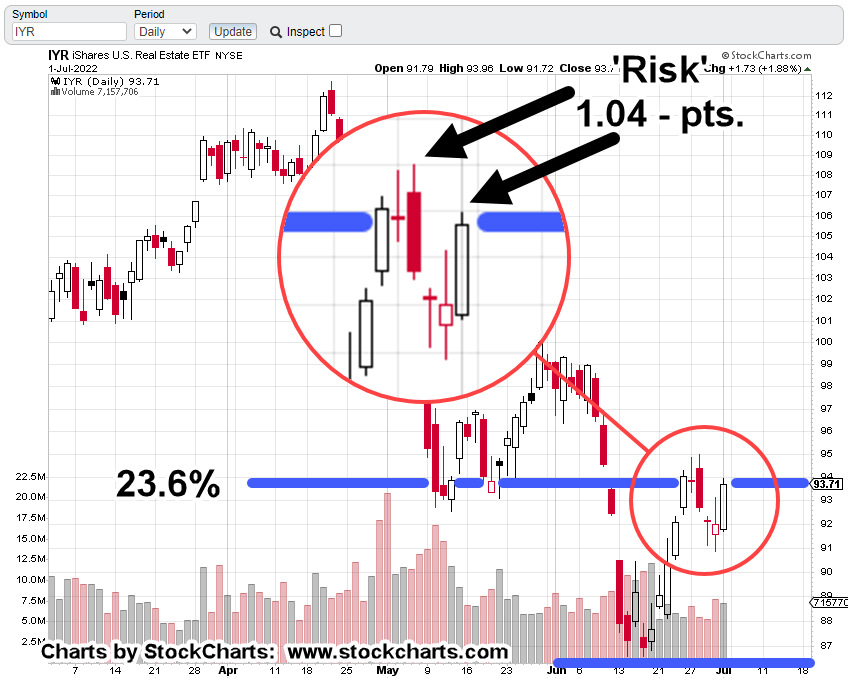
Real Estate IYR, Weekly Chart
Last week, real estate IYR, closed right at the Fibonacci 23.6% retrace as shown.
Getting closer in on the daily, it’s marked up to show the risk from a shorting perspective (not advice, not a recommendation).
Real Estate IYR, Daily Chart
In this case, the risk on a short position is defined as the distance from last Friday’s high (IYR: 93.96) to that same week’s high of IYR: 95.0
Let’s add, Friday’s action saw IYR, retrace a Fibonacci 76.4% (the most available) of the entire move for the week.
The Summary
Amazon (AMZN), ProLogis (PLD), and Real Estate IYR, are joined at the hip.
Now the economy’s imploding, massive warehouse space is not needed.
Ditto that for employees as well.
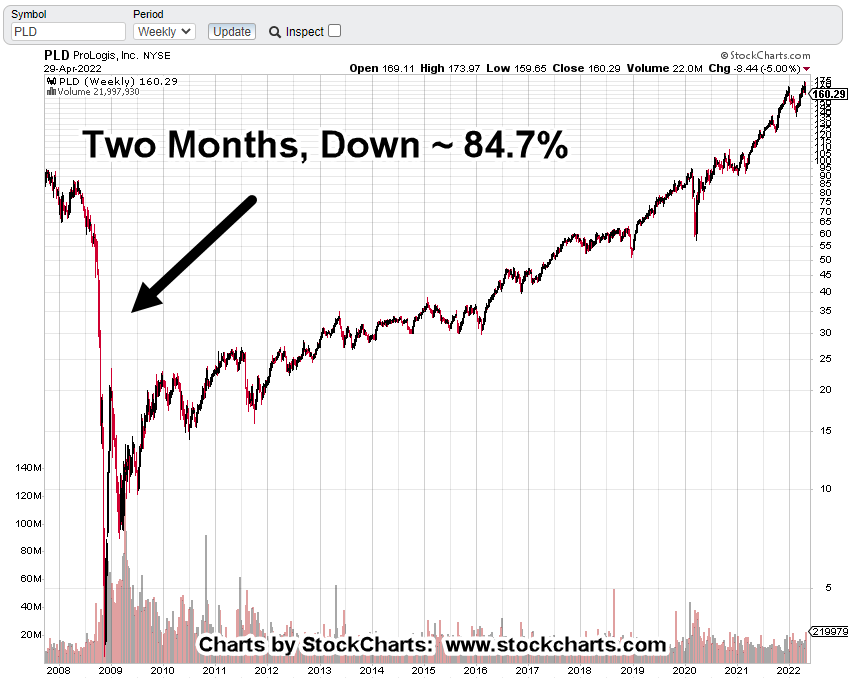
ProLogis is already down – 31.2%, from its all-time highs set just this past April.
We’ve already shown PLD, has a nasty habit of going straight down during a market route.
Last time, PLD, crashed over – 84%, in just two months.
Note: Posts on this site are for education purposes only. They provide one firm’s insight on the markets. Not investment advice. See additional disclaimer here.
Is the objective to create as many news stories (fake or not), along with incessant and contradicting market analysis with the objective: Shut down and distract even the most disciplined trading professional?
The market’s going up, it’s going to crash, it’s in a short squeeze, Goldman ‘says’, then ‘says not’ and on it goes.
If memory serves, the propaganda during the 2007 – 2008 meltdown, wasn’t nearly this bad. Of course, that was before the Smith-Mundt act was repealed … but I, digress.
There are even a few unfortunate dolts that don’t’ even know anything’s happening at all.
Take a look at Dan’s (i-Allegedly) latest video here.
He talks about the number of people contacting him to say ‘it’s not that bad’, or ‘real estate’s going much higher’, or ‘whatever’ as Dan likes to say.
He does present from the (ethical) sales professionals a recognition, real estate’s ‘finished’ for this go-round.
Even while we get reports like this one, where sentiment is so bad, a rally is imminent, the trading objective must be to remain focused on the data … price bars and volume.
That’s what we’re going to do as outlined below.
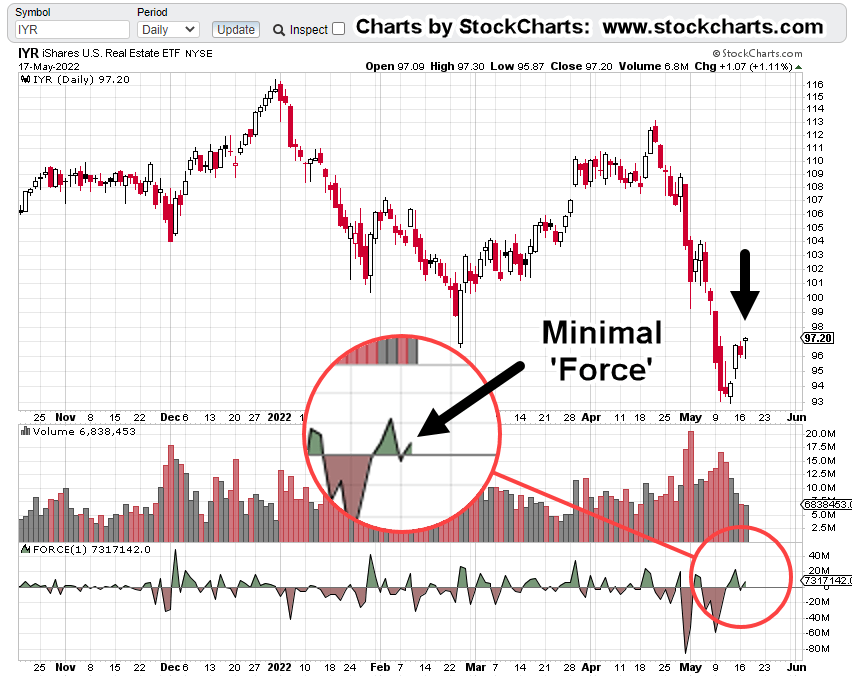
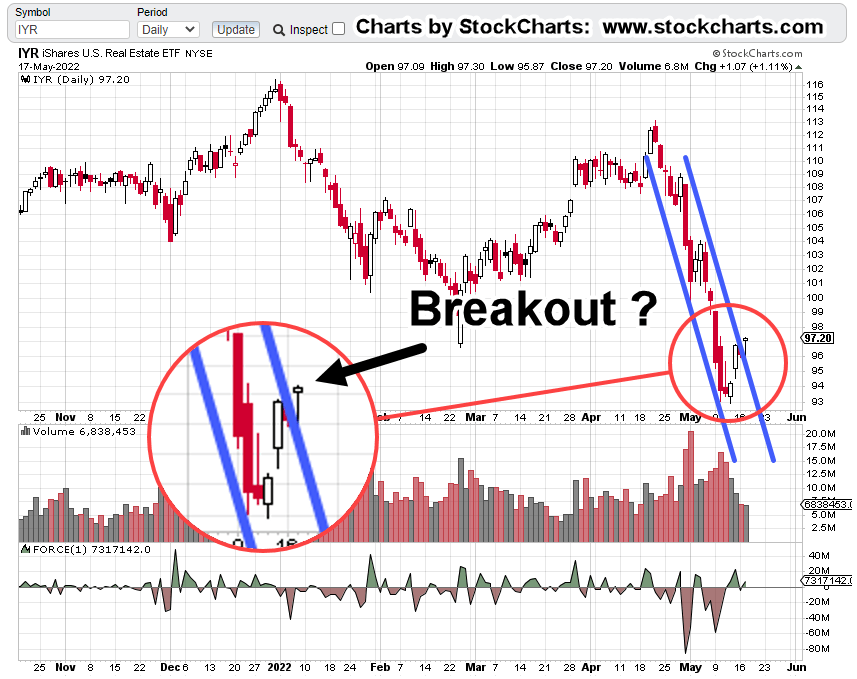
Real Estate IYR, Daily Chart
The un-marked chart.
Now, let’s get to the ‘force’ behind the rebound of the past four trading days.
The tiny blip circled, was all there was for upward energy from yesterday’s move.
Price action inched up just over 1%.
Looking at the situation from a trading channel standpoint, we see yesterday’s action got just outside the well-established trend lines.
So, we have a little ‘blip’ outside the trendline on minimal volume and force.
The news story linked above (repeated here) says a ‘short squeeze’ is imminent … at least for the tech stocks.
What about the rest of the market? Is real estate going to breakout as well?
That actual (IYR) data says, anything can happen; however, with such anemic upside performance, the expectation is for IYR, to resume its downward trend.
Positioning
It’s about forty-minutes before the open and we already have DRV, pre-market activity.
Because the (bid/ask) spreads are so wide in both IYR inverse funds SRS, and DRV, pre-market activity is rare.
Nonetheless, 3X inverse DRV, is trading higher at +0.79 points or +1.71%, indicating that IYR will have a lower open.
That means, the DRV low of yesterday (DRV 45.64) would make a good stop location for any positioning (not advice, not a recommendation).
Summary
Wyckoff analysis is independent of the news or the financials. He discovered as early as 1902, that prices are moving from a ‘force of their own’ having nothing to do with fundamentals.
The action itself will point to the next likely outcome.
Note: Posts on this site are for education purposes only. They provide one firm’s insight on the markets. Not investment advice. See additional disclaimer here.
As with Newmont Mining in the Senor Miners Index GDX, ProLogis is the largest market cap in the Real Estate Index, IYR.
When markets ‘thin-out’, when they reach the end of a long sustained bull move, capital exits the lower caps, the lesser performers, and is thrown into the last man standing; the largest cap(s) in the sector.
In can be argued, that’s where we are now with IYR.
Friday’s Wipe-Out
As expected, because of the near thousand point drop in the Dow, YouTube’s abuzz with everyone attempting to figure out what’s going to happen this coming Monday.
The Maverick does an excellent job (linked here) of posing the question, ‘Where are we’?
He doesn’t even bother with are we in a market collapse; that’s pretty much a no-brainer. It’s the ‘where’ in the collapse, that’s the question.
Real Estate … What’s Next?
From this site’s perspective, we’ll let the market itself tell us what’s likely to happen next.
Since the focus over the past week has been real estate (IYR), let’s look at the largest cap ProLogis PLD, to get clues on the next potential action.
ProLogis PLD, Weekly Chart
First, we’ll look at the big picture.
PLD was vaporized in the last market collapse.
We should also note, it took about 12-years to get back to pre-crash levels; good ‘ol ‘buy and hold’ 🙂
Of course, a multi-year covered call strategy could have been implemented if maintaining long. With that approach, PLD could have potentially become a cash-cow.
Crash Clues
Note on the chart above, PLD didn’t just up and crash; it gave clues well beforehand.
We’ll go into those clues in a later update.
For now, let’s look at next week’s probable action.
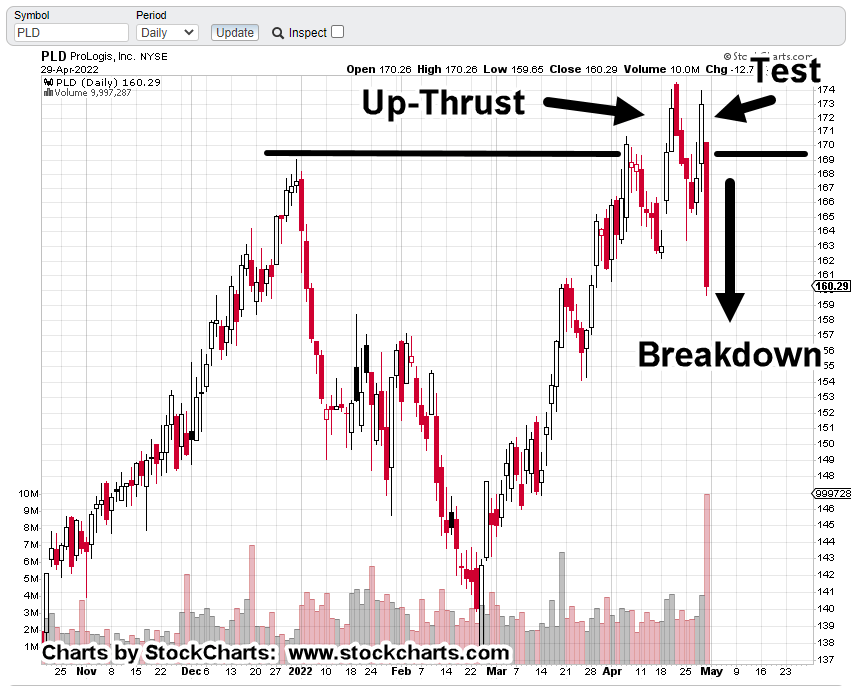
ProLogis PLD, Daily Chart
First, the un-marked chart to show where action finished up on Friday.
Next, we see an upthrust, test and sharp reversal.
Price action finished at support and just below the lows set on Monday, the 18th and Monday the 25th.
Wide, high-volume bars tend to get tested.
So, we’re below the lows with a wide high-volume bar. That puts PLD, in spring position.
Summary
Because PLD and IYR (and the rest of the indices) finished at or near their lows, there may be some downside follow-through this coming Monday.
Price action’s the final arbiter but there’s potential for some kind of upside test in the coming week(s).
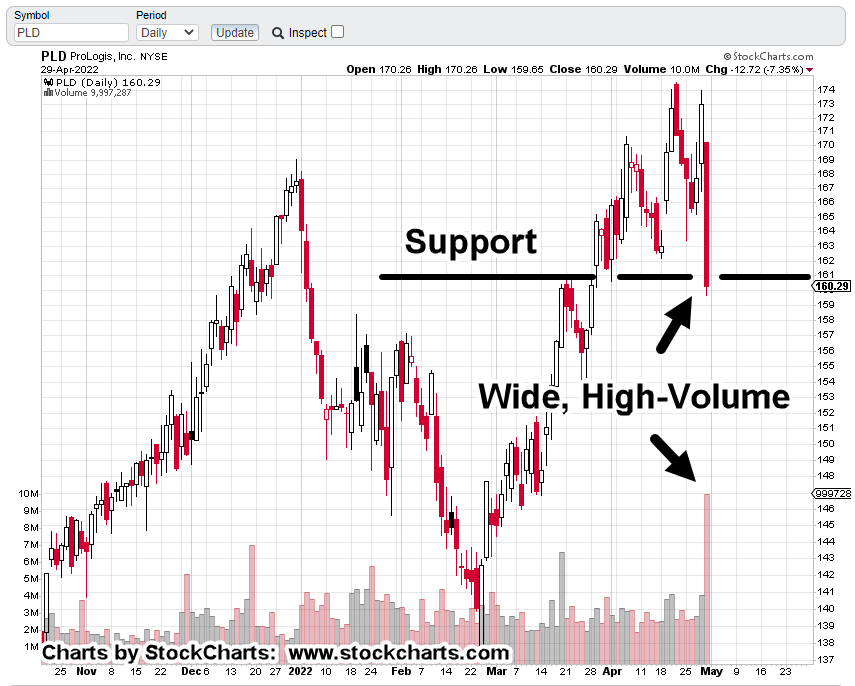
As a courtesy, the DRV chart below shows the entry location for DRV-22-02 (not advice, not a recommendation) and the current stop.
Note how liquidity has picked up over the last two weeks.
Friday’s volume of 309,800 shares, was the largest ever for the inverse fund.
Note: Posts on this site are for education purposes only. They provide one firm’s insight on the markets. Not investment advice. See additional disclaimer here.
Yesterday’s upside failure (from Monday’s reversal) tells us it’s a very dangerous market environment.
Several YouTubers (here and here) and maybe more, the leaders anyway, have noted they’re providing good-faith analysis and potential tips, but that does not change the fact, ‘You’re on your own’.
The ‘rebound’ that Maverick discussed (second link, above) may have been on Monday and that’s all there was.
Absolutely nothing against him in any way.
If that was it for a bounce, we’re indeed in a very dangerous (to the downside) situation.
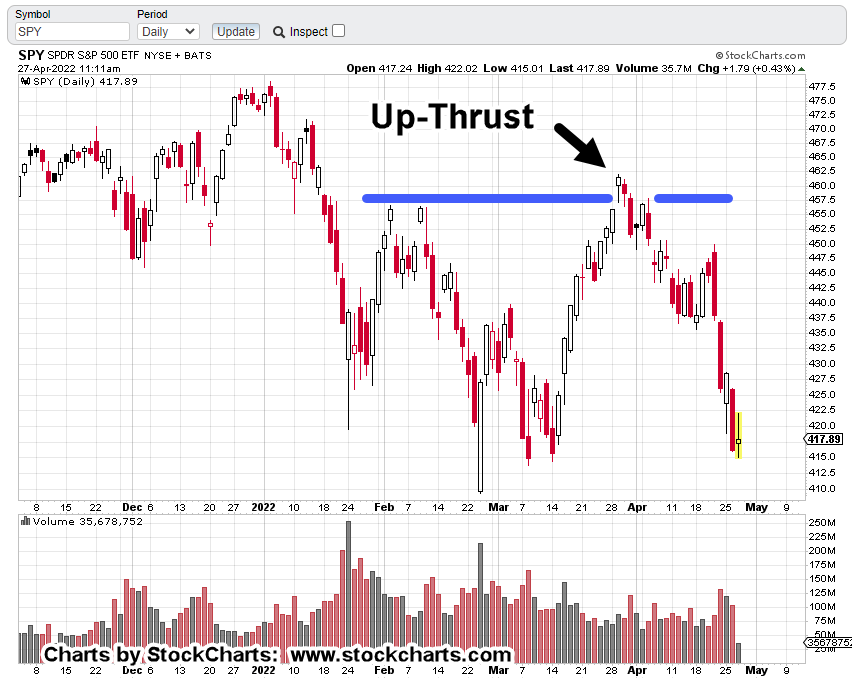
The S&P got itself into a Wyckoff Up-Thrust condition, noted here and shown on the daily chart below.
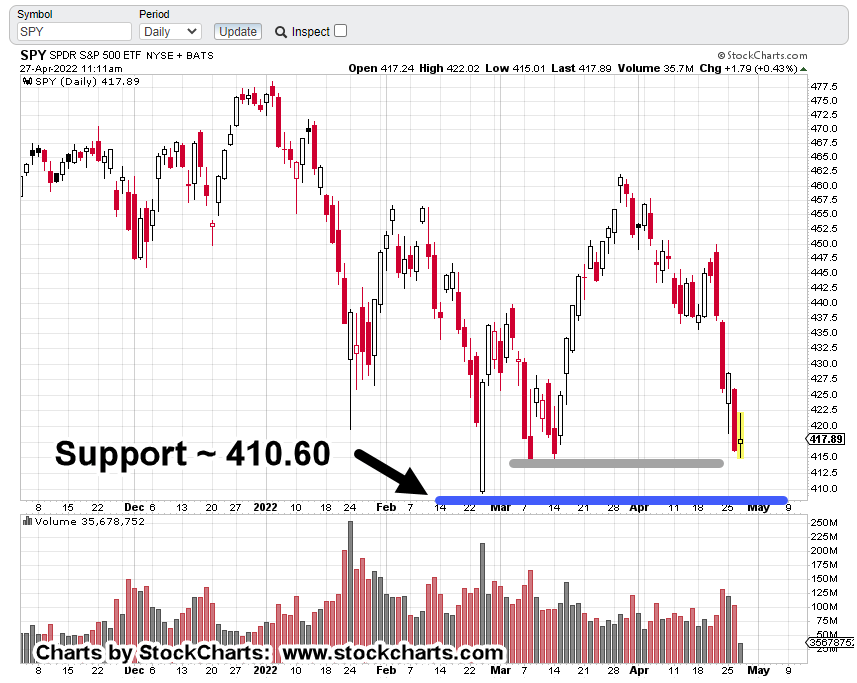
S&P 500 (SPY), Daily
It’s about midway through today’s session.
We can see SPY price action grinding its way down to support near the 410 – 415, level.
Up-Thrust, headed for ‘Spring’ ?
We already know from empirical observation that markets tend to go from spring to up-thrust.
Does it work the other way around … up-thrust to spring ?
From a personal standpoint, I do not have any data to show that behavior exists.
However, with SPY in its current position (near support) we may be about to see if there’s penetration and then attempts to move higher (i.e., in spring position).
The chart below shows current support.
There would need to be decisive penetration to set up the potential for any kind of sustained rebound.
The blue line is a significant support level.
The grey line just above, is also support, where price action is at the moment.
Penetration of either one sets up a spring.
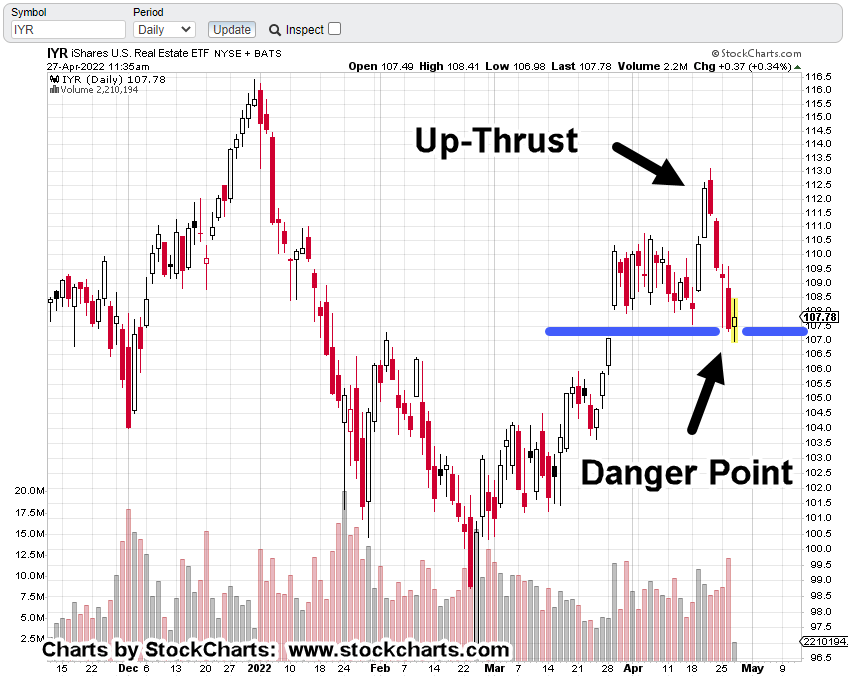
Real Estate, IYR (Daily)
While the S&P fights it out at support, real estate, IYR is doing the same thing.
The previous post was looking for new highs in the sector.
At that time, it looked to be 50/50, odds of doing so.
Now, we’re right at the danger point.
It won’t take much for price action to confirm a spring or a break to lower levels.
It looks like we’ve already had an up-thrust which seems to point probability lower.
With the overall markets, the S&P at support now and deep oversold, points the opposite way, probability to the upside.
Summary
IYR had a shallow, 38% retrace during yesterday’s session before continuing lower and closing near the low of the day.
As that retrace was completing, a short position was opened via leveraged inverse SRS (SRS-22-01) and the stop set at yesterday’s IYR high of 109.58 (not advice, not a recommendation).
As this post is completing, IYR price action’s laboring to move higher (SRS, lower).
We’ll know soon enough if we’re in a breakdown or a spring.
Note: Posts on this site are for education purposes only. They provide one firm’s insight on the markets. Not investment advice. See additional disclaimer here.
The previous bearish analysis was overwhelmed by the larger, upward trend.
Instead of continuing lower, real estate IYR, moved higher. It’s now at another inflection point.
The position in DRV (DRV-22-01) was exited at 32.66, when it was obvious the trade was going to fail.
Taking a hit like that gets one’s attention; there must be something else going on … something on a larger timeframe.
There’s nothing wrong, with being wrong.
However, there is something wrong with being wrong and staying wrong.
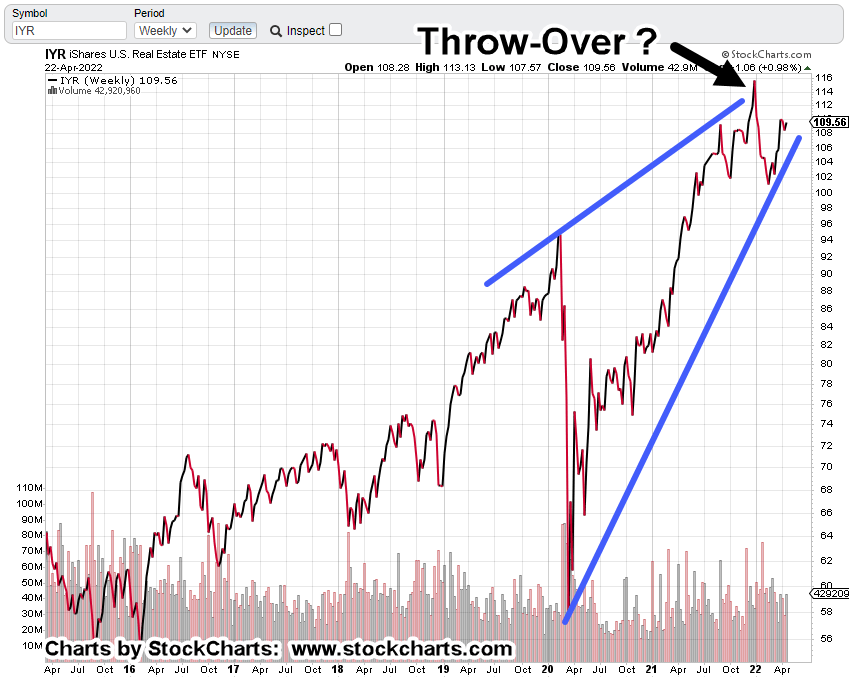
If we pull farther out to the longer, weekly timeframe, it looks like there’s danger ahead; possible new all-time highs and Wyckoff upthrust (potential reversal).
Real Estate IYR, Weekly
As with the Junior Miners, GDXJ, it looks like we have yet another Fibonacci time correlation.
During the financial crisis, IYR, posted its low the week of March 6th, 2009.
Thirteen years later, another major inflection point?
Shown below, is a terminating wedge that may have already completed a throw-over.
One probability suggesting new highs instead of a reversal at this point (which seems like even odds) is the repeating tendency of markets to go from ‘spring to up–thrust‘.
This site has presented over and again, it’s a common market behavior.
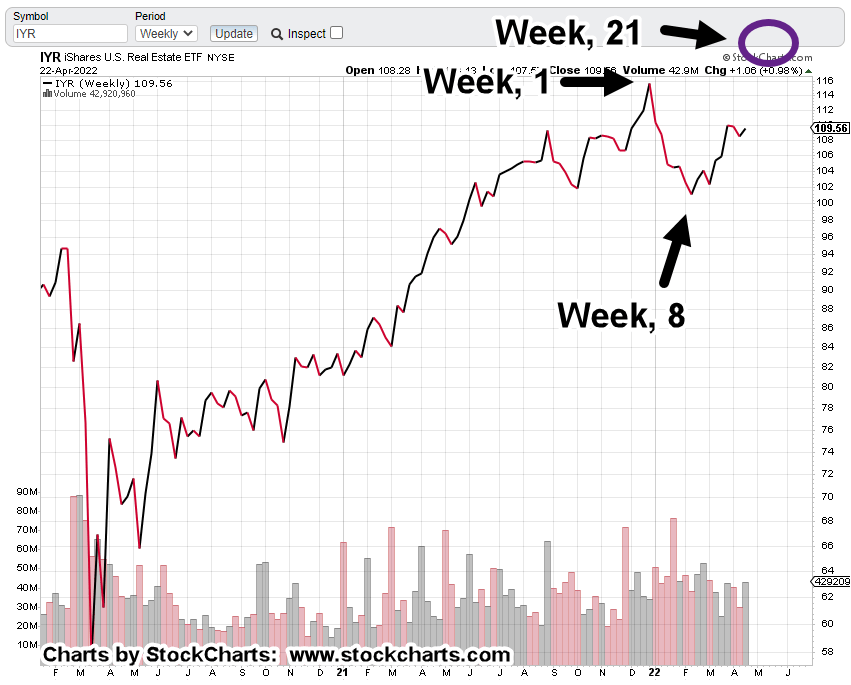
Getting closer-in on the weekly, the spring set-up is identified.
Now, comes the Fibonacci time correlation.
From the all-time highs, the market closed at the lows on Week 8. The print low came one week later.
Using that information and projecting forward, if this correlation is in effect, if it’s valid, we can expect an up-thrust high somewhere during the week of May 20th, to May 27th.
Note: Posts on this site are for education purposes only. They provide one firm’s insight on the markets. Not investment advice. See additional disclaimer here.
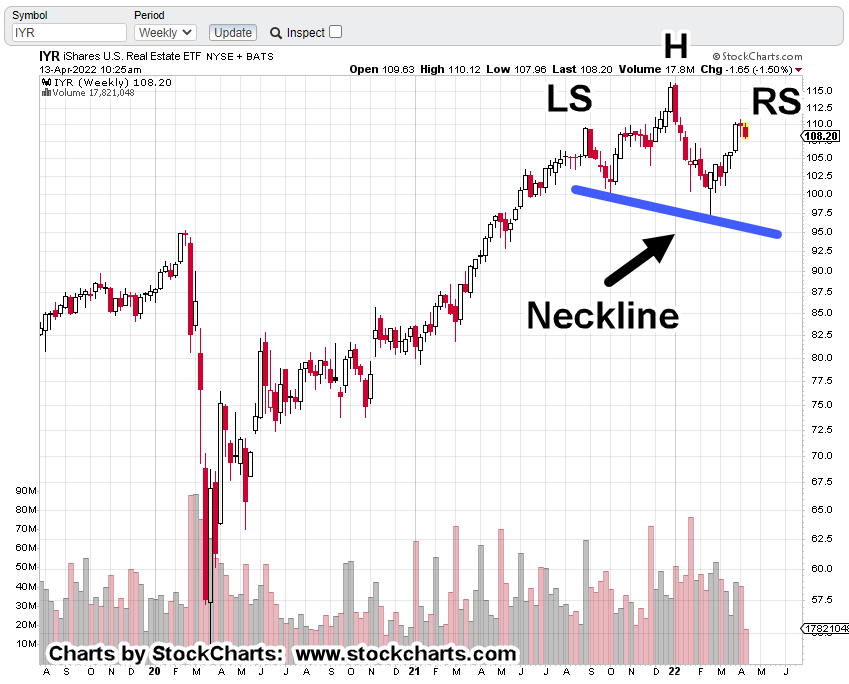
The Head & Shoulders pattern on the weekly chart of IYR, could mean reversal ahead.
Price action’s been attempting to move higher over the past twelve trading days.
‘Attempting’, because it’s not making any significant net progress.
Essentially, we’ve got what’s called ‘evidence of a struggle’ where the bulls may be exhausting themselves.
The last update on bonds (TLT), said they’re at the danger point where an upside reversal was possible.
That update also said:
“At this juncture, there’s either a reversal and much higher levels or down, with rates higher; in turn, leading to the subsequent collapse of real-estate, a-la 2007 – 2008.“
Since then, bonds are lower, rates higher. Housing affordability has collapsed.
Real Estate, IYR, Weekly
At this point it’s a clear H&S, pattern.
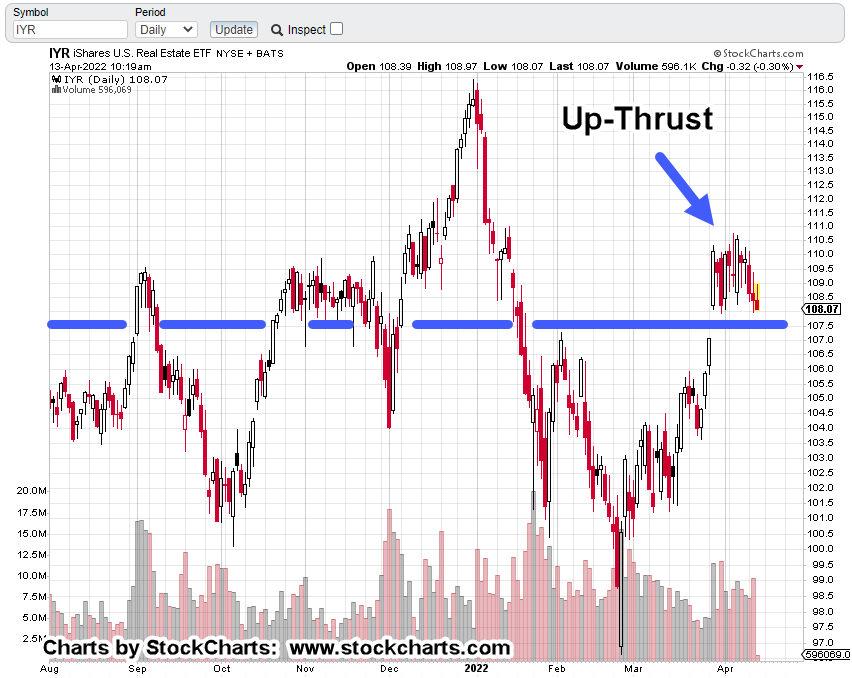
The daily chart shows IYR, oscillating around an axis, support/resistance line; struggling to move higher (in up-thrust condition) with no real progress.
As with bonds in the April 3rd, update, we’re at the danger point with IYR.
A decisive move below the axis (blue) line would indicate the bulls may be exhausted.
Because price action’s been in this range for over two weeks, lends support to the possibility any breakdown (or breakout higher), may be a sustained, directional move.
Note: Posts on this site are for education purposes only. They provide one firm’s insight on the markets. Not investment advice. See additional disclaimer here.
Note: Posts on this site are for education purposes only. They provide one firm’s insight on the markets. Not investment advice. See additional disclaimer here.