The Market Set-Up … This Week

What To Watch … Bonds, Gold, Real Estate, Tesla

Bonds:

Last Friday, the bond reversal posted a shallow retrace.

We’re looking for upside follow-through at the next session.

Gold:

If gold (GLD) closes below 154.67, on Monday, it will be seven consecutive down months.

Momentum has slowed to a potential inflection point.

Real Estate:

If bonds move higher, real estate may follow. We have potential targets and Fibonacci timeframes.

Tesla:

This update, said to watch if/when TLSA, broke below support.

It did just that during the following week but now, it’s hesitating.

As a result, we have a Wyckoff ‘spring’ set-up.

Now, on to the charts.

Long Bond TLT, 30-minute

We’re drilling down to the 30-minute.

The blue line is Fibonacci 23.6%. Price action (at this point) shows the beginning of a move higher from that level.

Moving decisively higher at the next session, puts the terminating wedge into play, shown here.

If we get a wedge breakout, then we have a measured move target in the vicinity of TLT, 115.00.

Gold (GLD) Weekly Chart

A close below 154.67, on Monday, would put GLD, at seven consecutive down months.

GLD, has never closed lower seven consecutive months; not since inception, on 11/18/04.
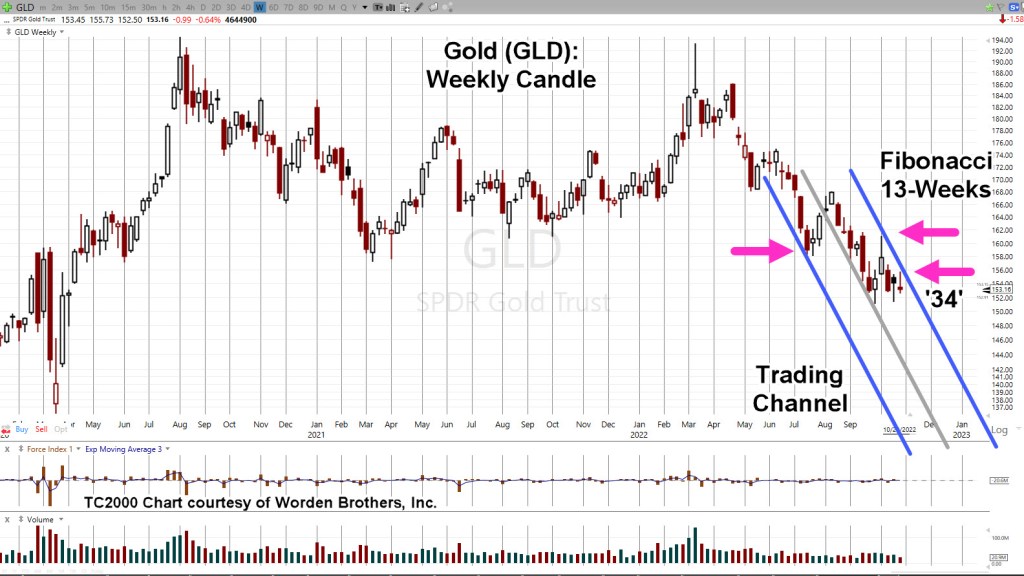
Gold remains in a down-channel that’s a Fibonacci 13-Weeks wide.

Last week’s move helped to re-confirm the channel.

That action is itself, a Fibonacci 34-Weeks from the ‘changing of hands‘ high, during week-ending, 3/11/22.

However, momentum of price action has slowed.

If there’s going to be a break to the upside, this would be the place; otherwise, watch for continued GLD downside.

Real Estate IYR, Weekly

If bonds continue their upside reversal with rates lower, we can expect real estate IYR, to have some type of ‘dead cat’ bounce.

If so, how long and how high.

An infinite number of scenarios are possible. However, the chart of IYR, shows what to expect for two of those possibilities.

Real Estate IYR, Weekly

The uptrend (blue line) has been decisively broken. What has not yet happened, is a ‘test’ of that break.

Shown are potential tests; Week 8 (from 10/14/22, lows), at Fibonacci 38%, and Week 13, at 50%.

Between ‘Week 8’ and ‘Week 13’, is the December Fed meeting … a possible catalyst.

Tesla (TSLA) Weekly

This one seems a bit far-fetched but here it is, anyway.

If bonds rally, the rest of the market may also rally; that could include our chief cook and bottle washer, Tesla.

Price action bounced at support and penetrated it several times before printing outside-up on the weekly (twice).
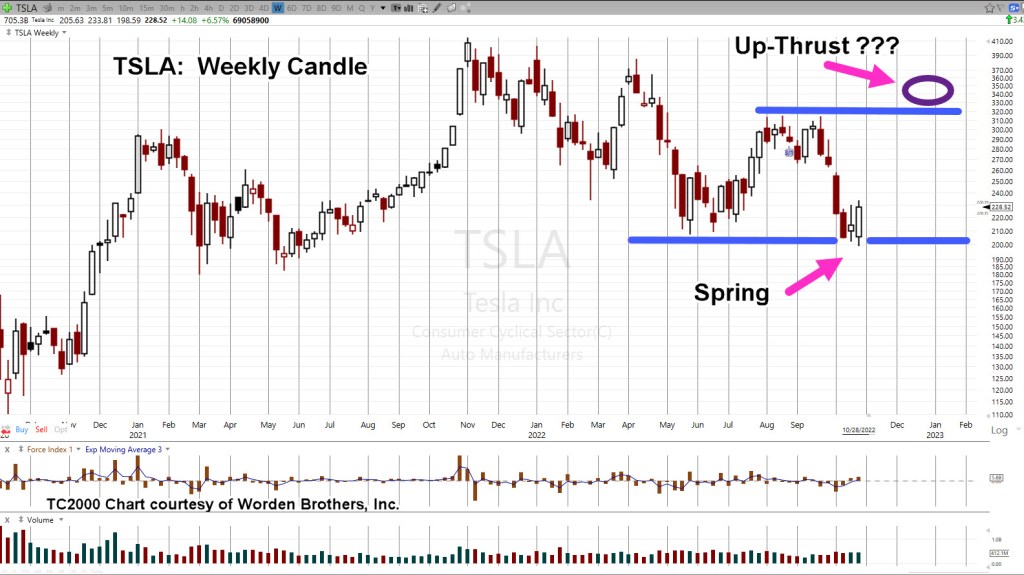
By definition, it’s a Wyckoff spring set-up.

A spring tends to go straight into an up-thrust; a repeating pattern, shown on the chart at around TSLA, 315.

Set-ups can also fail … so, we’ll be watching this one closely.

Stay Tuned

Charts by StockCharts

Note:  Posts on this site are for education purposes only.  They provide one firm’s insight on the markets.  Not investment advice.  See additional disclaimer here.

The Danger Point®, trade mark: No. 6,505,279

The Market Set-Up … This Week

What To Watch

First off, it’s nice to know, traders at J.P. Morgan, don’t have clue as what to do.

They say it themselves; Not One Person

On top of that, I’m supposed to pay money reading about how clueless they are. 🙂

No thanks. Let’s see if we can do better than the average ‘investment firm’.

Before we get started, a reminder; as Michael Cowen says:

‘It’s the bear market that reveals those who really understand’, not the bull market ‘geniuses‘.

With that, let’s get into it; first up, is silver.

Silver: Wyckoff Analysis Results

The downside reversal was identified to the day.

Adding to that post, Europeans could not only be freezing or starving this winter, but also subject to radiation poisoning.

Surely, they’re all thinking that ‘stack’ of silver is going to save them.

Silver (along with gold) remain trending lower.

Silver (SLV) is currently at support levels; therefore, some upward action (staying below SLV: 18.5) is normal behavior.

Bonds: Are They Ready?

Hold your nose … bonds could be setting up for a rally.

As Steven Van Metre reports here, the Fed ‘shenanigan’ meter is pegged.

Bonds, TLT Weekly

Note, the bullish TLT, set-up is not confirmed until MACD ticks higher (not advice, not a recommendation).

Also note the repeating pattern of ‘spring to up-thrust‘.

Last up, biotech

Biotech SPBIO, Hourly (Inverted)

We’re going to use the chart from yesterday’s post to set the stage for getting closer-in.

This past Friday’s early morning ‘spike’ is barely visible; the 30-minute (inverted) chart below, has more detail.

SPBIO, 30-minute (Inverted)

Price action rejected the lower levels (higher on SPBIO) and pulled away throughout the session. That ‘pulling away’ continued on, all the way into the close.

That’s a clue there may be follow-through at the next session.

If the early session opens ‘gap-higher’ (SPBIO, lower), into the resistance area (four magenta arrows, hourly chart), it would be the fourth time pressuring at this area; markets rarely hold a fourth attempt.

Summary

Of course, other markets are being watched like real estate (IYR), Tesla (TSLA), and even Basic Materials (DJUSBM), a potential sleeper for significant downside.

Updates are planned if/when low risk shows up.

Positions: Current Stance (courtesy only, not advice).

The following is the positioning of my firm’s main (largest) account.

LABD-22-08:

LABD Entry @ 25.1278, 24.735, 26.025, 22.99, 22.29***, Stop is @ LABD 21.23***

***, Indicates change

Note: Positions may be increased, decreased, entered, or exited at any time.

Stay Tuned

Charts by StockCharts

Note:  Posts on this site are for education purposes only.  They provide one firm’s insight on the markets.  Not investment advice.  See additional disclaimer here.

The Danger Point®, trade mark: No. 6,505,279

Tesla … Set To Implode

Watch The Tape

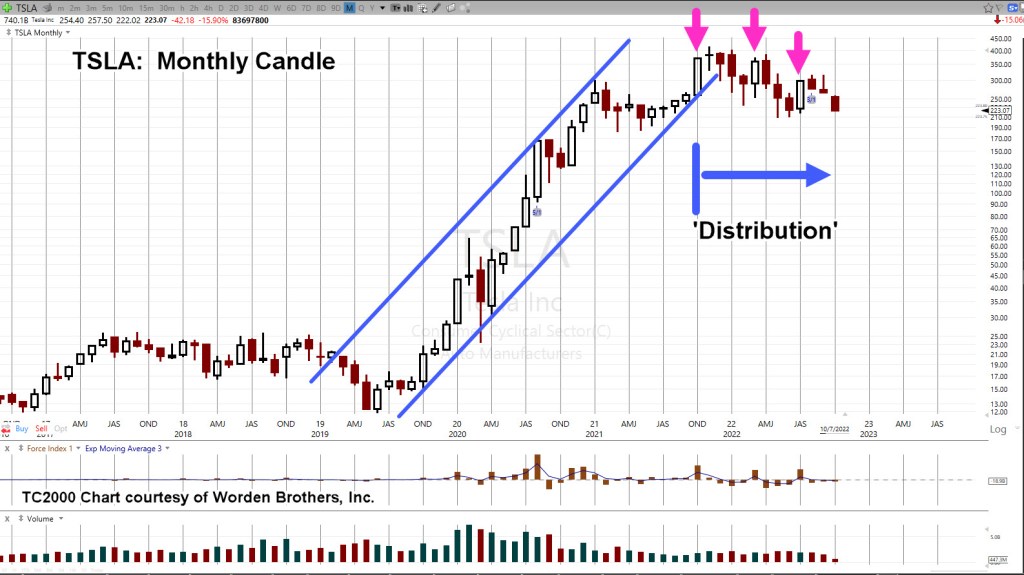
Two-year uptrend, broken.

A year’s-worth of ‘distribution’ from strong hands to weak.

Ten days from now is the next TSLA, earnings release.

With TSLA, price action approaching The Danger Point®, that earnings release is likely to be a catalyst.

The monthly chart has the trendline (and channel) break along with the distribution phase.

Tesla TSLA, Monthly

Note, each thrust attempt higher (magenta arrows) has subsequently failed.

Thrusts following the first one, are at lower levels.

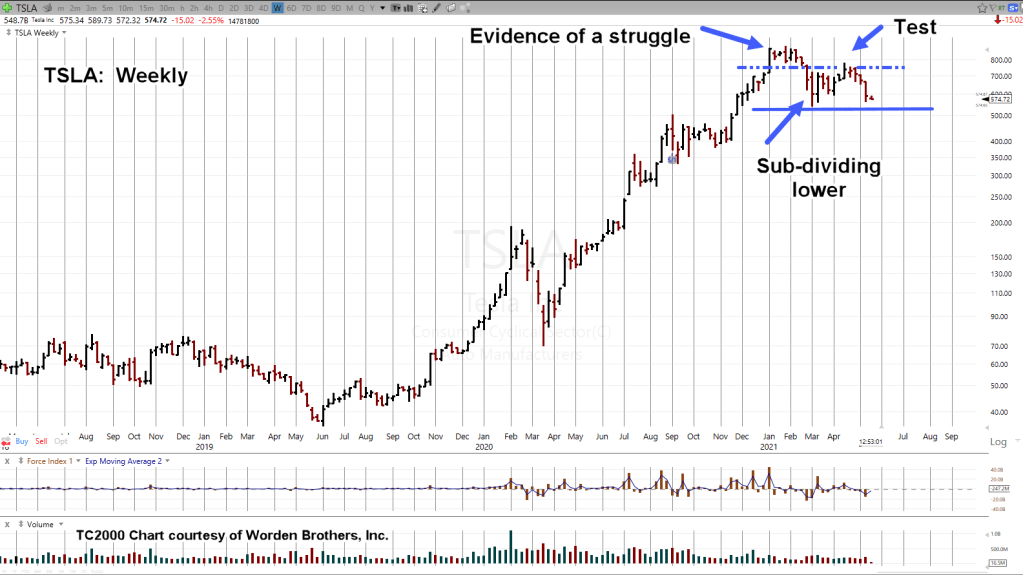
The weekly chart below, shows what we’re looking for; penetration of support to potentially set up a short-trade (not advice, not a recommendation).

Tesla TSLA, Weekly

When or if that penetration takes place, depending on the depth of the thrust, we’ll have a Wyckoff spring set up … that ultimately is expected to fail.

Ways To Trade

As if on cue and possibly in anticipation of TSLA fireworks, there’s a long and short ETF, for just this ticker.

Released just months ago; TSLS, a 1X inverse (bear) TSLA. The bull side has 1.5X leverage with TSLL.

TSLS, has a 100% maintenance requirement and TSLL, has the same.

Or, one can short directly.

There’s no dividend and the broker used by my firm shows TSLA, has no borrowing restrictions other than a 40% maintenance requirement (not advice, not a recommendation).

Then, there are options … we’ll discuss those if some kind of high probability opportunity presents itself.

The Masses

Let’s not forget the herd. What are they doing/saying?

With that in mind, a random check of our favorite holding pen, SeekingAlpha, has oodles of TLSA analysis.

The most recent is actually quite good from a thoroughness perspective. It admits/discusses the downward pressures and identifies the support/resistance levels discussed above.

The problem is the mass psychosis.

It’s the ‘EVs are the way’ mantra as if Bhagwan Shree Rajneesh himself, was communicating directly.

With the winter carnage in Europe just weeks away, we’re about to find out how green ‘electrics’ hold up when there is, well, no electricity.

Back to Biotech

While all of the above is transpiring, the real Black Swan continues to emerge; the latest here, here and here.

This event is happening now; the effects of which will last our lifetimes.

It’s massive and world-wide; likely to override any mainstream (traditional 60/40, type) analysis.

After letting go of the biotech short for the seventh time, two days later, this past Friday, it decides to reverse.

We’ll cover that in the next update.

Stay Tuned

Charts by StockCharts

Note:  Posts on this site are for education purposes only.  They provide one firm’s insight on the markets.  Not investment advice.  See additional disclaimer here.

The Danger Point®, trade mark: No. 6,505,279

Bears Throw In The Towel

A Tale Of Two Bears

Back in the day during the dot-com boom, fund managers were throwing in the towel (‘value’ fund managers, if memory serves) because the markets as they said, “did not make sense anymore”.

Valuations were insane and managers with decades of experience decided the time had come to exit for good.

Of course, it was a contrarian indicator. Those lofty valuations and prices were at or near their peak.

It was not long after when the market cracked. There was a rebound of sorts but the stage was set for a long bear market.

History Repeating?

This is a brief update to document two bear managers that are quitting in separate ways.

One is shutting down his fund entirely. More information linked here.

The other has exited short positions which included getting out of Tesla (TSLA) just before it rolled over.

These types of high-profile events usually happen at or near a significant top.

If the overall markets continue to grind higher, there may be similar retirements and/or fund closures.

Gold (GLD) Update

Before a market can reverse to the downside, it has to stop going up.

Sounds obvious but with the bullish hysteria on gold, coupled with non-stop inflation talk, it may take a while for the bulls to exhaust themselves.

We’re still at the danger point for GLD as well as the miners GDX, GDXJ.

Items of note for the session:

GDX had a double top (same high as Friday) and the inverse fund DUST posted + 0.01, above its own Friday low.

It could mean we’re at the extreme(s) with no more directional thrust or just a pause before continuing with the existing trend.

Stay Tuned

Note:  Posts on this site are for education purposes only.  They provide one firm’s insight on the markets.  Not investment advice.  See additional disclaimer here.

The Danger Point®, trade mark: No. 6,505,279

Tesla Turns Lower

5:29 p.m., EST. Updates in red

1:32 p.m., EST

It looks bad on the Weekly;

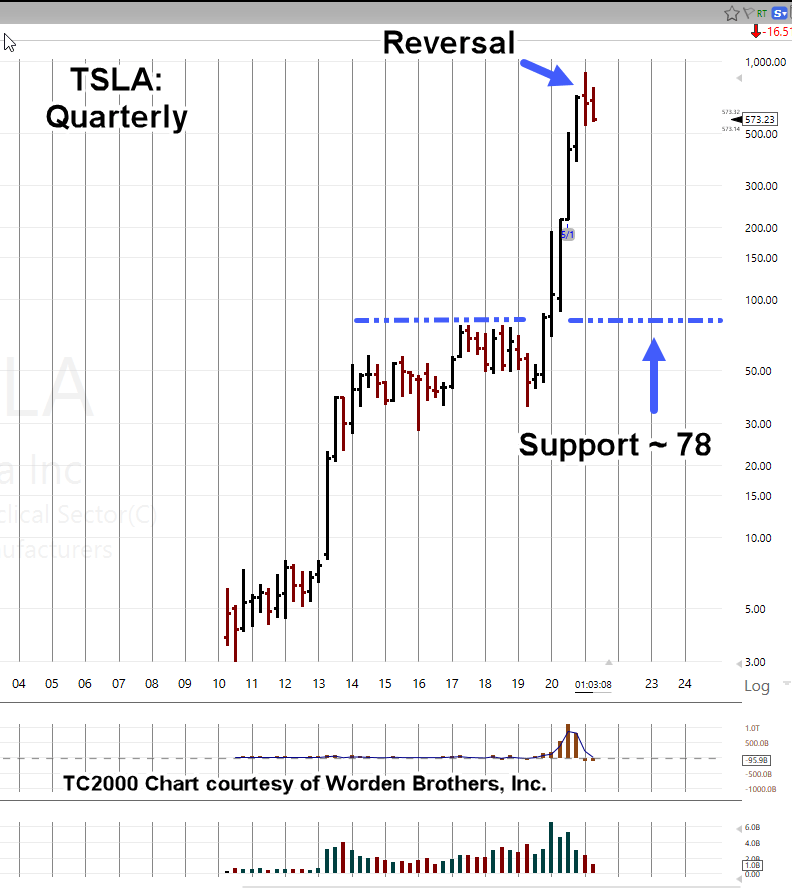
Even worse, on the Quarterly

Early this year, TSLA spent about seven weeks attempting to move significantly higher.

During the week of February 26th, it gave up and broke down.

Since then, its come up to test the underside of support … now resistance (around 740) before again, turning lower.

Down -37%, since the end of January sounds bad enough. However, it’s the quarterly chart that contains the real horror story.

TSLA has posted a huge 490-point trading range (when taken from support at 78, to current price).

A down move to support from today’s levels, is a decline of -86%.

Markets like to come back and test; better to count on it, than ignore it.

Not saying that will happen to TSLA.

Nearly simultaneous with this first post, we have this article on ZeroHedge about a huge short position.

However, if any real problem does come up like another high profile ‘incident’ (as if we don’t have enough of them already), meaningful support is a long way down.

Just a few hours later, we have this, also from ZeroHedge about a Tesla running over two police officers … in China no less.

Note:  Posts on this site are for education purposes only.  They provide one firm’s insight on the markets.  Not investment advice.  See additional disclaimer here.

Good Short, Bad Short

Seems like Tesla (TSLA) is always in the news.

Now, we have ‘the big short’, as reported by The Money GPS, doubling down on a possible even bigger short.

Is TSLA a good short opportunity or just a high visibility gamble; or maybe at this point in our history, just another psy-op?

How many minions are flagellating themselves over TSLA, anyway?

From a trading standpoint, TLSA could reverse from here. It could also gap higher into a wedge throw-over. With the weekly MACD showing no signs of erosion, probabilities are about equal.

Bad Short

Now, let’s look at another chart:

Real estate, IYR is showing classic signs it’s about ready to roll over.

Its been struggling for months at the 85-86 area and just yesterday, posted a new weekly low.

Yesterday as well, bonds reversed to the upside. Pre-market activity points to a higher open … solidifying the reversal.

On top of that, the dollar shows a higher open having (downward) tested its up-trend at the last session.

The list can go on but we see the difference.

One is a gamble (or even a psy-op manipulation of followers) and the other is a trade with high probabilities.

Good Short

The table below has current positioning (not advice, not a recommendation):

Special Update: 9:52 a.m. EST. Price action in DRV pushed to stop level and has recovered quickly.

Position is being maintained (for now) with analysis to follow.

Update: 2:21 p.m. EST. IYR looks to be headed to a 38% retrace at approx 84.25, level. All DRV positions exited. Will look to re-enter shorts at higher level, price action depending.

Charts by StockCharts

Note:  Posts on this site are for education purposes only.  They provide one firm’s insight on the markets.  Not investment advice.  See additional disclaimer here.