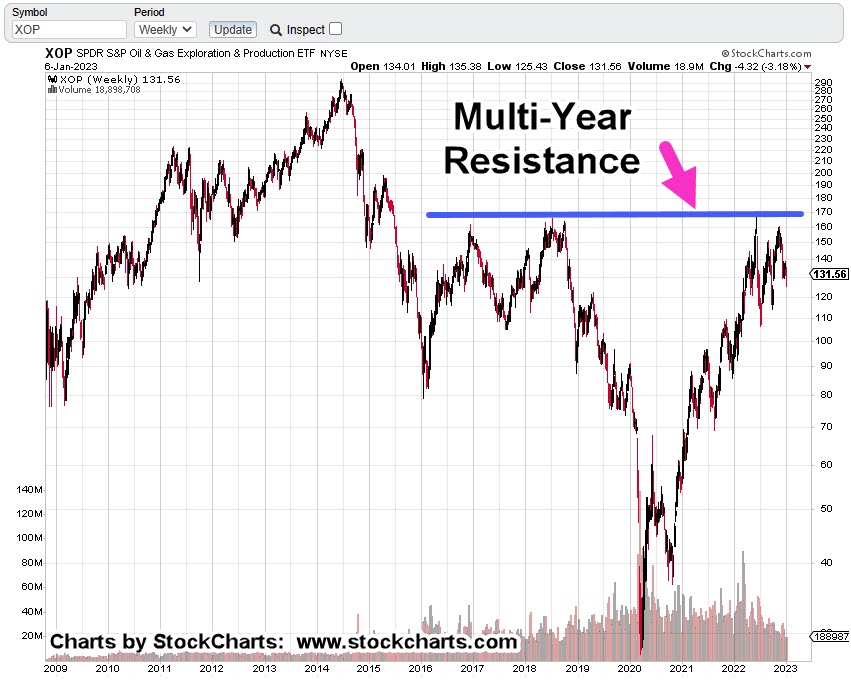
Then, There’s Biotech

Back in January, this post was contrary to the accepted (and still accepted) theory, there’ll be a Fed ‘pivot’ when the economy turns south.
‘Like ‘bread and circuses’, the ‘pivot’ discussion is a distraction … keeping the proletariat placated.’
We went south a long time ago and not only is there no pivot, rates are most likely going higher still (not advice, not a recommendation).
A Process Of Iteration
Those accessing this site for any length of time, have seen my trading actions going through a process of iteration in real-time.
Those actions have effectively searched (and profited) from moves, but more importantly, are looking for the market that stands to decline the farthest and fastest.
At this juncture, that market could be biotech and specifically, the SPBIO, index (not advice, not a recommendation).
Biotech SPBIO, Monthly
Depending on if, when, and where the neckline is broken, we have an approximate location for a measured move.

Head & Shoulders patterns, while being high probability, can be subject to failure.
One of the most famous of these in recent memory, was the S&P Head and Shoulders of late 2002.
It was an easily recognizable pattern that failed … only later to find out, the market had been manipulated higher by an entity (buying futures contracts) that had ‘unlimited capital’.
Positioning
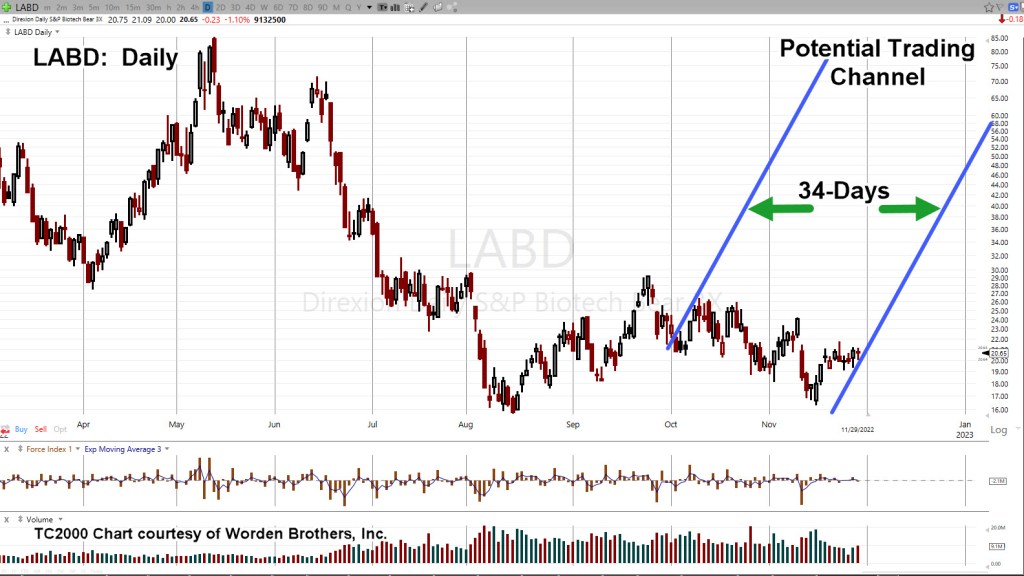
As this post detailed, the main position going short the index (via LABD) has already been opened (not advice, not a recommendation).
There have been other additions, but they are nowhere near the size of the original entry.
Hard Stop has been moved up from LABD 17.59 to LABD 18.22 (not advice, not a recommendation).
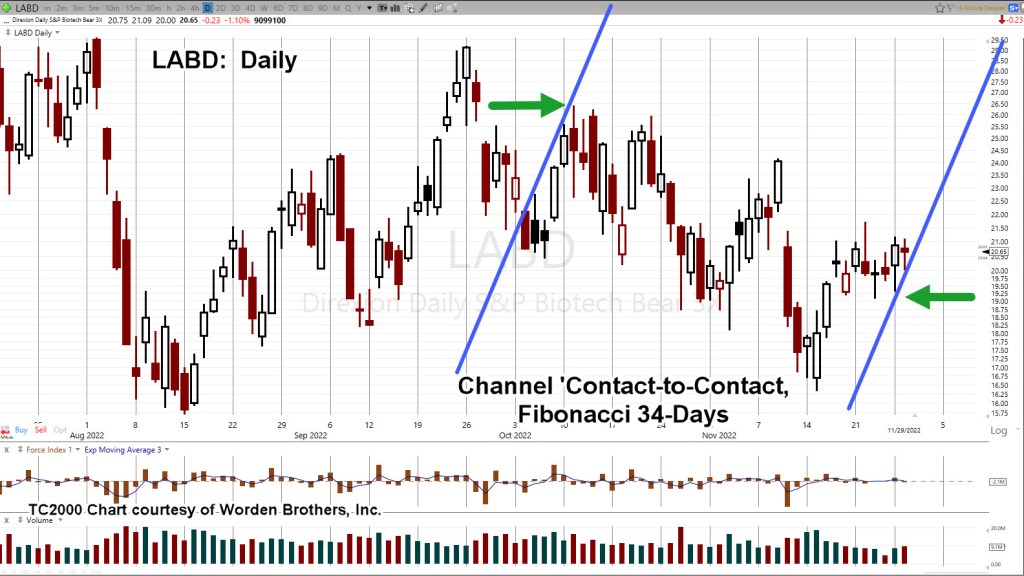
Highly Leveraged, LABD
There’s no guarantee, 3X Leveraged Inverse fund LABD, will be maintained throughout a potential collapse. Events can change, even while this post is being created.
That being said, what’s happening here is akin to ‘settling in’ on a trade, monitoring price action, trend lines, and support/resistance, to mentally prepare for what could be a sustained move.
So far, that approach is working.
Stay Tuned
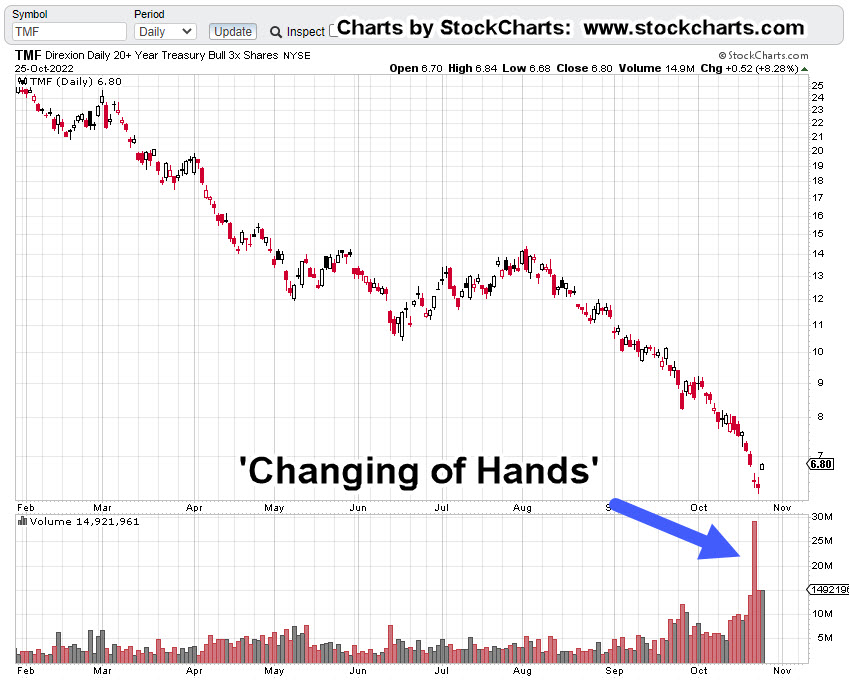
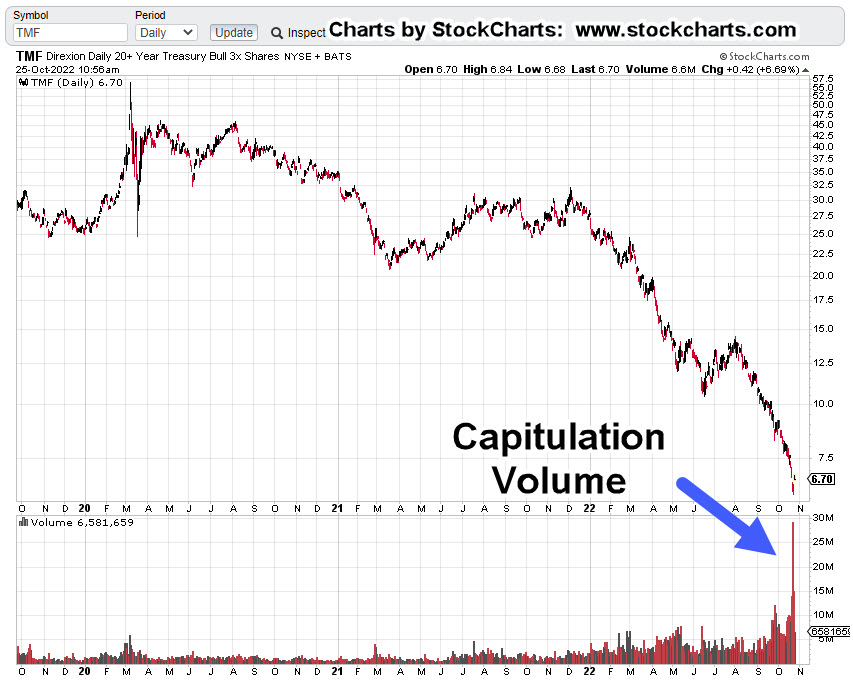
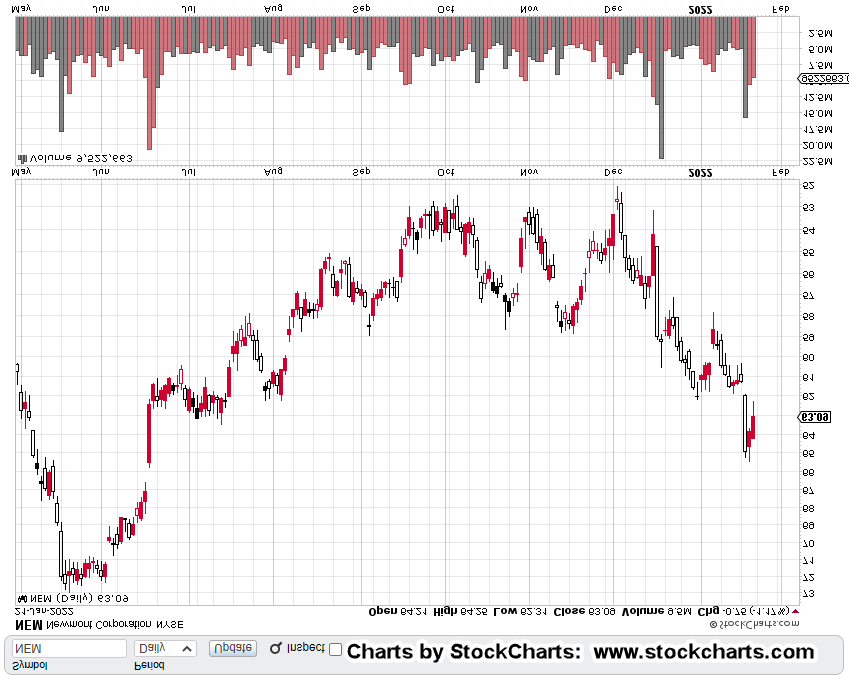
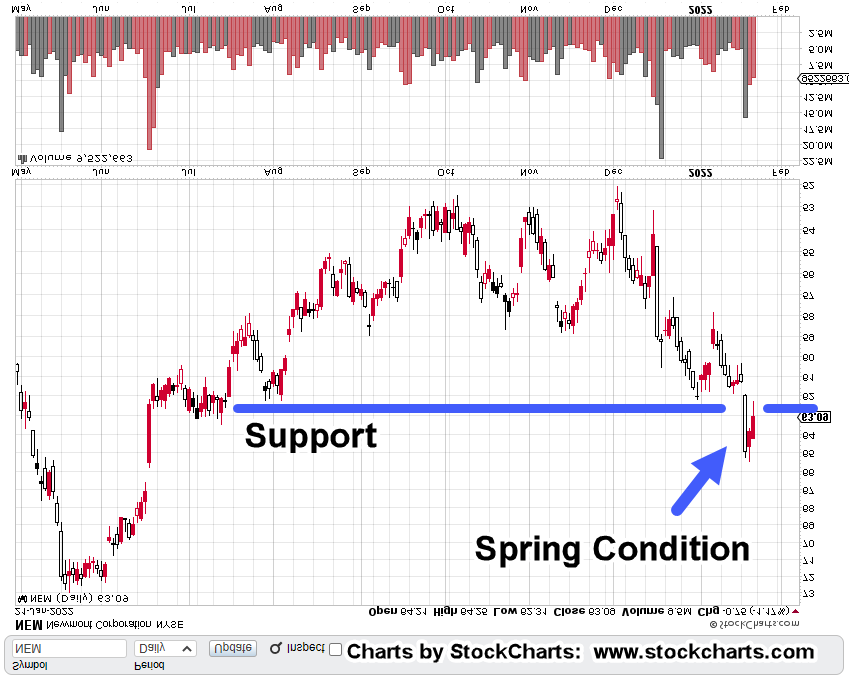
Charts by StockCharts
Note: Posts on this site are for education purposes only. They provide one firm’s insight on the markets. Not investment advice. See additional disclaimer here.
The Danger Point®, trade mark: No. 6,505,279