Note: Posts on this site are for education purposes only. They provide one firm’s insight on the markets. Not investment advice. See additional disclaimer here.
As if on cue to support the prior post highlighting silver’s ‘mysterious’ decline, we have this just out, on Newmont Mining.
Newmont’s in free-fall.
For long-time visitors to this site, today’s events should be no surprise.
These reports, here and here, posted back in April, identified reversals in gold miners GDXJ, and implicitly GDX, to the day.
We’ll include a quote from the first linked report below:
“It’s a fairly safe assessment, nobody expects a downside reversal … nobody”.
And yet, here we are.
As the administration and the financial press, becomes ever more confused and bipolar; even now, re-defining the long-held definition of ‘recession’, we have Wyckoff analysis time and again, cutting through the media trash to determine the highest probability for the market.
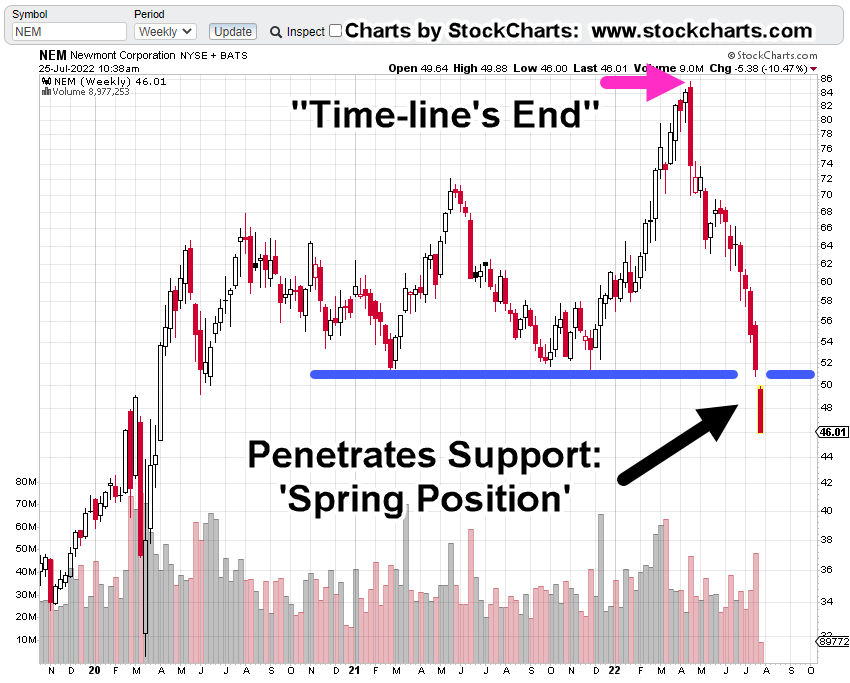
Newmont Mining (NEM) Weekly
The chart below has current conditions for Newmont.
Also shown is the location of the first post linked above, released before Newmont began its decline.
At this juncture, NEM has penetrated long established support; technically it’s in ‘spring position’.
The expectation is for some kind of (weak) rally attempt. We’ll see if it’s able to get back above support.
Note: Posts on this site are for education purposes only. They provide one firm’s insight on the markets. Not investment advice. See additional disclaimer here.
Note: Posts on this site are for education purposes only. They provide one firm’s insight on the markets. Not investment advice. See additional disclaimer here.
The last report on China, FXI, stated we’re in a Wyckoff set-up that was about to be tested.
More specifically, it said the leveraged inverse fund YANG, was in ‘spring’ position; ‘spring’ is opposite of up-thrust, because we’re looking at shorting the FXI, via inverse fund YANG.
Back then, two charts were provided with the most probable outcome of the set-up. One showed a ‘pass’ of the test and one showed ‘fail’.
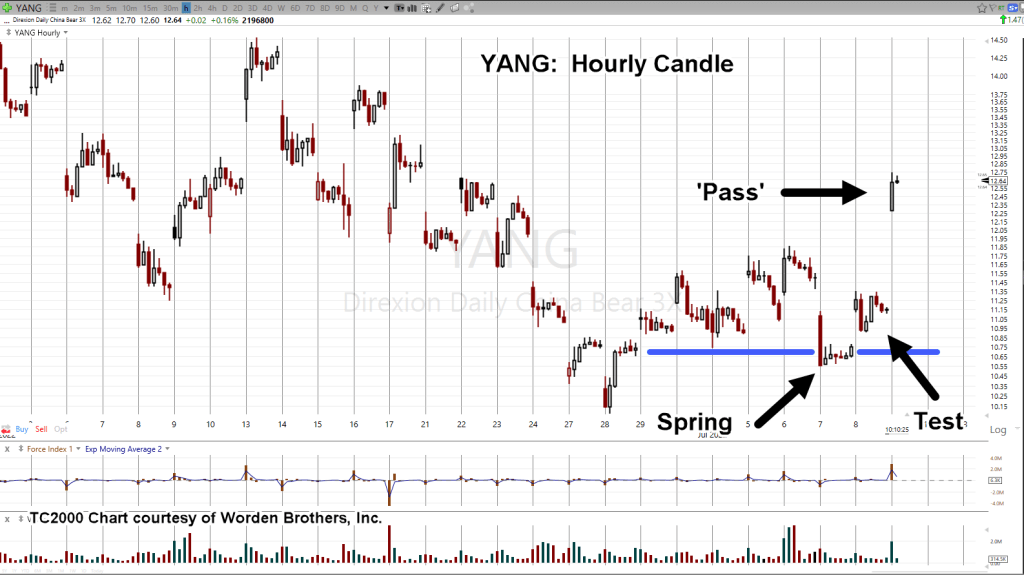
Well, it’s obvious now; pass it is.
The original hourly chart is repeated below with the current chart (ninety minutes into the session) following.
Leveraged FXI Inverse YANG, Hourly
Prior to the ‘test’.
And now … ninety minutes into the session:
Back in the day, over a century ago, Wyckoff wrote that ‘somebody always knows something’ and that ‘something’ shows up on the tape.
What we in the Proletariat didn’t know last week, was this week, would bring us this report from ZeroHedge.
The important part is that Wyckoff analysis allowed one to see what was happening (on the tape) and position ahead of time (not advice, not a recommendation).
“Risk on a position short FXI via YANG (not advice, not a recommendation) can be reduced by allowing YANG price action to retrace as much of the opening gap as possible.”
That’s exactly what was done with an entry made near the lows of the day.
For the haters (if any), here’s a reproduction of the entry exactly as it appears in the trade account:
Check for yourself if you like, that YANG was at 10.95, right around 10:51, a.m. EST.
The low of the day occurred several minutes later at YANG 10.90. The stop is set just below that low @ 10.89 (not advice, not a recommendation).
The trade’s identified as TDA-YANG-22-01. The ‘TDA’ references that a separate account (TDA Ameritrade) is being used for this position.
Hopefully, that’s enough ‘transparency’ and we can move on.
The Wyckoff Edge
Properly done (without being skewed by personal bias), there’s nothing else needed other than Wyckoff analysis.
It’s important of course, to understand the context of our (global) environment such as ‘everything’s going according to plan’ but allowing the mainstream to influence the analysis, other than providing a contrarian view, is an absolute waste of time.
Note: Posts on this site are for education purposes only. They provide one firm’s insight on the markets. Not investment advice. See additional disclaimer here.
The last update’s high probability set-up was negated at the next session … only to morph into another high probability.
We’ll go straight to the FXI, leveraged inverse fund YANG.
FXI, Leveraged Inverse YANG, Hourly
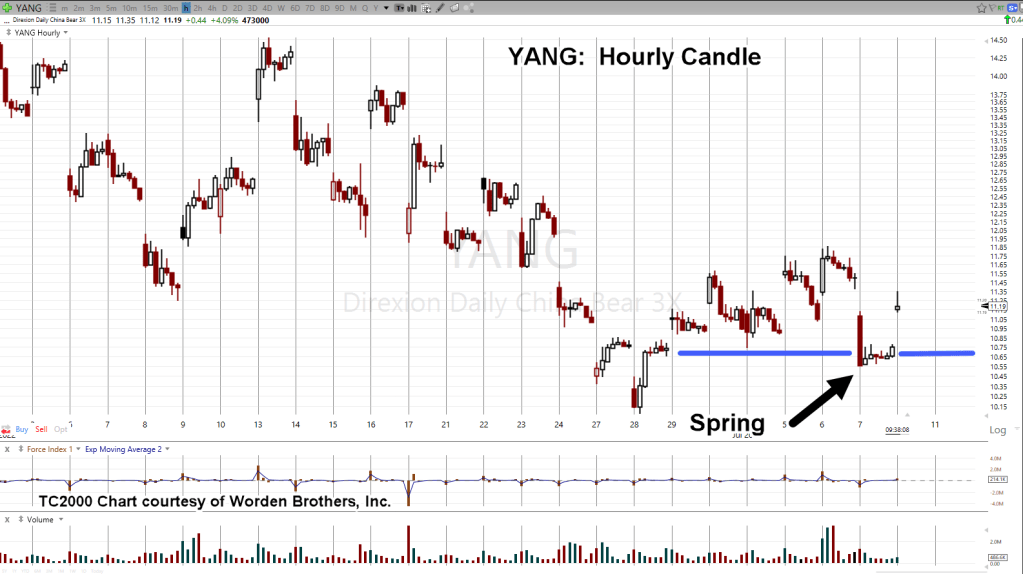
It’s about twenty minutes after the open and YANG is trading at around, 11.15 – 11.16.
The chart below shows a Wyckoff spring set-up in progress.
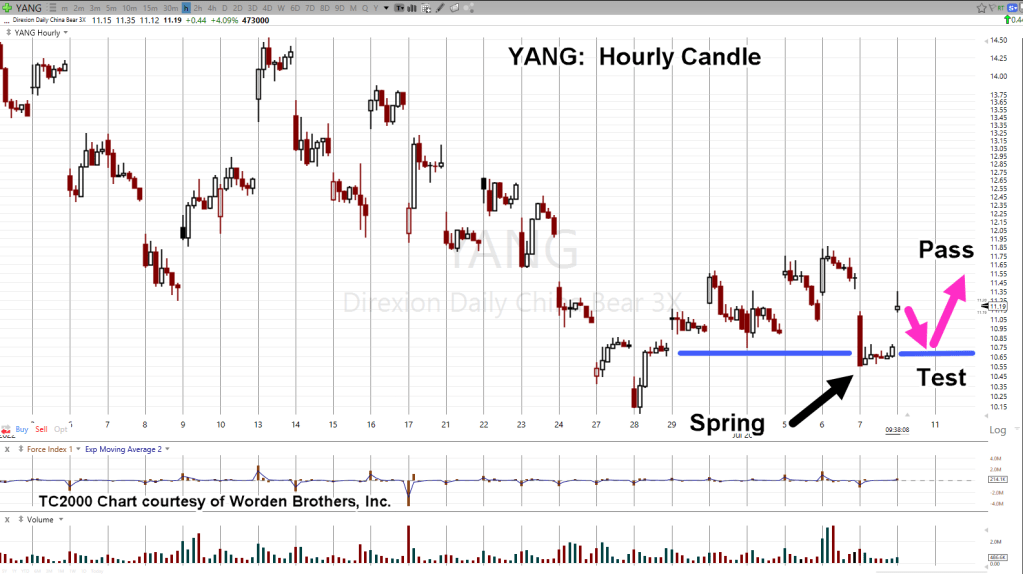
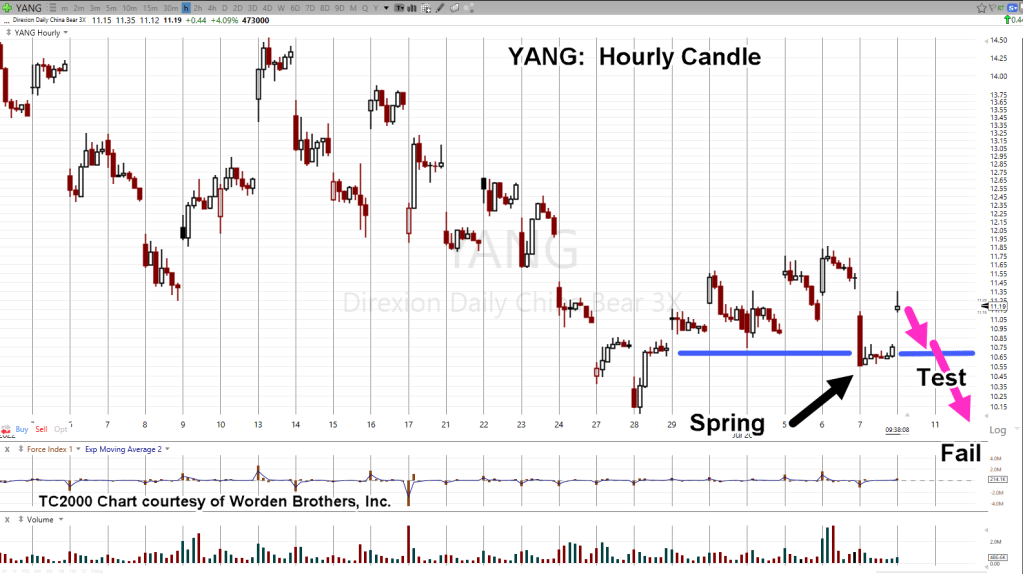
What’s missing at this point, what’s to be expected during this session or next, is the test.
That same hourly chart is marked up below to show how that test may look with a pass or fail.
Risk on a position short FXI via YANG (not advice, not a recommendation) can be reduced by allowing YANG price action to retrace as much of the opening gap as possible.
It’s Friday and we’re heading into the weekend.
Does anyone really want to be positioned long? 🙂
It’s not as if anything bad is happening.
Nothing like British Members of Parliament (and the Prime Minister) turning in their resignations … all staged but that’s a whole other story.
Note: Posts on this site are for education purposes only. They provide one firm’s insight on the markets. Not investment advice. See additional disclaimer here.
And so it was. Short position in real estate, closed out.
Even with all the analysis, real estate (IYR) has pushed higher. The short position via SRS (SRS-22-01) was exited just below the stop @ SRS 16.33.
Exiting a trade, frees the mind to look elsewhere for opportunity.
Typically, one would have to wait days or even a week or so for something else to be available.
However, despite appearances, the market is moving very fast at this juncture.
Looking around in those markets, we have a textbook entry signal (to go short) the FXI (not advice, not a recommendation).
David Weis & The Video
Many times, on this site (actually, for years), the Weis video has been recommended.
Next to Wyckoff’s treatise from 1910, Studies In Tape Reading, that video is probably the most important one could ever watch concerning the markets.
In it, he describes a ‘trick’ as he calls it, to get aboard a market that’s already underway. At the time, his discussion was using DE (if memory serves), as the trading vehicle.
That ‘trick’ is highlighted below on FXI
China Index FXI, Daily
This is how the chart looks early in today’s session.
Next, we’re going to invert the chart to mimic what’s seen on leveraged inverse fund YANG.
And now, the signal zoomed-in
The above price action is nearly exactly as presented in the Weis video; even though it was recorded fifteen-years ago.
The above signal is not a guarantee.
It is, however, a high probability low risk set-up (not advice, not a recommendation).
The entry signal was triggered at approximately YANG 11.75, with a stop at YANG 11.02, for a ‘risk’ of 0.73/share (not advice, not a recommendation).
Summary
As this post is being created, YANG is retracing and is currently trading near 11.67, narrowing the distance from any potential entry to the stop.
On a very long term (Monthly) basis, there are interesting things happening in FXI. We’ll be covering that soon in another update.
Note: Posts on this site are for education purposes only. They provide one firm’s insight on the markets. Not investment advice. See additional disclaimer here.
The Danger Point®, trade mark: No. 6,505,279
Active: YANG (YANG-22-02), entry @ 11.83, with stop @ 11.30
‘Sometimes it seems as if the market hangs in the balance by the weight of a feather.’: Wyckoff, circa 1910.
Is this the big reversal to the downside?
Before we get to that answer, let’s review two recent market pivots (including today).
A Day To Remember
Back on May 4th, the post with the same title, linked here, was to be used for reference on a go-forward basis.
The post has a linked article, whose comment section could be surmised as the bourgeois rebuke of a 78-year-old fund manager.
That manager was quoted as saying, “It’s the biggest bear market of my life”; to which the younger crowd responded with derision, effectively saying the old man’s a dolt, an idiot, a doofus and needs to retire.
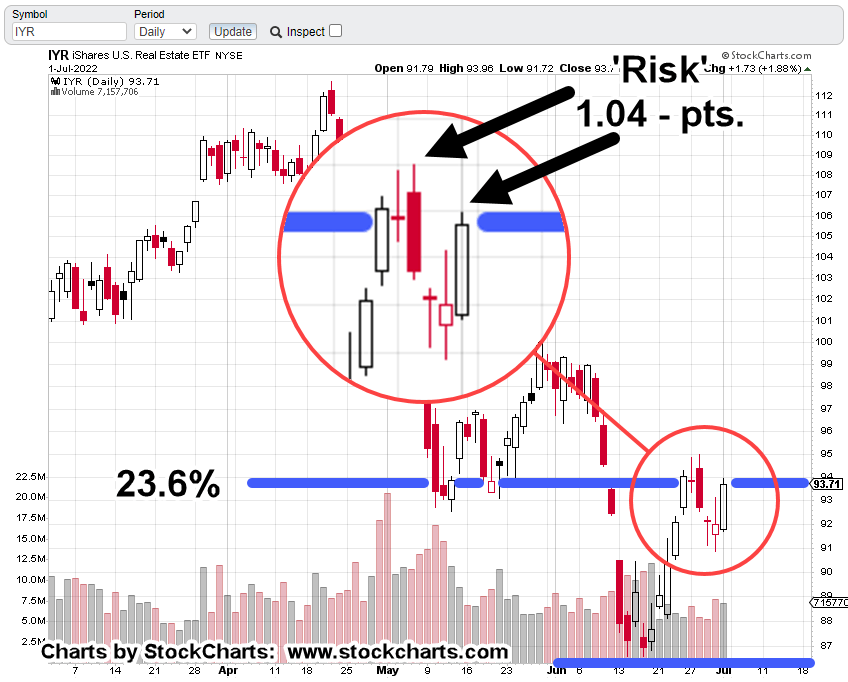
Now that time has passed, let’s remind ourselves when the quote was published with the daily (IYR) chart below.
Not only did IYR, not close higher after that, it never printed higher either. It was the top of the pivot reversal, to the day.
The 23.6%, Retrace
Then we have this report just days ago, showing IYR’s price action coming back to a (very weak) Fibonacci 23.6%, retrace.
The daily chart repeated below, showed the ‘risk’ on a short position as approximately 1.04-pts (not advice, not a recommendation).
Risk Narrows Even More
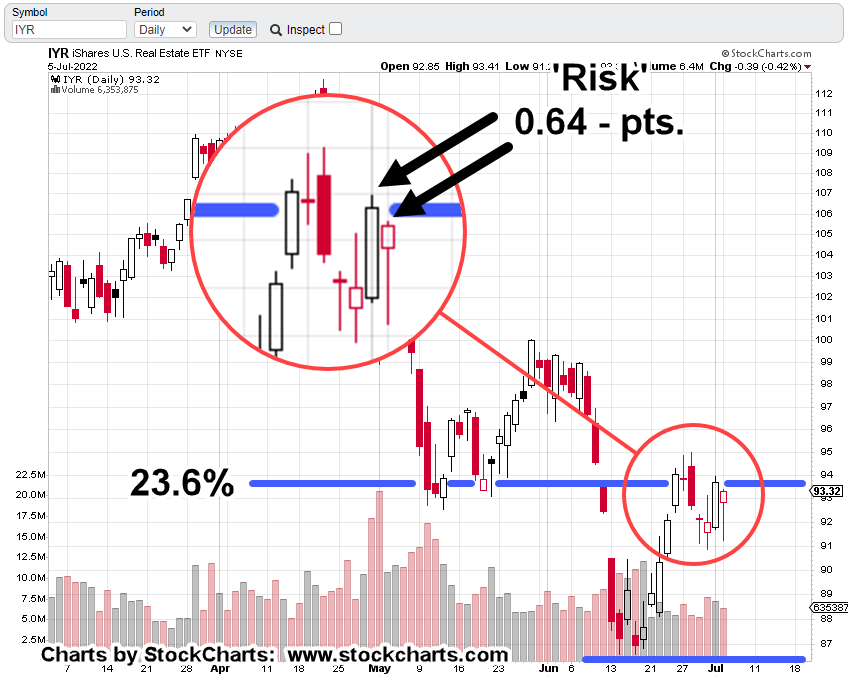
As a result of today’s new daily low and lower close, one can (theoretically) reduce the risk of a short position even further (not advice, not a recommendation).
The risk is now defined as the distance between today’s close (IYR: 93.32) and Friday’s high of IYR: 93.96
A subsequent push above Friday’s high negates the short and would likely indicate a potential move to a 38.2%, retrace.
Subtleties of The Market
A lower daily print and marginally lower close (IYR down just – 0.39-pts.) does not look like anything of consequence.
Could we be right in the middle of a historic crash and not even know it?
Of course, it’s never for sure, until it’s over.
However, if shorting opportunities are being spotted, entered, and managed correctly, probabilities are that one will already be positioned short when ‘the big one’ hits.
Note: Posts on this site are for education purposes only. They provide one firm’s insight on the markets. Not investment advice. See additional disclaimer here.
The Danger Point®, trade mark: No. 6,505,279
Active: Positioned short via SRS (SRS-22-01), with stop at SRS: 16.38
Note: Posts on this site are for education purposes only. They provide one firm’s insight on the markets. Not investment advice. See additional disclaimer here.
As far as is known, no other site has identified, gold (GLD) has “changed hands” with the next probable direction, as sideways or down.
That is, until now.
Sometimes, it literally takes years to find anything useful from mainstream financial media. However, you really can’t blame them; it’s not their job to reveal the truth.
By chance, every once in a while, someone makes a mistake and bits of truth, escape.
That may be where we are with the following Kitco NEWS interview, linked here.
It’s worth a half-hour to watch the entire exchange but for us, the real business starts at time stamp: 19:05.
The Overall Gold, Premise:
If the dollar moves sharply higher and the markets move lower (or crash), gold’s response may be a wash-out to $1,300/oz., or lower.
“Changing of Hands” as identified on this site, was mostly intuitive. We won’t know for sure if it was the (real) inflection point until gold resolves itself.
Now, we have another view from a separate party (above), that at least recognizes gold’s downside potential.
With that said, let’s look at gold (GLD), Quarterly
Gold (GLD), Quarterly Chart
There are only two trading days left in the quarter; it’s reasonable to think we’ll get something similar to the un-marked chart below.
The next chart shows the Wyckoff up-thrust (reversal) along with an attempt to move higher (the test) that was rejected; prices continued lower.
The next chart is the one no gold bull wants to see; downside projection(s).
Using a standard Fibonacci tool, we have the above projections.
If there’s a major unwind of gold positions, price could decline to the GLD, 133-area, corresponding roughly to physical gold @ $1,300/oz.
Uncharted & Unprecedented
The caveat: We’re not in any time that’s happened before (other than maybe the collapse of the Roman Empire).
It’s uncharted territory.
We should expect market events to reach never before seen extremes. That would include the potential for a severe draw-down in gold.
The World, Then
If gold gets to the $1,300/oz level, it would easily be considered a buying opportunity.
What if gold keeps going lower, moving below $1,000/oz?
The second projection, targets approximately $950/oz.
What, then?
What if the $1,300 level, was bought by those with means, using both hands … including massive margin (if it’s still available).
What happens if there’s another leg down; then margin calls?
Can’t happen one might say.
Well, oil going negative for the first time in history couldn’t happen either … until it did.
Note: Posts on this site are for education purposes only. They provide one firm’s insight on the markets. Not investment advice. See additional disclaimer here.
Is this trade set-up still viable and/or worth the pursuit?
Short answer (at this point) is yes, and yes.
We’re going to look at the tape (the chart) and let it tell us what’s happening from a Wyckoff analysis perspective.
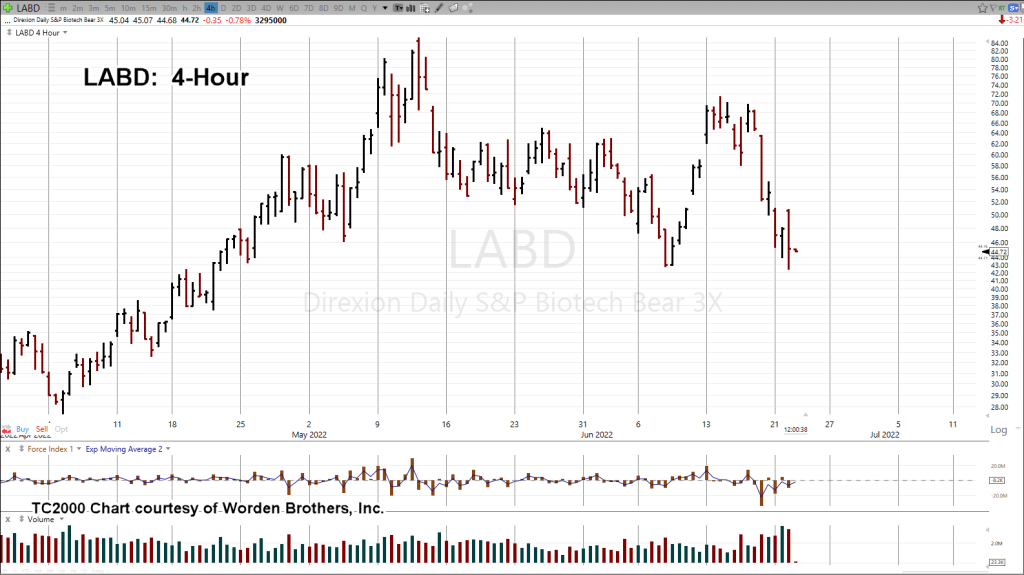
Since we’ve just past mid-session (12:37 p.m. EST), we’ll use the 4-Hour chart.
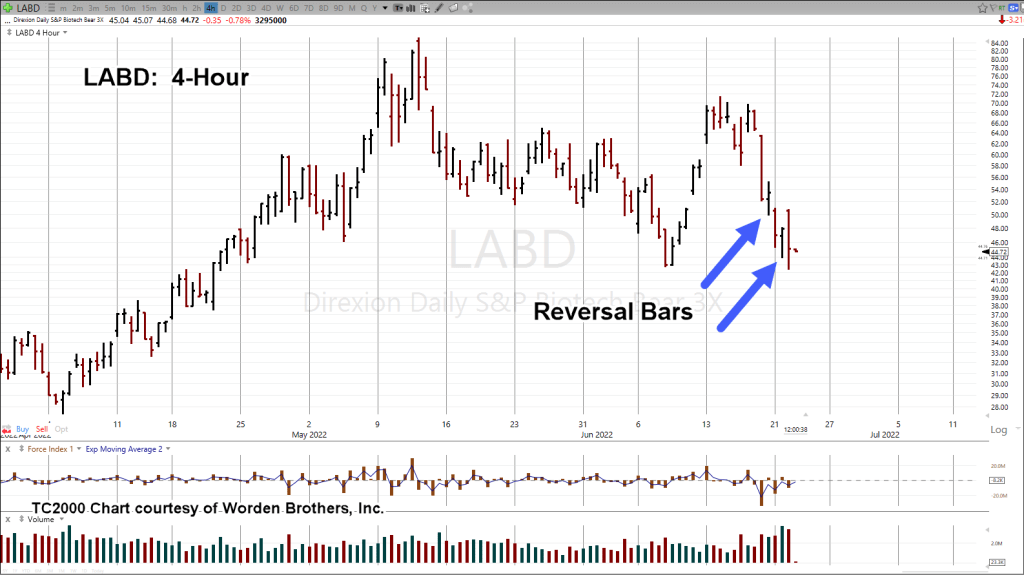
Biotech SPBIO, Leveraged Inverse LABD: 4-Hour
The unmarked chart above, looks like a mess.
Volatility everywhere in the past four sessions; including the Fed announcement on June 15th.
The marked-up chart below shows two distinct 4-Hour reversal bars.
Each of those bars were subsequently penetrated to the downside thus negating any entry signals.
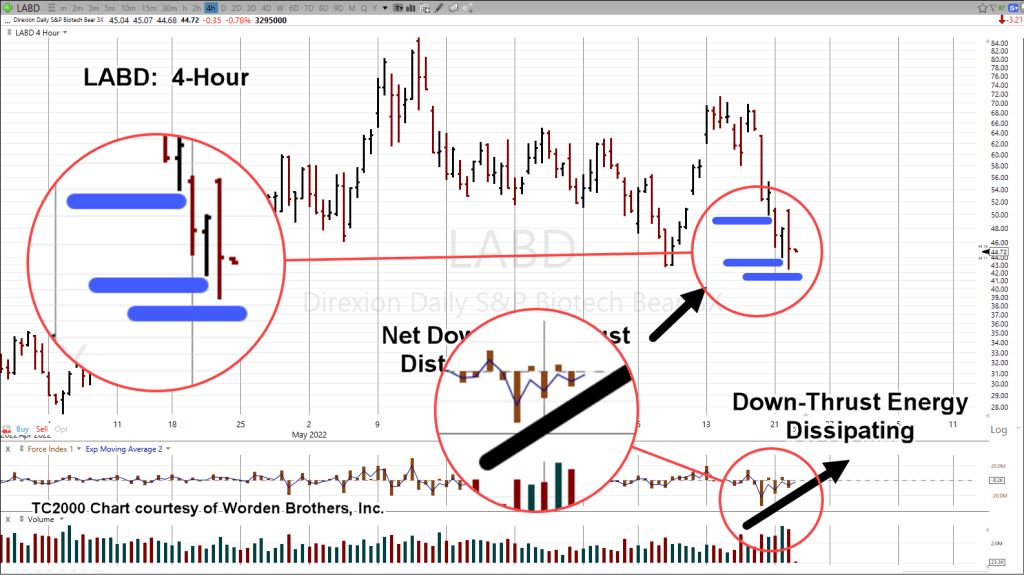
However, it’s the next chart that draws from the secrets of Wyckoff analysis.
That is, “Shortening of the thrust”.
Discussed by David Weis in his training video, when thrusts become shorter, probabilities favor we’re nearing the end of the move.
As shown below, net downward thrusts on the chart have narrowed significantly.
Note that each downward thrust has successively less energy as shown on divergence of Force Index.
The next chart zooms-in.
Positioning
Based on the above, as much as price action gives the appearance of moving lower for LABD (higher for SPBIO), the energy to do so, appears to be spent.
Obviously, the accounts being managed have gone through a draw-down over the past trading sessions.
One account was stopped out @ 44.58 and then re-positioned at 44.01. The other account was allowed to draw down (not advice, not a recommendation).
The LABD-22-04, trade remains intact.
Summary
If the trend remains down for SPBIO, it’s highly unlikely the index will make new daily highs beyond this session.
If it does, then we can consider the trade set-up invalid.
A reasonable stop location at this point for inverse LABD, would be near or below the lows for the day (thus far), currently @ 42.37 (not advice, not a recommendation).
Note: Posts on this site are for education purposes only. They provide one firm’s insight on the markets. Not investment advice. See additional disclaimer here.