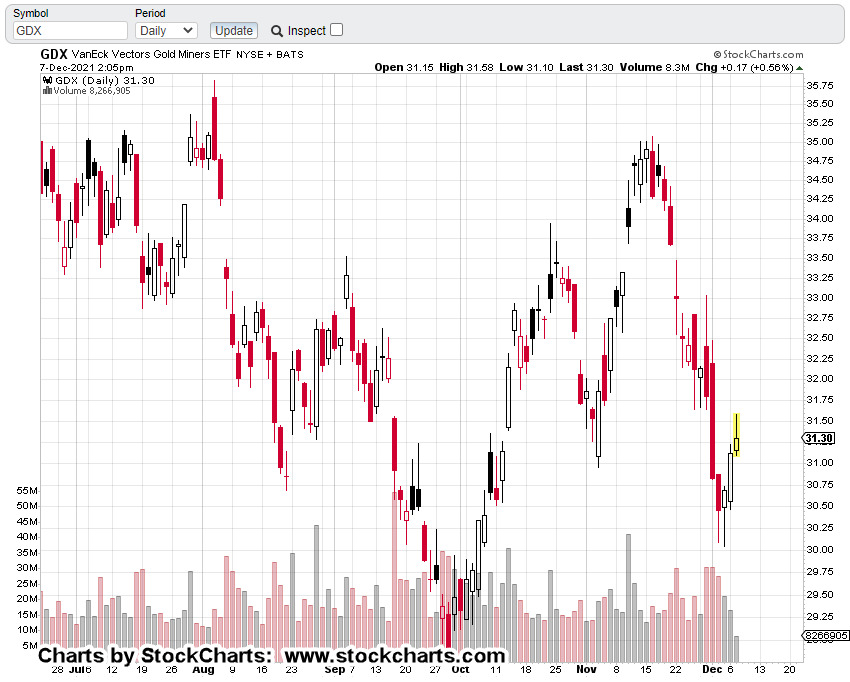
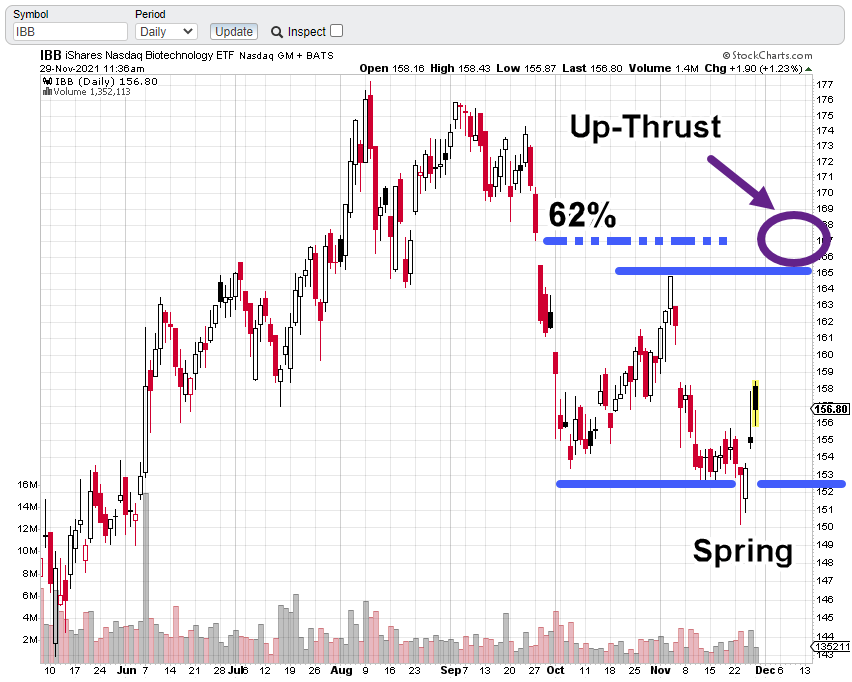
Steven Van Metre, in his Sunday Night Charts (time stamp 12:20), shows the precarious situation of GDX.
There’re about 90-minutes left to go in this session.
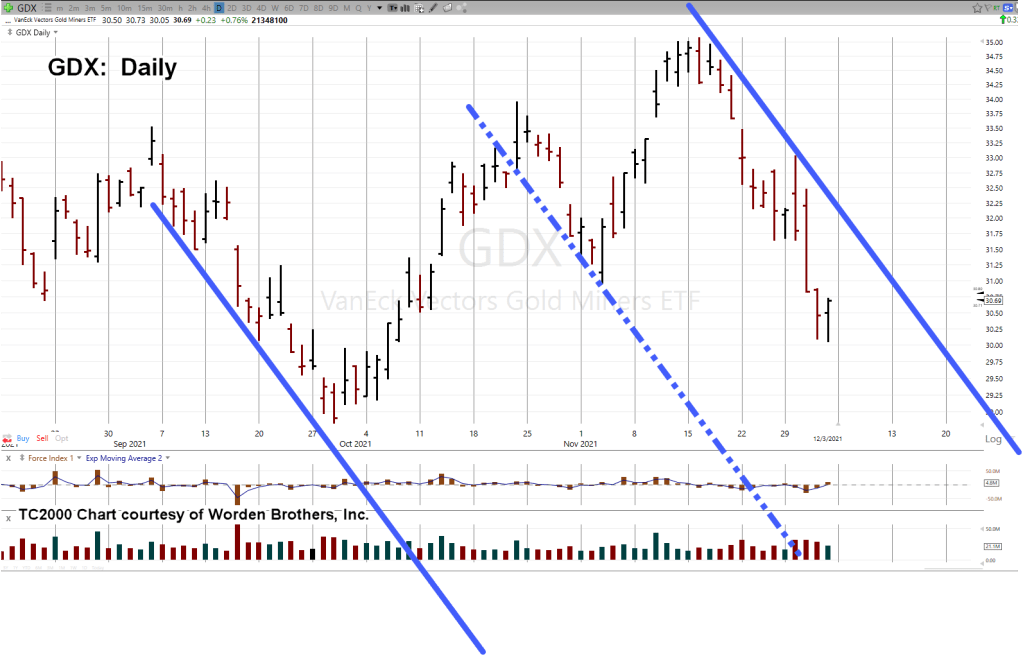
It looks like GDX is/has tested underside resistance and down-trend simultaneously. For GDX to break higher, it would have to get through that resistance.
As always, anything can happen but we need to remind ourselves, the gold bulls are already trapped … having bought at the mid-November breakout.
If still holding, they’re now deep in the red.
Under such conditions, each down move serves to set the (bear) hook even more.
If we use this just released article from ZeroHedge, we’re nowhere near any kind of capitulation and upside reversal.
Senior Miners, GDX
The un-marked daily chart
And now …
With zoom
We’re at a confluence of resistance; the downtrend and the underside of price action.
Let’s keep in mind, the overall markets (S&P, Dow, Nasdaq) are still oscillating around their all-time highs. Volatility has increased as the trend appears to be changing.
Gold and the miners are nowhere near all-time highs.
A century ago, Wyckoff showed how to spot markets that would decline the fastest and farthest under bear market conditions (not advice, not a recommendation).
It’s not the high-flyer we’re looking for … no, it’s the laggard.
That’s the one to pick.
It’s already weak and once the buoyancy of the general market evaporates, the bottom may fall out.
Note: Posts on this site are for education purposes only. They provide one firm’s insight on the markets. Not investment advice. See additional disclaimer here.
This article, just out, is one more data-point on where the next choke-hold will be applied … literally.
If you think about it, this could be the way precious metals are made irrelevant … just long enough for the ‘stackers’ to sell it all for food.
Stay Tuned
Note: Posts on this site are for education purposes only. They provide one firm’s insight on the markets. Not investment advice. See additional disclaimer here.
Insiders are bailing at the fastest pace in market history.
No. 6
Not Everyone’s An Idiot
Take heart.
Here’s at least one person … and a young one at that who’s figured it out.
Like our working-class Cockney Brit, from last week, if they can do it, what excuse does everyone else have?
No. 7
Coming Back To Haunt?
One has to wonder if this piece of work will rue the day when those statements were made.
No. 8
Turn Off The Lights
There are two ways (at least) to look at Germany’s plan to shut down its nuclear power plants.
Frist:
They are complete idiots. Power prices will surge as a result.
Second:
They know that demand is going to evaporate as more are ‘protected’ each day. Better to close everything down while the experienced manpower’s still available.
No. 9
What’s In The Poo ?
Well, it’s not the latest ‘variant’ as this article goes to great lengths to suggest.
To put it in brief terms … it’s to see if you’re eating enough GMO food and insect protien.
However, even bad news could contain seeds of opportunity.
Go to time stamp 1:15 in ‘ice age farmer’s’ link, just above. ‘Countries have or are going to stop exporting food’.
Part of the reason this site has not recently covered corn, wheat, soybeans, is they are at elevated levels.
Sure, they could go higher but the risk of some kind of ‘announcement’ to restrict exports is also rising.
Just like Jimmy Carter did with the Soviet invasion of Afghanistan, so too could the current administration come out with a similar announcement.
At that point, if it happens, there’s likely to be a sharp, deep down-move in the grains.
That’s when to look for opportunity
Stay Tuned
Note: Posts on this site are for education purposes only. They provide one firm’s insight on the markets. Not investment advice. See additional disclaimer here.
That is, unless the current patterns in price action change.
From a professional trader’s standpoint, one has to be on-watch for two things:
First:
Be mentally flexible enough to recognize the trade is falling apart and then exit.
Second:
As Prechter put it years ago, be mentally prepared to accept the huge gain.
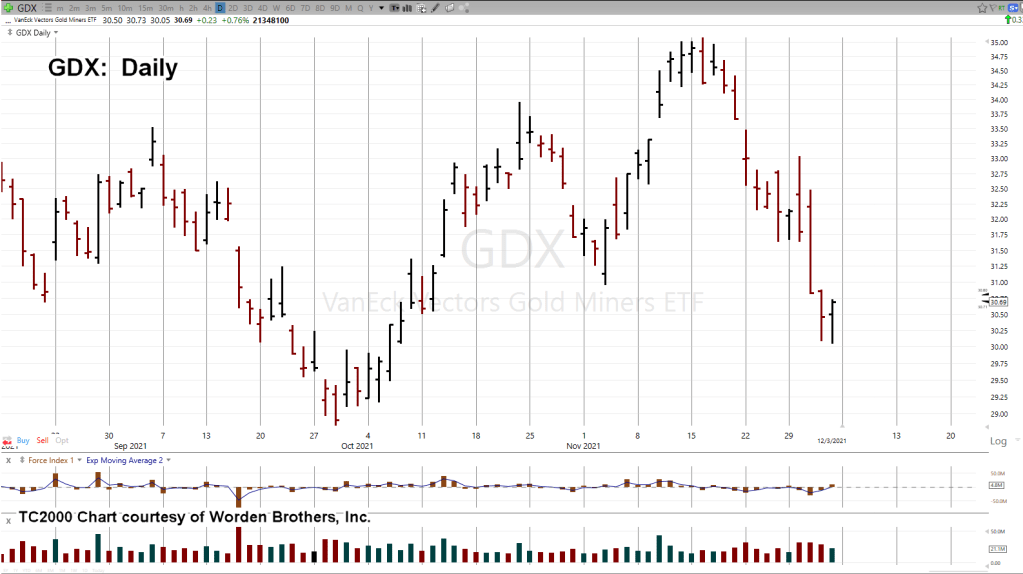
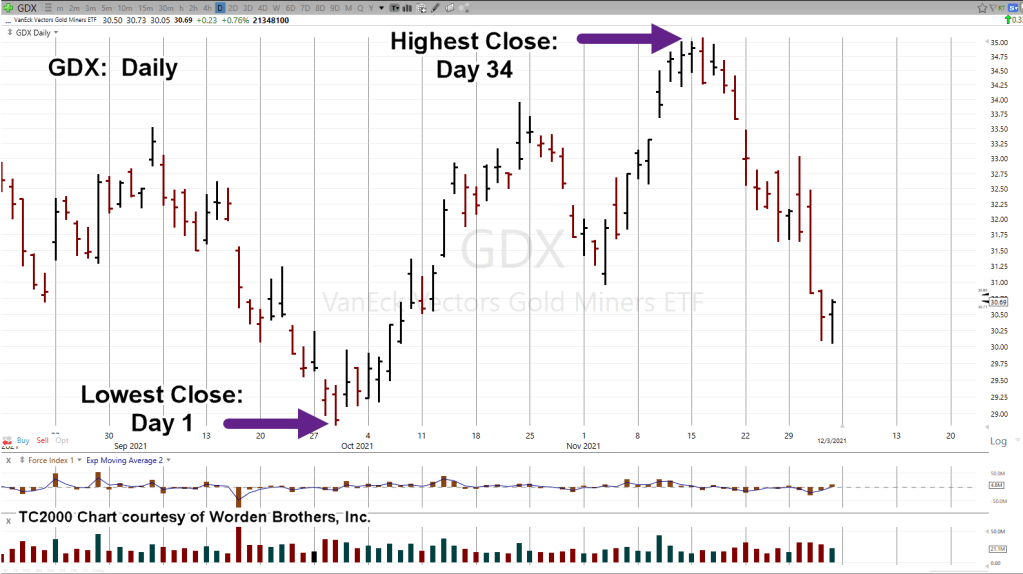
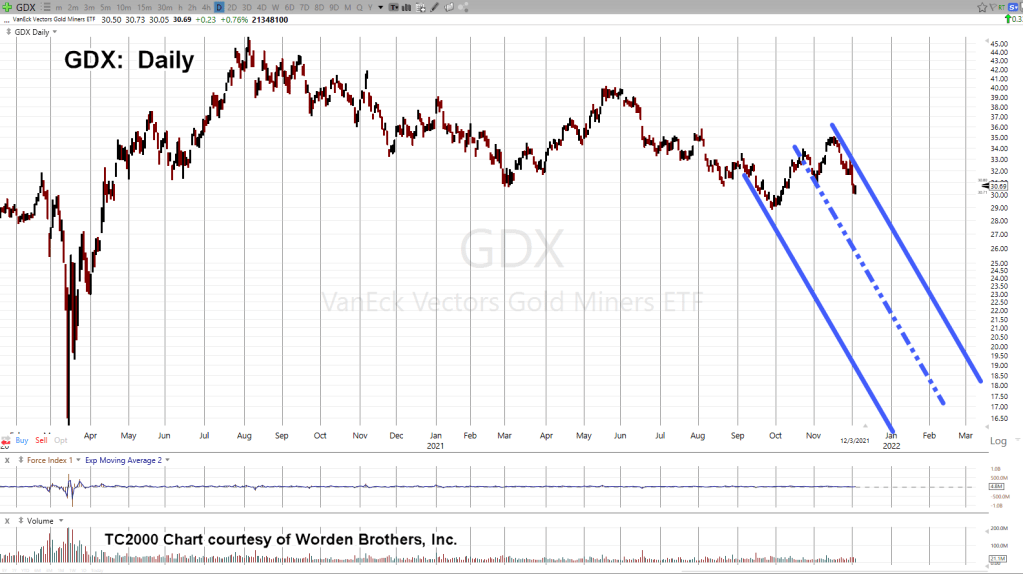
At this juncture, what is the chart of GDX, telling us?
Senior Miners (GDX), Daily
The un-marked chart.
Marking-up with Fibonacci time sequence.
Adding-in some trend lines.
Zoom out to show the big picture.
Summary:
From low-close, to high-close, the counter trend move took a Fibonacci 34-days.
In the process, it appears that price action is now moving within a trading channel.
In addition, the counter-trend print high on 11/16/21, was close to a 38%, retrace level (not shown) of the entire move from the peak on 8/5/20, to the 9/29/21 low.
Positioning
The last update detailed how a short position was opened in the miners (not advice, not a recommendation).
At this juncture, price action continues to indicate lower prices ahead.
The short is being maintained.
Stay Tuned
Note: Posts on this site are for education purposes only. They provide one firm’s insight on the markets. Not investment advice. See additional disclaimer here.
To date, there’ve been 232 transactions in the firm’s main trading account.
Each one has its own story.
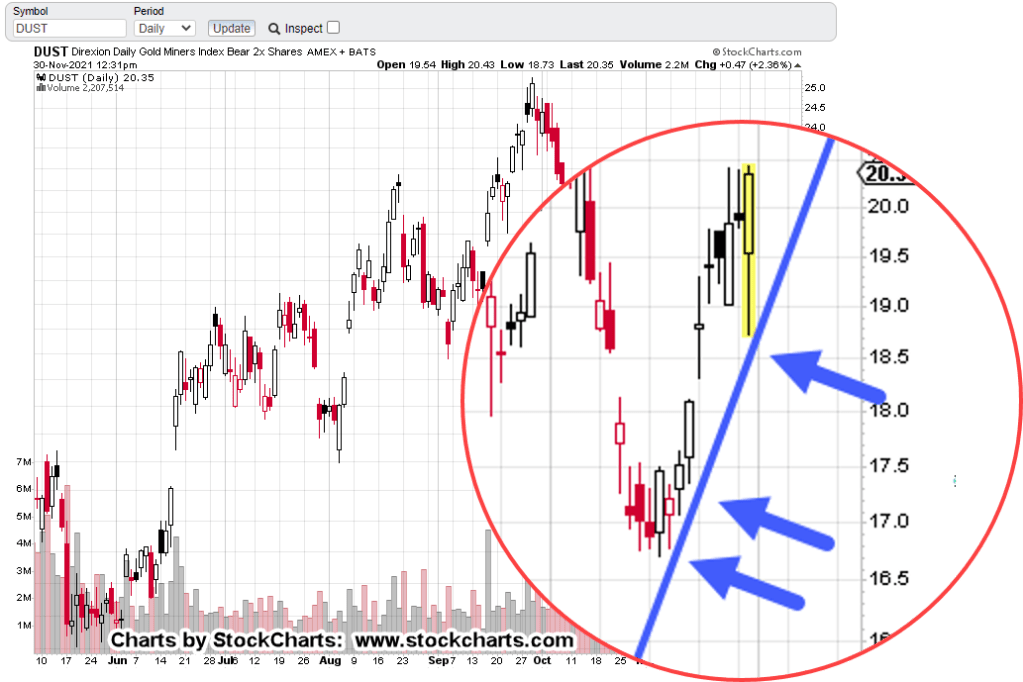
The big one for now, is shorting the gold miners GDX, via DUST (not advice, not a recommendation).
We’re going to pull out the ‘card catalog’ on that one and take a brief look.
As a reminder, this post identified the breakout target for gold (GLD), months before it actually happened.
Also, in a prior post, it was discovered the miners had 3:1 downside response to recent down moves in gold.
Therefore, at this point in time, using leveraged inverse fund DUST, at -2X, the miners, gives an estimated, 6:1, market exposure.
Short entries were opened (shown below) once the gold market and miners broke to the upside.
Hysteria First
Those who’ve been here a while, already know part of the short set-up, was the necessary hysteria needed to get nearly everyone on the wrong (bullish) side.
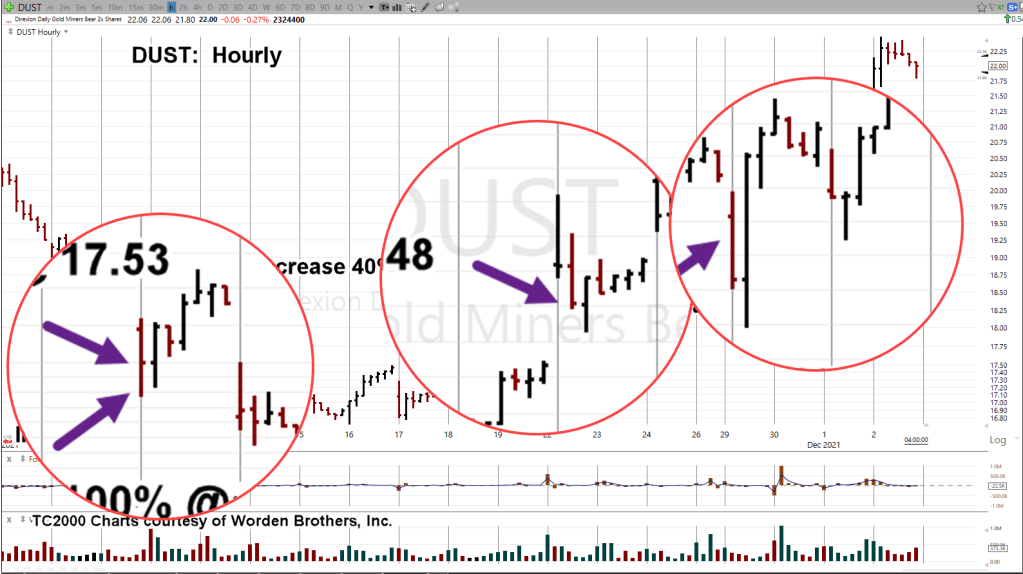
Senior Miners, GDX
Just for reference, the daily chart of GDX, is below.
I suppose it must have been from behind enemy lines, with one of the gold updates warning us about archrival, Russia.
As we can see from the price collapse, the Russians must have found our gold bulls. 🙂
Meanwhile, Back At DUST
The daily chart of leveraged inverse DUST, shows trade entry locations to date (not advice, not a recommendation).
The hourly chart below, gives a closer look.
The next chart is a zoom-in of the entries.
Positioning in this market for now, is essentially complete.
At this point, it’s time to monitor and track for any potential trend reversal or trendline break.
Early Or Late
Years ago, sometime around late 2007, or early 2008, Robert Prechter Jr., said concerning his trades, he tends to be a little bit early.
That implicitly means he might suffer through adverse action including loss-exit, if action goes counter enough.
There’s no perfect entry. Early or late, take your pick.
Fixing Entry Errors
As can be seen on the hourly chart, every trade entry was on a red (declining price) bar.
The risk is, price action will just keep on going red.
The benefit is a big one; I’m not chasing the market.
If I’m chasing, it means I’m not on my game or I never had a game or worse, a coward that can’t pull the trigger on a trade without more ‘confirmation’.
David Weis covers in his video, how to properly get aboard a market that’s already underway.
After the initial entries, DUST banged around the bottom (GDX at the top) for eight trading days.
In retrospect and looking at the chart, the adverse action was not much lower but it did not feel like it at the time.
Because of the months of planning, there was an inference the size of this reversal would be significant.
So far, it is.
In the process of reversing, price action itself has fixed trade entries made a little too early.
Summary
Future updates will show potential trend and/or channel action as well as Fibonacci time correlation.
At this point, the DUST trade is well underway.
A reasonable stop area would be in the vicinity of DUST 19.37 (not advice not a recommendation).
Stay Tuned
Note: Posts on this site are for education purposes only. They provide one firm’s insight on the markets. Not investment advice. See additional disclaimer here.
As the link above says, it’s almost ‘impossible’ to substitute.
Silver goes into nearly everything electronic.
Depending on whom you believe, the mainstream says the Future’s So Bright … right?
However, the charts say we may be headed much lower.
Remember the silver ‘short-squeeze’ and the little guy putting-it to ‘The Man’?
At this point, the only silver put around is on the little guy.
The Man’s going merrily along; short the sector that was so recently hyped with gold to “$3000 In Months, Not Years”
In Steven Van Metre’s latest update, he said no fewer than three times, the Fed ‘does not print money’.
It’s a false belief (by the public) they’re not about to change.
At the end if his video, he promised a report … or to make accessible his research on how that (not printing) is so.
Bringing us to the market at hand.
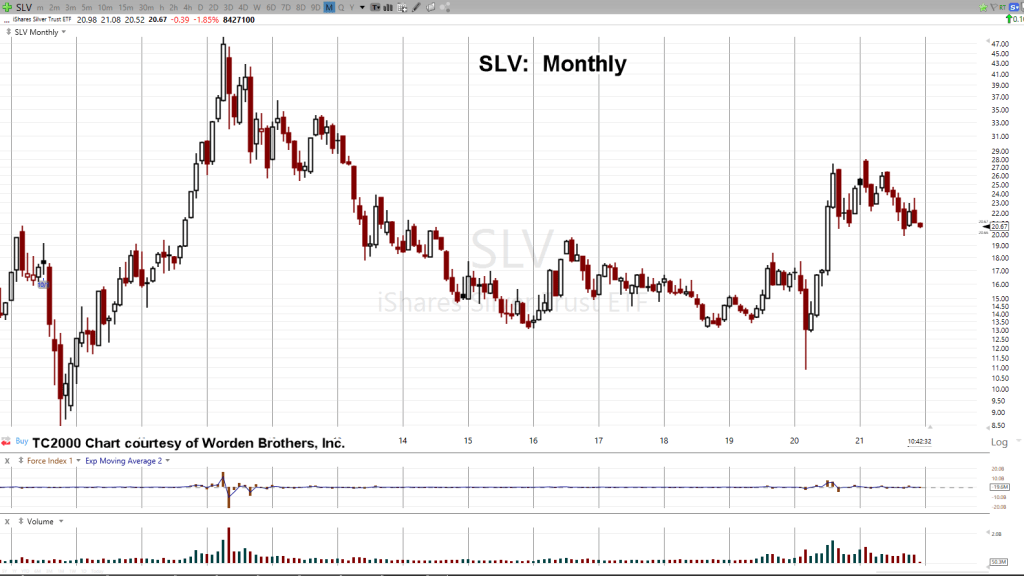
Silver (SLV)
Monthly un-marked chart.
The main thing to note above, SLV, is not at new highs.
In fact, at today’s price, SLV is down over 57%, from its all-time high set in April of 2011.
That in itself, should say there’s something wrong with the inflation, hyper-inflation, narrative.
Using a standard Fibonacci projection tool and tagging the 2011 high, the 2020 low, and the 2021, retrace high, we get the following:
It’s a little hard to see … so we’ll zoom in on the right side.
The 50%, Fibonacci projection, is somewhere between SLV: 9.00, and 9.50.
The premise for declining past 38% (around 13.70) and getting at least to 50%, is predicated on the collapse of the economy and subsequent evaporation of silver demand … at least from an industrial standpoint.
The precious metals ‘stacker’, discussed below, might become more interested in obtaining food than continuing to stockpile something that in times of famine, has very little use.
As Bjorn says in ‘famine’, come this spring, when the masses realize there will be no (or very little) food and/or you need ‘papers’ to buy food, market pandemonium (if not already) is the likely result; precious metals included.
When To ‘Stack’
So, when will be the time to acquire precious metals (not advice not a recommendation).
It’s deceptively simple; ‘When you don’t want to’.
The time to acquire an asset, is when nobody else wants it … including you.
Positioning short the gold miners GDX, was done when everybody and their dog was a manic bull; screaming an upside breakout was “imminent”.
As Prechter said, positioning opposite the herd involves overriding the limbic system of the brain.
It’s an intellectual (logic-only, thinking) process.
However, overriding the lower brain, i.e., going against the herd, is physically painful.
Excruciating, is a better description.
He went on to say, some of the best traders/speculators he ever knew, were former Marines.
Positioning
Coming up (most likely tomorrow) will be a chart showing positions opened in GDX inverse fund DUST (not advice not a recommendation).
There’s no obligation on this site’s part to reveal that information.
However, it will help explain how the market itself directed trading actions.
It will also show how the on-going reversal corrected several entry errors on my part.
Stay Tuned
Note: Posts on this site are for education purposes only. They provide one firm’s insight on the markets. Not investment advice. See additional disclaimer here.
You have to wonder; will this nonsense be the excuse for a market collapse?
Looks like the gold miners (GDX) are not waiting around to find out.
Yesterday’s ‘gut-check’ counter trend move, was summed up with the following quote:
“Such a move, is typically what happens just before a market gets underway in earnest.”
Today, the Senior Miners, GDX, reversed and closed down a solid, – 3.05%.
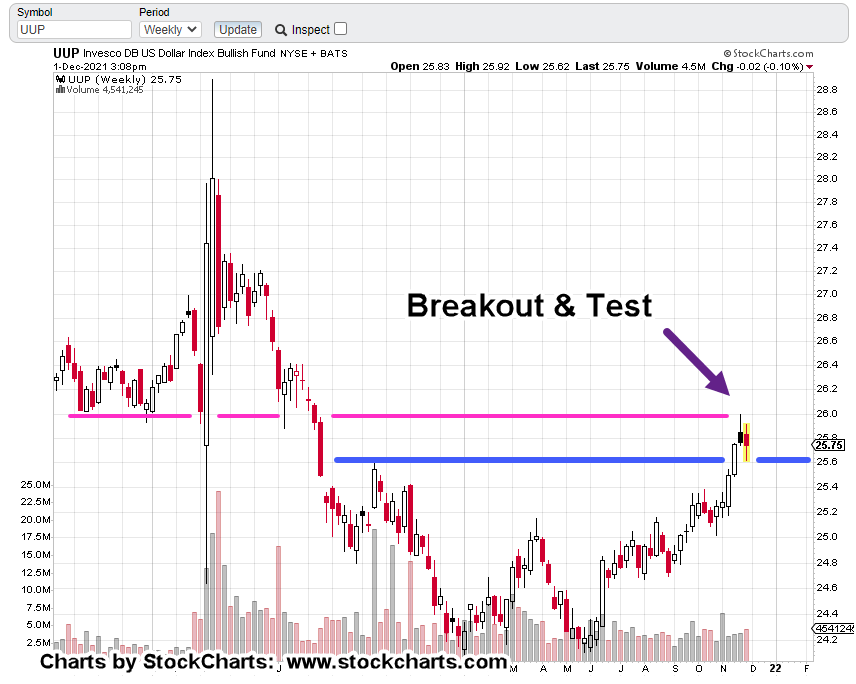
However, the main topic for the day is the dollar and specifically, the UUP tacking fund.
We’re just a few days shy, where a year ago, this site identified the dollar was in position (potential does not equal guarantee) for a sustained upside reversal.
Dollar, UUP
The weekly chart of UUP shows where we are.
The magenta line is resistance and the blue line is support.
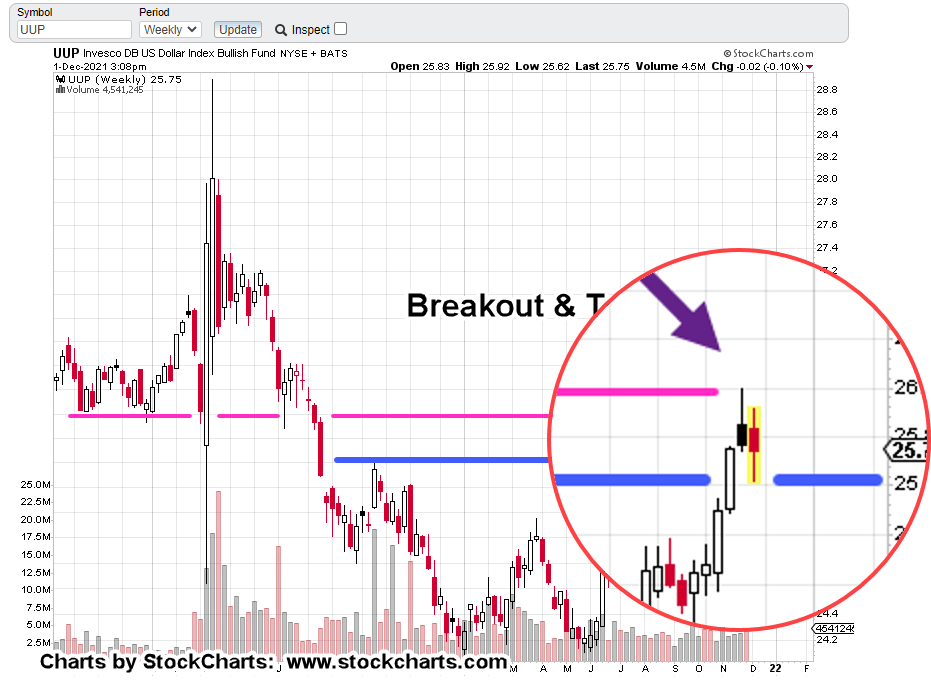
The next chart highlights the current action.
If the rally is to continue and if this market action was happening at some other (non-Omicron) time, you’d expect an amount of sideways oscillation before more upside; maybe several weeks or so.
It could happen that way … or, behind Door No. 2, we might have some kind of ‘event’ launching the dollar over the resistance area.
Farther down on the list, is downside reversal.
However, at this point, gold (GLD) and the miners, are saying it’s the lower probability choice.
Note: Posts on this site are for education purposes only. They provide one firm’s insight on the markets. Not investment advice. See additional disclaimer here.
Note: Posts on this site are for education purposes only. They provide one firm’s insight on the markets. Not investment advice. See additional disclaimer here.
Note: Posts on this site are for education purposes only. They provide one firm’s insight on the markets. Not investment advice. See additional disclaimer here.
If you have to deal with asleep, brain-dead, self-hypnotized, condescending, mainstream news-feeders, here’s a tip.
Remember, it’s not “your opinion”.
Patent numbers, patent descriptions, dates, names, payrolls, money trails, corporations, whistleblower testimonies, irrefutable compilations like this, are not an opinion.
They are fact.
No. 2
No Infrastructure
From time stamp 12:08, to 14:27, in the above link (repeated here), there are 108, players or individuals receiving the benefits of ‘Speck’ protection.
We call it The Speck from Horton Hears A Who … because it’s so small, nobody’s ever found one; not even the Cee Dee Cee or the N ‘EYE’ H. Sorry for the ‘code’.
The majority of those in the compilation are so protected, they won’t ever need another update.
You might say, they’re ‘fully protected’.
We can take that montage and extrapolate it to the rest of the population. Remember this?
It does not take much to figure out, rapidly increasing instability is the way forward.
While there may be an infrastructure bill in name … if workers are not available and supplies restricted or non-existent, there’s no infrastructure.
Admittedly, that’s very oversimplified.
Sure, there may be some projects that get started and have limited progress.
However, after reading this summary of the built-in insanity, one really has to actually be favoring a collapse so these projects don’t get implemented to any large degree.
Bringing us to the next item.
No. 3
Double-Secret-Probation, ‘Omicron’
It would be nice to laugh at stupidity if stupidity wasn’t so dangerous.
The powers are wasting no time … declaring a ‘State of Emergency’ even though nothing has happened.
They openly mock the idiots that still buy into the hype; their contempt, completely out in the open.
Even a working-class Cockney Brit, has got it figured out. It can’t be that hard, can it?
Note at time stamp 2:40, it shows that we may have already had the Epsilon variant. It must have come and gone.
I completely missed it. My bad. 🙂
No. 4
The Sheep … Too Far Gone
A hopeful comment taken at time stamp 4:02, at this link:
Those who have bought in, and voluntarily injected themselves … even if they were lucky enough to get a placebo, will not wake up.
Amadha Vollmer has stated it well when she said, ‘when the truth finally hits, they will lose their minds.’
From a Biblical standpoint, that does not mean we give up on them. Plant the seed but then walk away and continue to prepare.
If by some miracle … because that’s what it would have to be, they do wake up, it’s your opportunity to take the lead and direct their (an your) next steps.
You can’t make this up and it’s more insane by the day.
The sheer repetition of the fear narrative, like ever-increasing drug use for the same effect, has got to be wearing off … becoming less effective with each news release.
On top of that, there are literally less people able to buy into the narrative
Reference No 1, above. They have already received full protection; not subject to further updates.
No. 6
Sky High Ammo Prices
Going to the comment sections on YouTube sites or vendor sites, has the typical collection of blowhards saying:
“I refuse to pay these prices. I’m going to wait until they come down”.
It’s possible, at least some of these guys are the same middle-aged, overweight, out-of-shape posers, that like to have useless crap all over their AR.
When the bravest guy in the room is a woman (linked here), it means, that trash hanging off your AR is a bill-board; effectively saying:
‘I’m hiding behind my AR crap and probably a coward’.
Another woman, linked here, has actually decided to use the AR platform.
If that’s the future availability of our currently high-priced product, meaning there is none, does it really matter how much it costs now?
Of course, the posers are busy posing.
They won’t matter when it all hits. They’ll still be waiting for prices to come down on something that’s no longer there.
No. 7
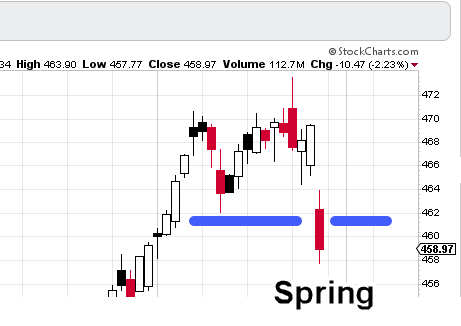
S&P, In ‘Spring Position’
Price action penetrated support last week and is set to attempt a rally.
The futures market opened about 90-minutes ago and shows S&P trading up about +0.80%.
That upward bias may also lift the Basic Materials Sector (DJUSBM) and possibly offer a low risk short position via SMN (not advice, not a recommendation)
Note: Posts on this site are for education purposes only. They provide one firm’s insight on the markets. Not investment advice. See additional disclaimer here.