Note: Posts on this site are for education purposes only. They provide one firm’s insight on the markets. Not investment advice. See additional disclaimer here.
Note: Posts on this site are for education purposes only. They provide one firm’s insight on the markets. Not investment advice. See additional disclaimer here.
Within the mirage of fake data, one thing’s not fake, the price.
The latest revelation about fake data, comes at this link, telling us something we already knew; the jobs data is a complete mirage.
What must be over a year ago, Neil McCoy–Ward, presented a series whereby he reviewed several individual, personal diaries, from The Great Depression.
From that series, no-one (in the public) seemed to know the extent of unemployment until much later.
The numbers were ‘hidden’ back then, just like now; what a coincidence.
The search, and need for the ‘truth’, becomes more clear by the day. In the markets, truth is the price and price only.
Apparently driving it home, revelation that chief cook and (woke) bottle washer Netflix, drank the Kool-Aid and overestimated advertising demand.
The last update on NFLX, stated there may be a rally to test the breakdown. So far, it hasn’t happened.
Last Thursday’s – 8.6%, ‘air-pocket’, may have been the kick-off to much lower prices (not advice, not a recommendation).
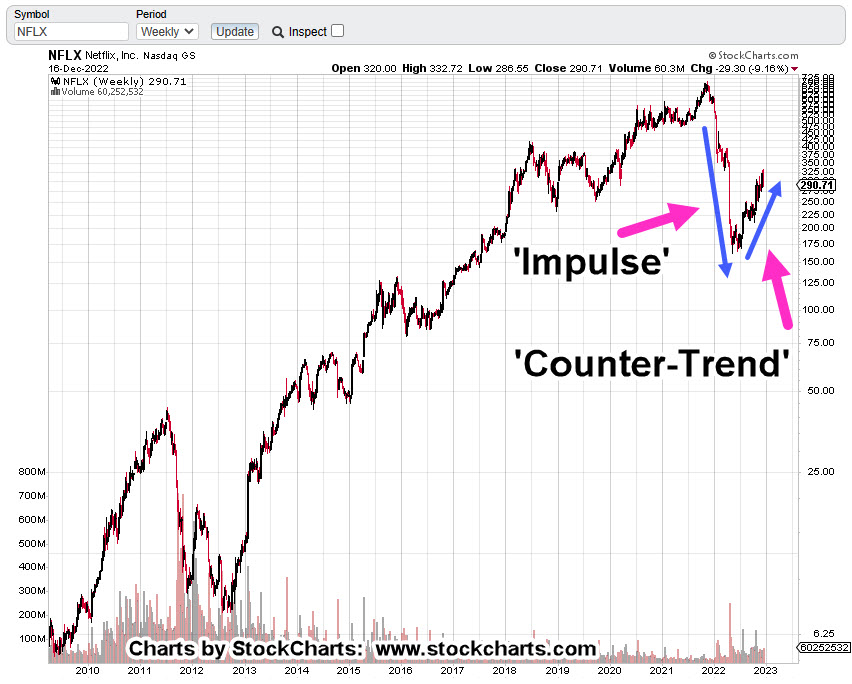
Let’s take another look at the big picture on Netflix.
Netflix NFLX, Weekly
Very quickly we see the overall (impulsive) direction of the market is down.
In Wyckoff terms, there’s what he called ‘ease-of-movement’, to the downside.
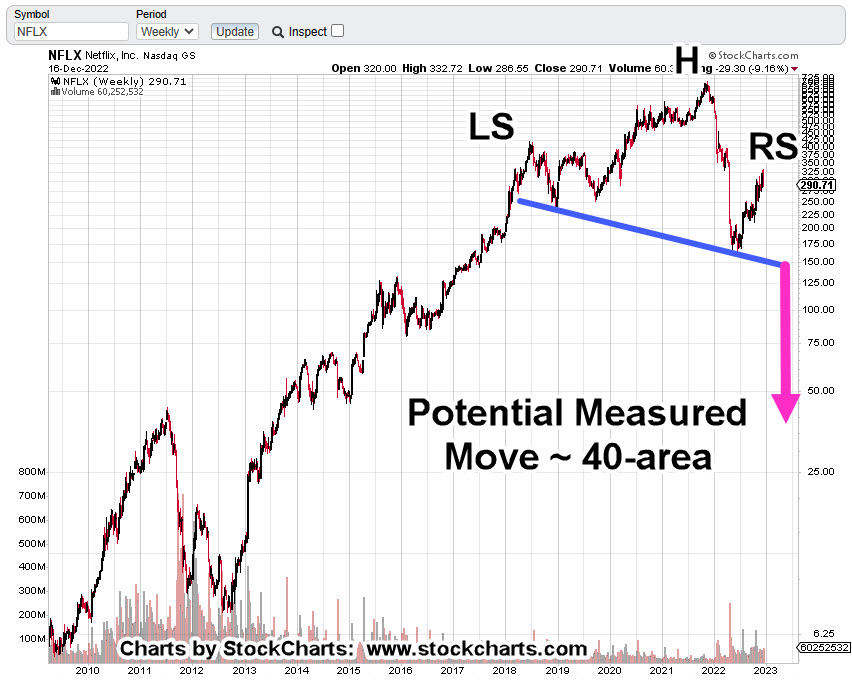
Next, we have a possible Head & Shoulders, top.
If NFLX, reverses from here all the way down to the neckline (blue line), and if it breaks that line, then we target the 40-area; that’s a lot of ‘ifs’.
Moving in closer on the daily chart, is the following:
Netflix NFLX, Daily
The wedge breakdown is clear.
There was an attempt to rally, if you can call it that, on Friday. So far, no significant upside action.
The zoom area shows price action still below the lower wedge boundry.
Netflix is different from our other potential implosion, short candidate (which proved correct), Carvana, CVNA.
That difference, Carvana sold a product for which there was an actual need, i.e., transportation.
Summary
It’s been just over a year since the CVNA, ‘No P/E’, report.
Carvana’s a slow-motion train-wreck; down over -98%, as of Friday’s close.
Note: Posts on this site are for education purposes only. They provide one firm’s insight on the markets. Not investment advice. See additional disclaimer here.
Well, ladies and gentlemen, we have a completely discretionary (spending) business, that looks ready to resume its downtrend.
As the American public is forced to figure out what they need and what they don’t, paying for streaming movies can be eliminated from the ‘must haves’, with ease.
We’ll look at the big picture first to see what’s actually happening.
Netflix (NFLX) Weekly
The massive downward thrust (dropping over -35%) on April 20th, this year, created a huge gap on the daily chart.
The weekly shows it took thirty-two weeks to fill the gap, starting from the April lows.
The next chart has a terminating wedge, similar to gold (GLD) as discussed previously.
The daily chart shows the wedge close-up.
The lower trendline has been decisively penetrated and action is currently thrusting lower.
We’re at mid-session, 1:12 p.m., EST.
As NFLX, heads into the close, it’s possible there may be an attempt to rally, testing the lower wedge boundary (not advice, not a recommendation).
Note: Posts on this site are for education purposes only. They provide one firm’s insight on the markets. Not investment advice. See additional disclaimer here.
At least, that’s what the media wants us to believe. The CPI is out, and ‘inflation’ has slowed.
The problem is, as Michael Cowan stated in this update (he’s done the work), from here, it does not matter what the Fed does.
The decline (crash) or whatever you want to call it, is baked in the cake.
Once deflationary forces start, it becomes a juggernaut.
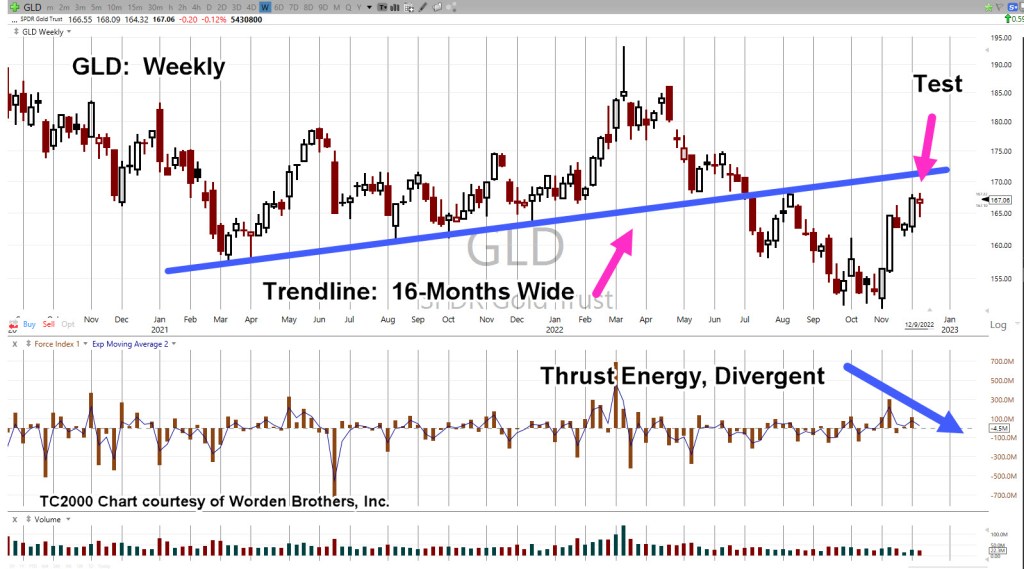
The previous update on gold (GLD) showed in multiple time frames, upward thrust energy is dissipating; in at least one case, (weekly) it’s also divergent.
Now that we’ve had yet another blip higher, as expected, it’s rabid bullishness in the gold camp.
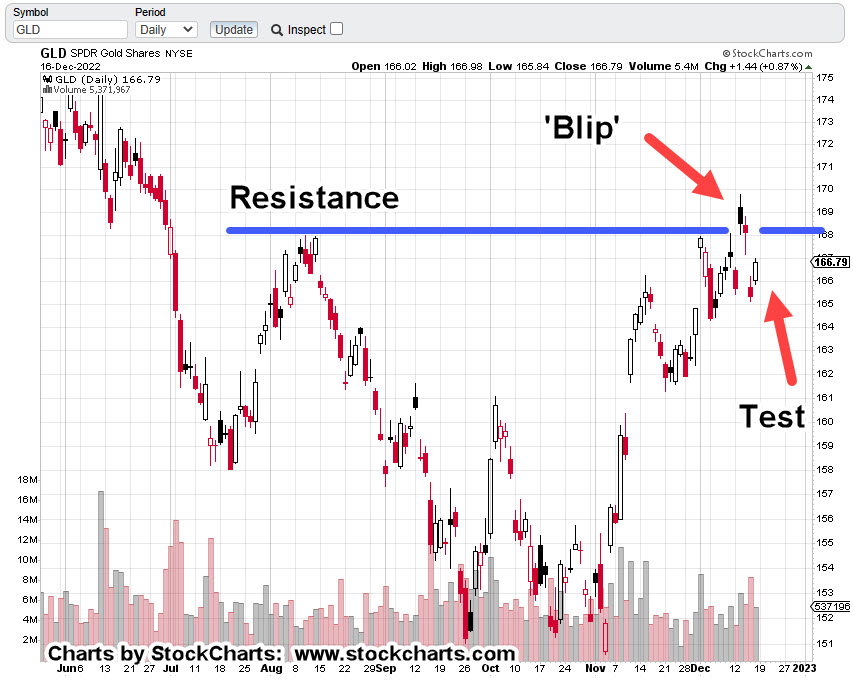
So, let’s look at what GLD, is actually doing. What does the market say about itself?
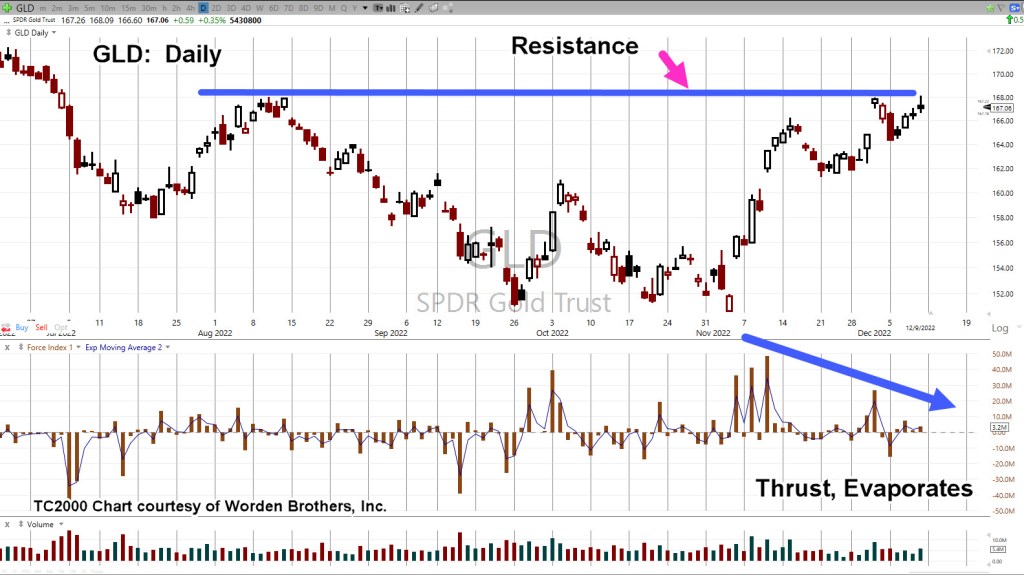
Gold (GLD), Daily
One thing is for sure; GLD, is at The Danger Point®
If GLD can’t hold above (and move above) this level, it may be in serious trouble.
Let’s look at it a different way … the terminating wedge.
A ‘wedge’ is typically the last pattern in a move up or down, hence the name.
As this post is being created (12:23 p.m., EST), GLD continues to decline from its open; currently sitting right at the resistance (potential support) level at the 168-area.
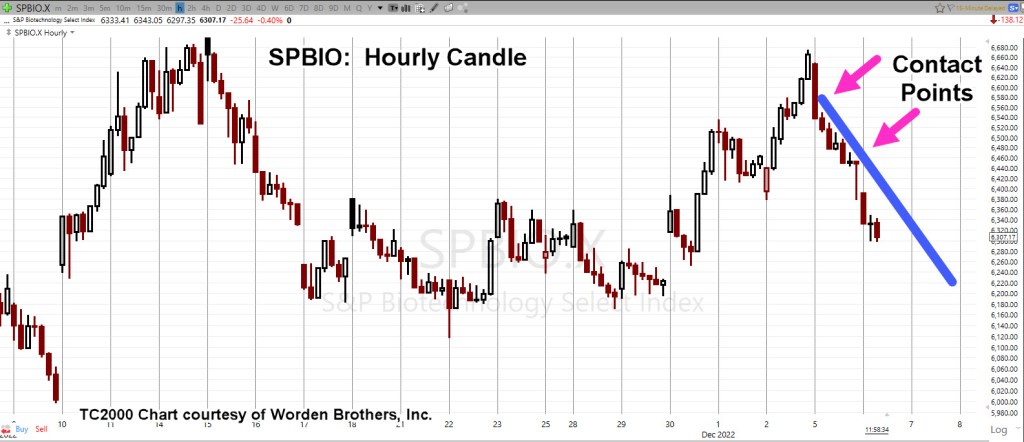
In a separate market, biotech SPBIO, has completely reversed its opening spike and is now posting lower.
We’re still maintaining the LABD-22-14 trade (not advice, not a recommendation).
Today’s CPI print and resulting price action, may be the kick-off to an overall sustained and persistent decline.
Note: Posts on this site are for education purposes only. They provide one firm’s insight on the markets. Not investment advice. See additional disclaimer here.
From the date of the second link above in April, this year, gold (GLD) is down about -8.5%.
Not exactly a crash but definitely not a ‘paradigm shift the world has yet to fully process’.
Just from a contrary standpoint, if ‘everybody’s doing it’, there must be something else going on.
Let’s take a look at the actual facts, the price action, and see what it’s telling us.
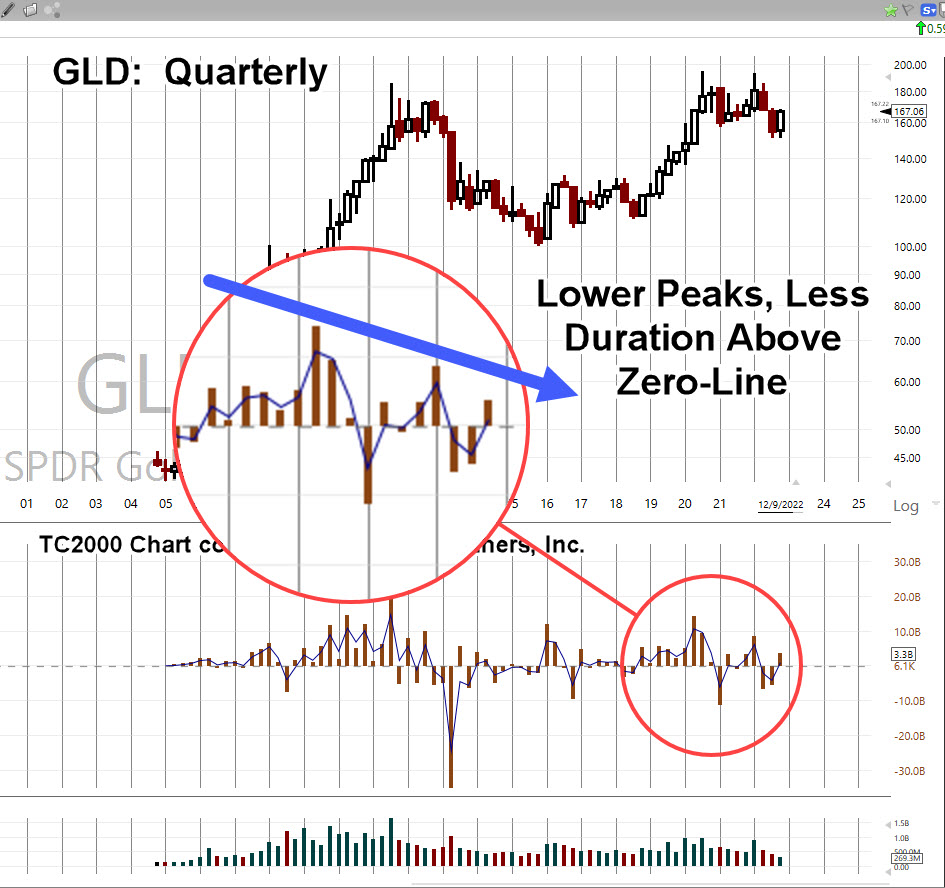
Gold (GLD), Quarterly
Looking at the big picture first; the quarterly chart.
Elder’s Force Index (shown in the middle section) has been expanded to detail the thrust energy behind the move(s).
It’s important to note, for at least the past 10-Quarters, two and a half years, the upward thrusts have been successively declining in energy.
That decline is highlighted below.
Next, we’ll drill down to the monthly chart.
It shows GLD, trended (slightly) higher for at least sixteen-months, before breaking down.
GLD, Monthly
Now, as the right-most magenta arrow shows, we’re at the test of underside resistance.
Tests may pass or fail; obviously, what happens next is important.
Also note, as with the quarterly, upward Force Index on the monthly, is declining.
We’ll take it one step further and go the weekly … it too, has declining and also diverging upward thrust.
GLD, Weekly
Ok, you talked me into it. 🙂
Let’s go to the daily and see the same thing.
GLD, Daily
Does all this mean gold will immediately go lower at the next open?
The short answer … it’s not known. However, from a probability standpoint, lower is more likely than higher.
No ‘Capitulation’
There’s nothing to indicate downside capitulation.
Nothing like the ‘changing of hands’ that took place this past March 8th, here and here.
It appears we’re still in the initial stages of a long-term downside reversal.
Downside? … How’s downside, even possible?
‘What kind of idiot comes up with that type of analysis?’
Moving Parts, A-Plenty
Every day, we see things going on in the background that could not be known or fathomed; like missing $80 Trillion?
All it takes, is for some kind of sovereign debt or derivatives blow-up, requiring that country to sell its assets like gold, silver, oil, grains and so on.
A huge dump on the gold market, would of course trigger stops and that in itself, could result in a contagion of selling.
If or when it happens, the downside might be temporary like the Flash Crash of 2010, or oil going negative, or it could be longer.
The ‘powers’ don’t seem to be too concerned with precious metals demand, prices, and low stock of physical at the commodities exchange(s).
Note: Posts on this site are for education purposes only. They provide one firm’s insight on the markets. Not investment advice. See additional disclaimer here.
As with the Carvana analysis, a year ago which said CVNA, would likely not survive, so too it would appear, biotech is about to join the ranks.
Join the ranks but for different reasons.
Price action leading the news was a concept presented decades ago by Robert Prechter Jr., as part of his Elliott Wave Theory.
His view was the market indicates ‘social mood’; in that case, the market must go down first, before the bad news comes out.
In effect, the public has to be ready and actually want bad news and/or be ready for unexpected, cataclysmic events.
It’s the complete opposite of the accepted mantra, from financial advisors and media alike.
The bear flag in biotech SPBIO, has been forming now for three months. In the history of this sector, there’s never been anything like it.
The last update said there’s been a change in the character of price action; that SPBIO, is heading lower and about to threaten the bottom of the flag.
As we’ll see from the daily chart, indeed we’re getting close.
At this point, there’s no apparent demand for the upside.
Biotech SPBIO, Daily
The change in character is clear. We’re pulling away from the top of the flag and now, hovering at the lows.
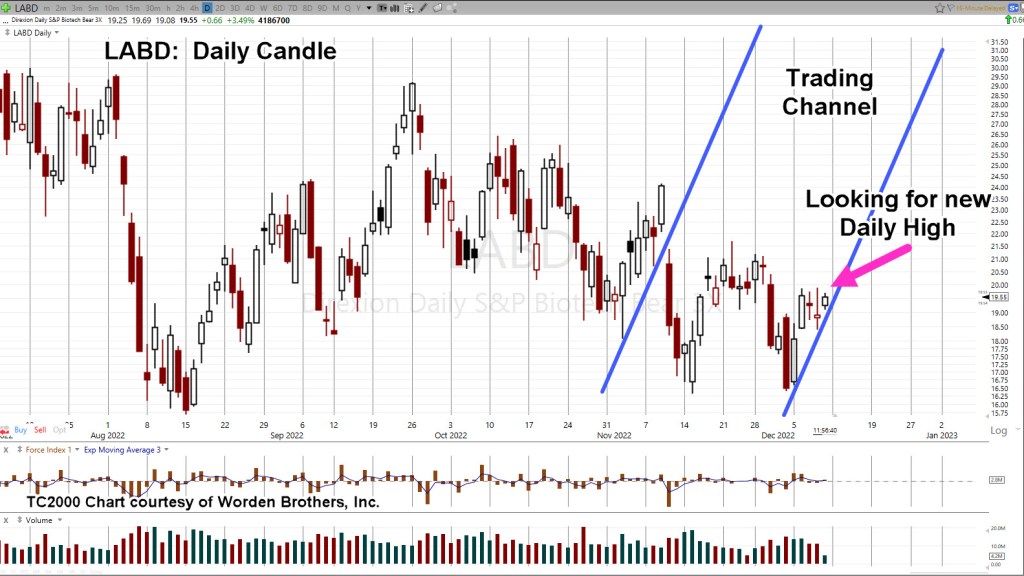
Switching gears and going to the 3X leveraged inverse fund LABD, on the daily basis, we see repeating trend lines.
SPBIO, 3X Leveraged Inverse LABD, Daily
As the magenta arrow shows, we’re looking for a new daily high in LABD, to confirm the trendline; that high would naturally correspond to a new daily low in SPBIO.
As of this post (1:02 p.m., EST) neither one has occurred.
Summary
Even as the overall markets are mixed to slightly higher, SPBIO, is posting down – 1.51%; a possible indication it may lead to the downside.
Just exactly what ‘news’ is about to come out is unknown.
However, at this juncture with action pressing lower, it appears, the market is ready.
Positioning
Not advice, not a recommendation.
LABD-22-14
Entry@ 18.905, 18.95*** Stop @ 18.36***
Note: Positions may be increased, decreased, entered, or exited at any time.
Note: Posts on this site are for education purposes only. They provide one firm’s insight on the markets. Not investment advice. See additional disclaimer here.
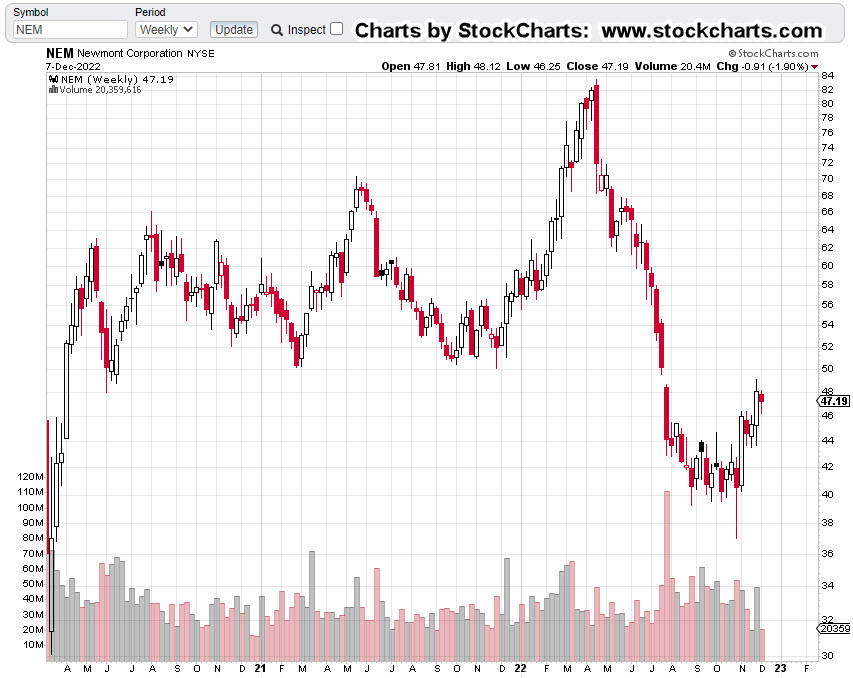
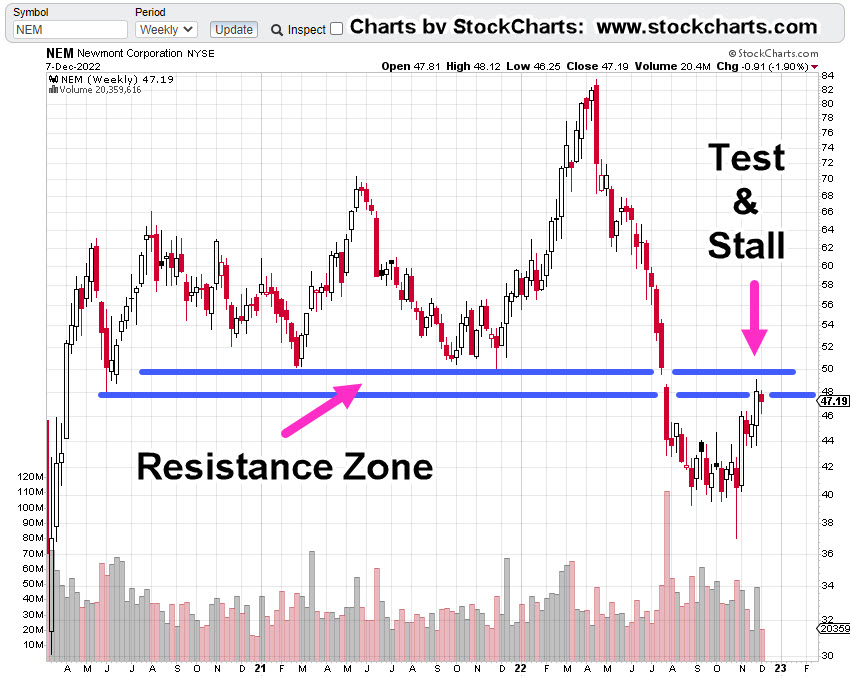
So, let’s take a look at a the largest cap in the mining sector, Newmont and see what the price action is telling us.
Newmont Mining NEM, Weekly
First, we have the un-marked chart and right off the bat, it does not look good; down -45.4%, from all-time highs.
It looks even worse, when the resistance zone is added.
So far, price action has already stalled and not been able to hold within the resistance zone.
It’s important to note, this resistance area is over two years wide. it’s not likely that anything’s going to happen to the upside without numerous attempts.
No ‘Clicks’, In A Gold Bear Market
If buying gold was the answer to getting through the financial, economic and societal collapse, then one would think the price would be moving relentlessly higher.
Note: Posts on this site are for education purposes only. They provide one firm’s insight on the markets. Not investment advice. See additional disclaimer here.
Note: Posts on this site are for education purposes only. They provide one firm’s insight on the markets. Not investment advice. See additional disclaimer here.
That’s the way it looks at this point as we’ll see below.
The ZeroHedge article in question, is linked here.
You can see, it starts off (before being grey-ed out) with referencing the Non-Farm Payrolls report; a report, that another article calls ‘rigged’. So, there’s that.
With each passing day, it’s ever more apparent, price action itself, is telling us the most probable market direction.
Just to prove the point, Blackstone’s sending out a ‘talking points‘ memo to keep clients calm and help ‘guide the conversation’ … i.e., ‘thought shaping’.
Thoughts ‘shaped’ or take action.
For this update, we’re taking action; looking at what the real estate market is telling us.
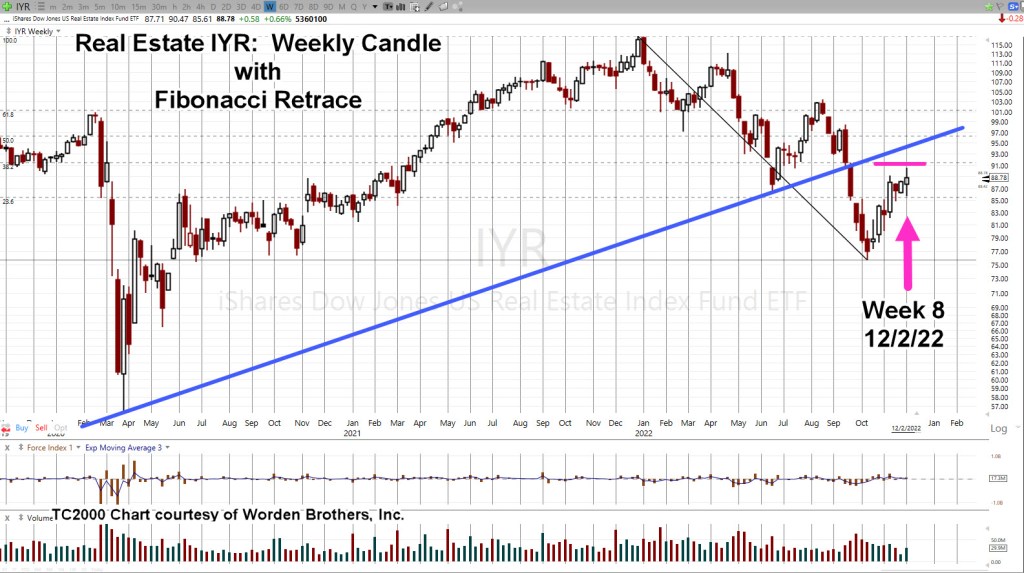
Real Estate IYR, Weekly
Let’s go back to the IYR, update from late October.
It showed the most probable direction; a move higher into a test, giving both the location, and the date.
Fast forward, to now:
We’re right at 38.2%, retrace and on time with Fibonacci Week-8, from the lows.
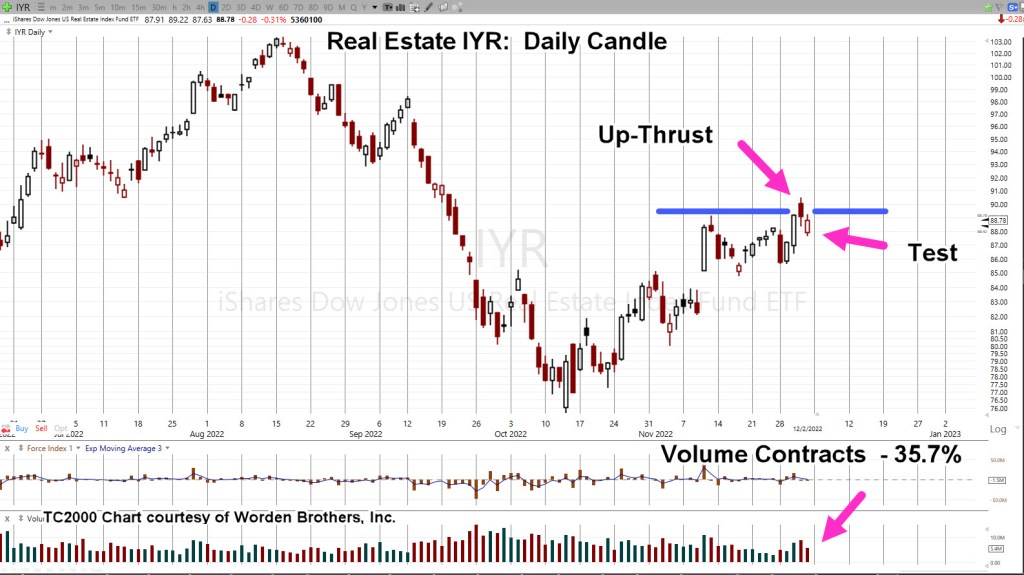
The daily chart shows a possible up-thrust (reversal) and test … the very same day that Goldman ‘gives-up’.
Real Estate IYR, Daily
Not shown on the daily; from the lows, October 13th, to the (print) high, December 1st, is a Fibonacci 34 (+1) Days.
Volume increased on the reversal bar December 1st, and then contracted on the upward test the next day … pointing probabilities to the downside.
Printing a new daily low at the next session, will help confirm the reversal.
Summary
Let’s see what happens next.
The Goldman report may be contrary indicator; telling us the ‘professionals’ are throwing in the towel, changing their approach right at a potential top.
Positioning
Not advice, not a recommendation.
LABD-22-13: Closed
It’s become apparent from this article; the truth, that was counted on as a tail-wind (for a short position) is not going to come out anytime soon.
Those that know, already know.
Moving on to other markets (below) that will be affected by the consequences of biotech.
DRV-22-06:
Short real estate IYR, via DRV (not advice, not recommendation)
Note: Posts on this site are for education purposes only. They provide one firm’s insight on the markets. Not investment advice. See additional disclaimer here.