It’s been a while since we’ve talked about the chief cook and bottle washer in this whole financial collapse scenario.
However, biotech has not been forgotten.
There are two indices (ETFs) being tracked: IBB and SPBIO.
Both entered bear market territory long ago. SPBIO topped out, way back in February 2021; IBB topped later, in August the same year.
Leveraged inverse funds are LABD, and BIS, respectively. LABD is 3X inverse with BIS a 2X inverse.
The Long Term
One thing unique to David Wies, was to look at the long term: Monthly, Quarterly and Yearly charts.
Doing so, puts one in a strategic mindset … not easily swayed by the latest prattle from media sources.
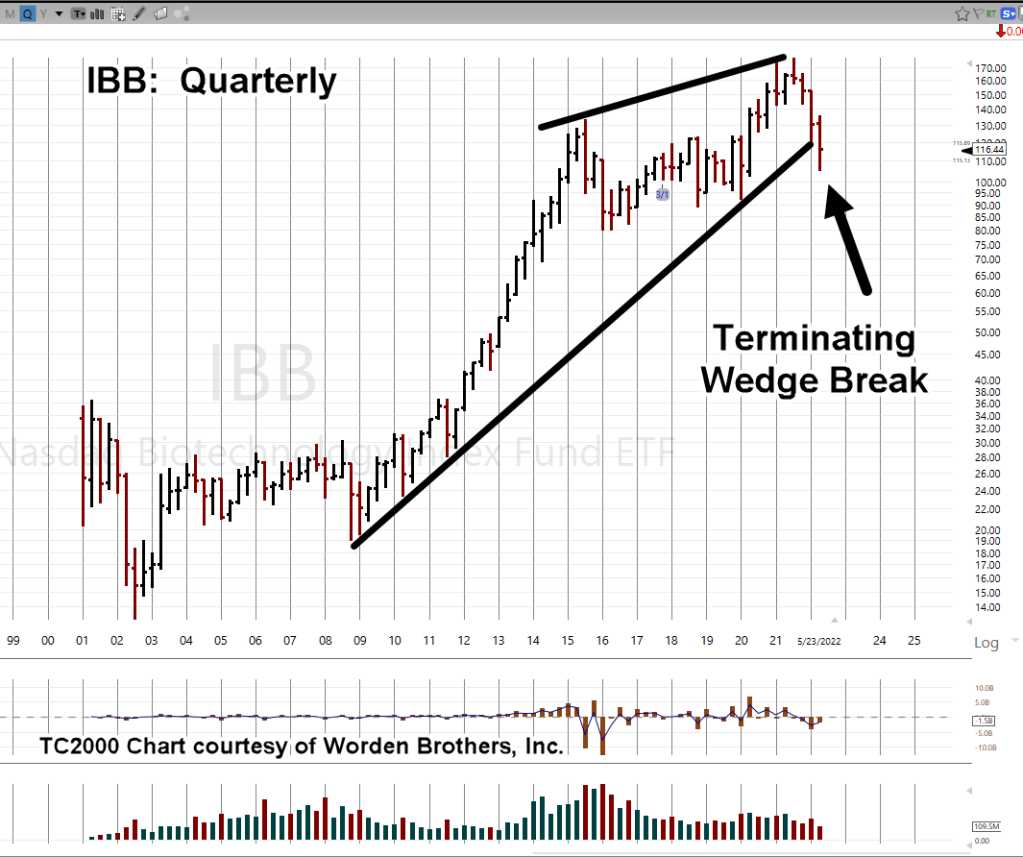
If we look at biotech, IBB, on a quarterly basis we have the following chart.
Biotech IBB, Quarterly
The mark-up of this chart is where it gets interesting.
A terminating wedge that’s been over seven years in the making has just broken to the downside.
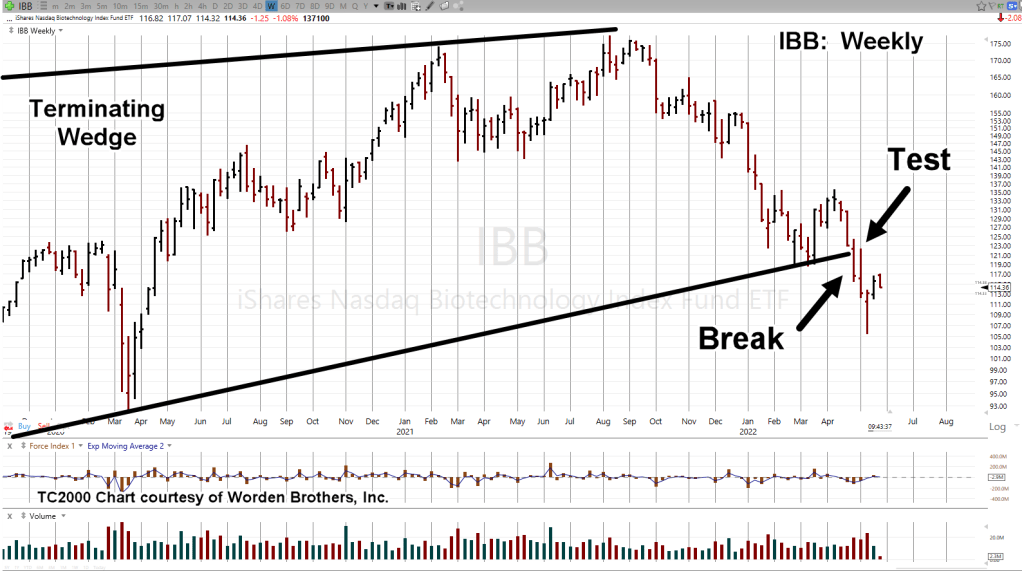
Not only that, when we get closer-in (on the weekly), we can see the wedge break has been tested and now today, appears to be reversing to the downside (shown on daily).
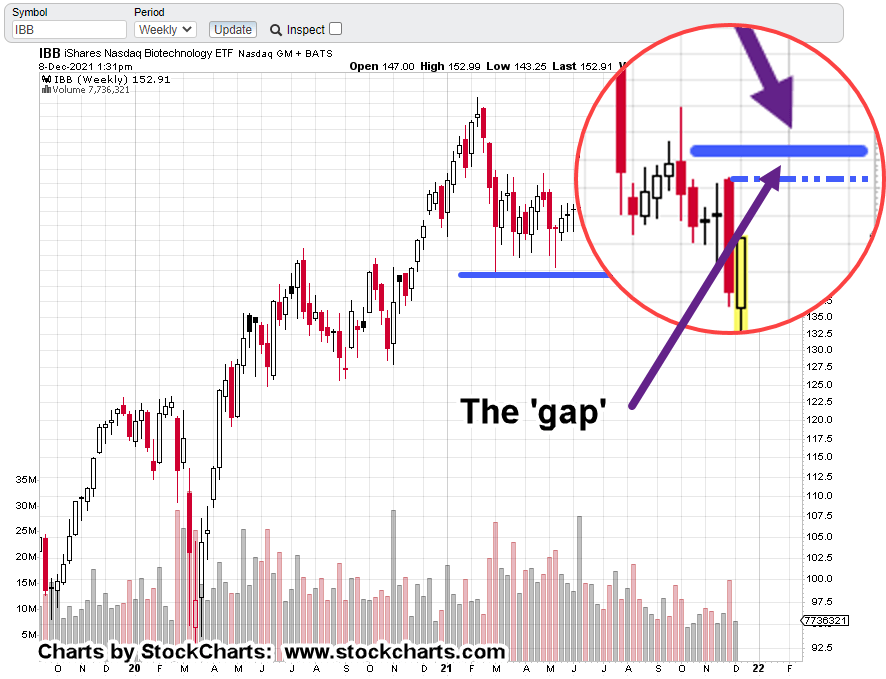
Biotech IBB, Weekly
With zoom
The daily shows a Fibonacci retrace to 38%; then today, a downside reversal.
You can see where this is going.
Based on the above analysis a short position in IBB, has been opened via BIS (not advice, not a recommendation).
The trade is BIS-22-01, with an (initial) entry @ 28.5173
Summary
The news on specific biotech companies is already out if one knows where to look.
Stated time and again on this site, we’re just in the beginning stages of the repercussions.
It even looks like they’ve moved on from the initial scam and are cooking up a new one.
Note: Posts on this site are for education purposes only. They provide one firm’s insight on the markets. Not investment advice. See additional disclaimer here.
That’s it in a nutshell. What happened last time, won’t happen this time.
The market reveals its own secrets; you just have to know where to look.
An entire industry has been (purposely) built to make sure the ‘average investor’ never finds the truth of the markets.
That industry is the financial analysis industry; the one with the P/E ratios, Debt-to-Equity, and so on.
Sure, it was a tongue-in-cheek post to use the fact that Carvana had no P/E (linked here).
I’m not certain if they ever had a P/E; probably not.
However, that financial, i.e., fundamental(s) fact, did not keep the stock from going up over 4,529%, in four years.
It should be noted, the Carvana analysis was done on a Saturday (as has this one). At the very next trading session, CVNA posted lower, started its decline in earnest and never looked back.
Not saying that exact thing (timing it to the day) will happen with our next candidate real estate; as said before, part of Wyckoff analysis (a lot of it, actually) is straight-up intuition.
The good part from a computer manipulated and controlled market perspective, intuition can’t be quantified.
So, that’s your edge.
Let’s move on to ‘last time is not this time’ and see what the real estate market IYR, is telling us.
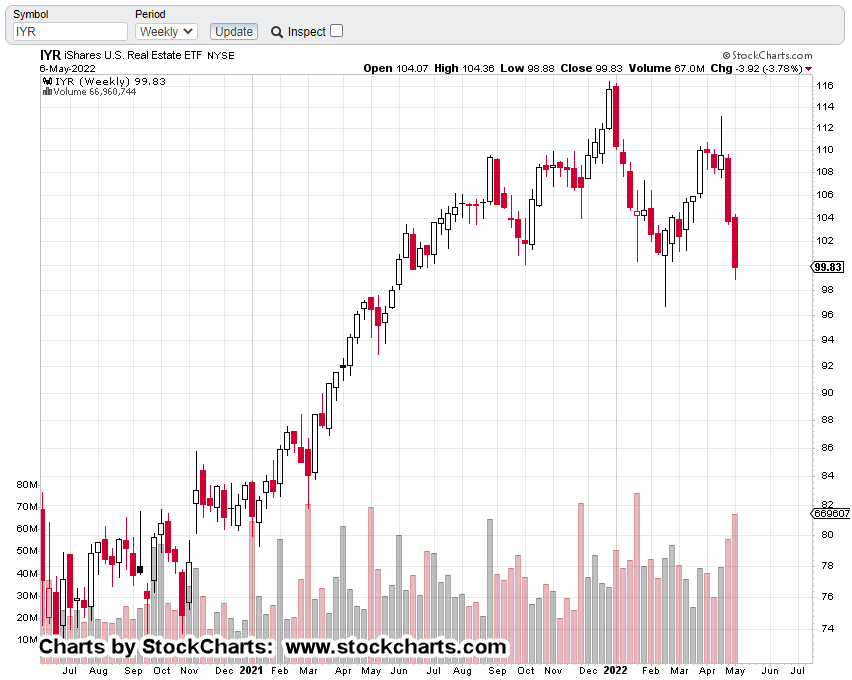
Weekly Chart, IYR
We’ve got the weekly un-marked chart of IYR, below.
The ‘alternation’ is there.
Here it is, close-up.
The first leg lower had some initial smoothness but quickly became choppy and overlapping.
Not so, now.
We’re essentially heading straight down.
Fundamentals
From a fundamental standpoint, real estate is finished. However, it’s been finished for a long time.
The fundamentals won’t and can’t tell anyone what’s likely to happen at the next trading session … or any other session.
The market itself (shown above) is saying the probabilities are for a continued decline; posting smooth long bars until some meaningful demand is encountered.
As shown on the last post, if the trading channel is in-effect, that (chart) demand is a long way down.
Positioning
Shorting IYR via DRV, has been covered in previous posts (search for DRV-22-02).
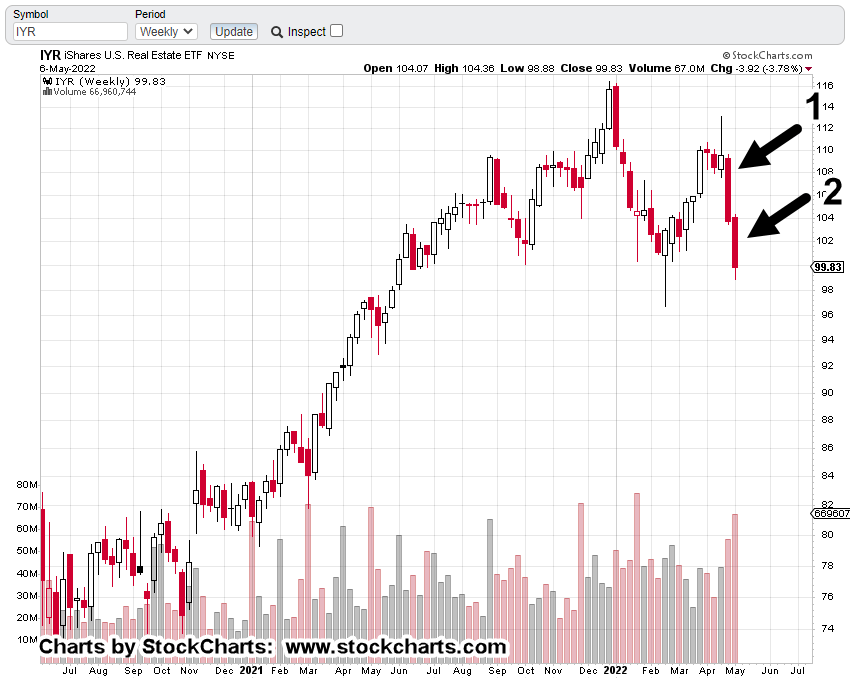
The following weekly chart, is marked up with two arrows.
Arrow No. 1
Initial short position via DRV was opened late in the day on April 28th; the day before the market broke significantly lower (not advice, not a recommendation).
Arrow No. 2
As the market headed lower during the week just ended, the size of the DRV position was increased by 36%.
Currently, the gain on the total position is about +22%.
At this juncture, the DRV stop is located well in the green in the unlikely event we get a sharp IYR, upward move in the coming week.
Summary
Under ‘normal’ conditions one could expect some kind of upward bounce in the days ahead.
However, as shown already with big cap leader PLD, the situation’s anything but normal.
Highlighted in earlier posts, biotech is leading the way with SPBIO, currently down – 59.8%, from its highs.
Biotech IBB, with chief cook and (globalist) bottle washer Moderna (MRNA), is down – 36.2%.
As Dan from i-Allegedly has stated time and again, we’re already in a depression.
Note: Posts on this site are for education purposes only. They provide one firm’s insight on the markets. Not investment advice. See additional disclaimer here.
Note: Posts on this site are for education purposes only. They provide one firm’s insight on the markets. Not investment advice. See additional disclaimer here.
Note: Posts on this site are for education purposes only. They provide one firm’s insight on the markets. Not investment advice. See additional disclaimer here.
This just out from ZeroHedge, linked here, shows the ‘elephant’ has begun to go mainstream.
Another chess-move.
At least one previous post (No.1, linked here), has shown the phenomenon is not a one-off event.
Now, according to the link above, there’s an estimated 300,000 affected … and we’re just getting started.
Insiders Sell … Retail Buys
Do those at the highest levels know their customer base is about to evaporate on a world-wide basis?
While they may not know every detail, they at least know something’s up. Steven Van Metre discusses the insider selling in his latest update, linked here.
Front End Phenomenon
We’re still at the beginning stages of an event that in the opinion of this author, is going to last the lifetime of those reading this post.
‘Hyperbolic statement’ one might say.
To that, I would counter with this; when it was posted, the ‘elephant’ was hyperbolic as well.
Now? Not so much.
Keeping that long range thinking in mind also keeps one from choosing the ‘insane’ human behaviors discussed by Dan (I Allegedly) in his latest post.
So, let’s take a look at what type of insanity we have going on in the markets today.
Of course, that points us to our chief cook and bottle washer, biotech (IBB).
Biotech, IBB
When we last left our hero, savior, and protector of all that is natural immunity, the biotech discussion was on Moderna (MRNA).
The thrust higher, detailed in this post was thought to be too fast for a sustained reversal. Well, it was right and wrong at the same time.
Moderna wound up reversing … sort of.
At the same time, the biotech sector headed lower to support and is now moving higher.
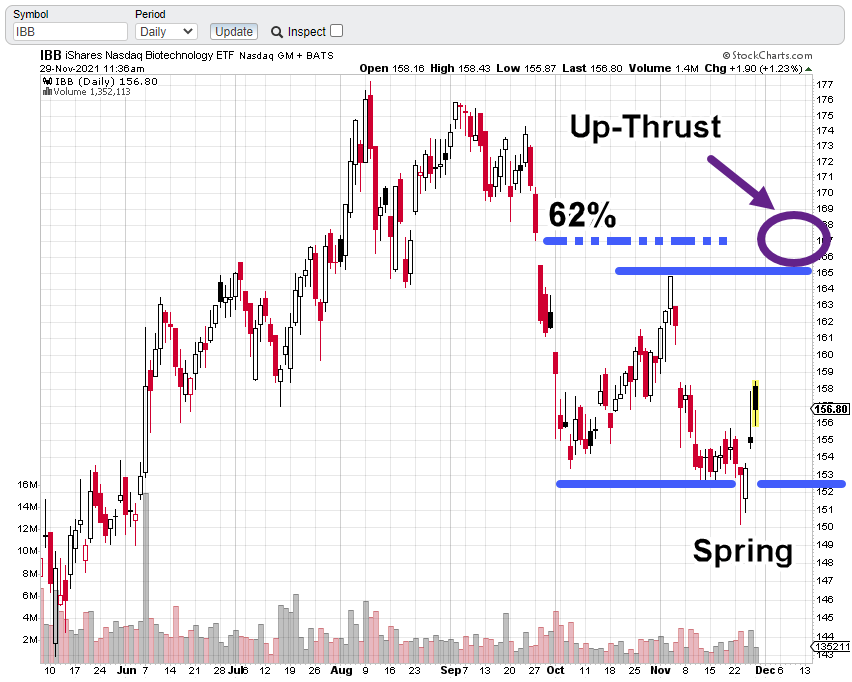
The weekly IBB, chart has the support (lower blue line) and potential up-thrust location (also 50%, retrace) identified.
The zoom shows the narrow gap between the weekly bars and 50% retrace.
If price action makes it past the resistance bars and into the gap, IBB would then be in up-thrust position (not advice, not a recommendation).
Note: Posts on this site are for education purposes only. They provide one firm’s insight on the markets. Not investment advice. See additional disclaimer here.
Note: Posts on this site are for education purposes only. They provide one firm’s insight on the markets. Not investment advice. See additional disclaimer here.
The ‘Epsilon’ variant (from the idiot in Brave New World) is probably being saved for last … because if anyone’s still believing the hype by that time, it won’t matter … they’ll be fully ‘boosted’.
That doesn’t mean the pros can’t make money off the herd … while there still is a herd.
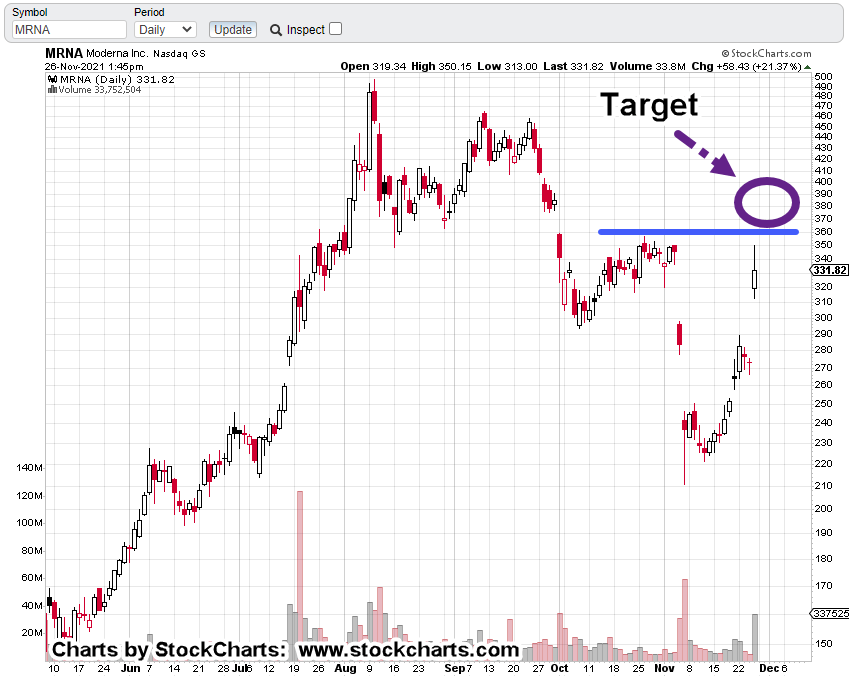
Which brings us to today’s underside test action of MRNA.
It’s true that price action is testing the underside.
However, if we go to the daily chart (below), we can see if price action can make it just a bit higher … to the 360 – 380 area, then we have an up-thrust (potential reversal) condition.
Note: Posts on this site are for education purposes only. They provide one firm’s insight on the markets. Not investment advice. See additional disclaimer here.
For now, we’ll discuss only the technical aspects.
We’ll leave the rest of the truth for mainstream news.
Discussed previously, the sector (SPBIO) was left with our assessment that it may reverse higher into a retrace; combined with an up-thrust/reversal.
That was then.
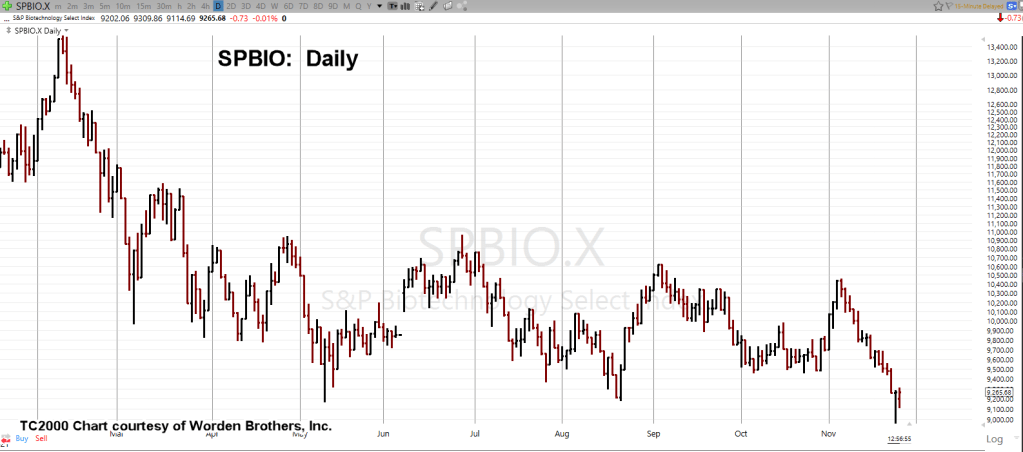
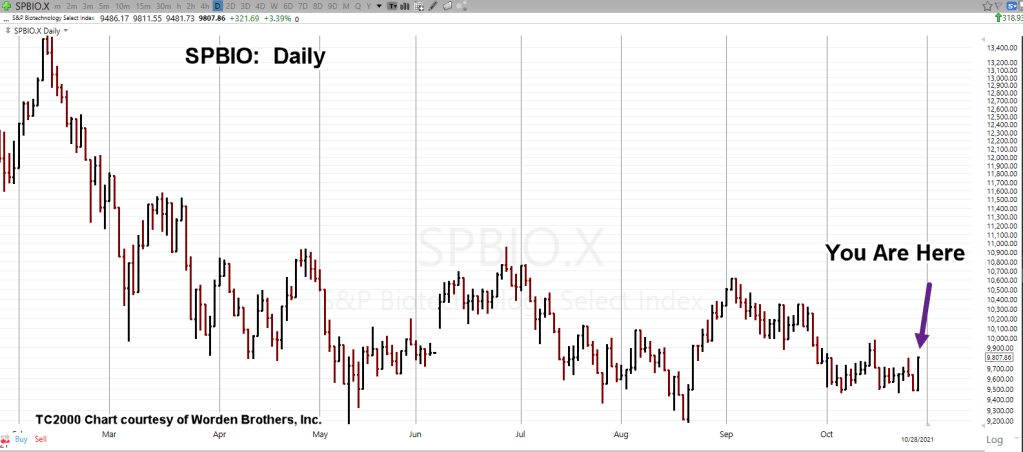
Biotech, SPBIO, Now:
Daily un-marked chart of SPBIO:
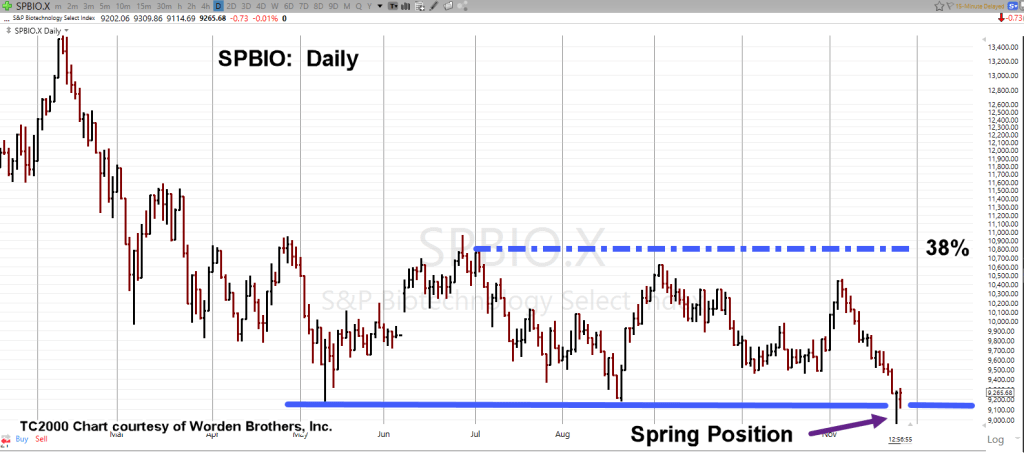
Below, a marked-up chart showing penetration and move off support (Spring Condition).
Included, is the 38% retrace level … location for potential test and reversal:
As with the on-going reversal in gold (GLD) and the miners, GDX, GDXJ, we’ll have to see how this plays out.
Unfortunately, as we head into what used to be the regular flu season, those who received ‘protection’, are going to find out they’re not protected at all.
Stay Tuned
Note: Posts on this site are for education purposes only. They provide one firm’s insight on the markets. Not investment advice. See additional disclaimer here.
Will Demand Collapse Faster Than Supply Contracts ?
Is There A Biotech Connection ?
The Next Chess Move
Everyone’s good at telling you what the problem is; it’s a financial collapse !!!
No, Duh!
The hard part is, how to position for the unknown at least for those of us in the serfdom.
The so-called elites, the oligarchs know (or think they know) exactly what’s happening.
They move their chess players and we move ours. The goal is to position for (potential) profit with the caveat we all make it out on the other side.
Personal Anecdote (skip to XOP Analysis if not interested):
I have a close family member that’s been a school teacher for about twenty years. He/She is well known in the local town and has a significant number of connections.
Because the children being taught are typically small, ranging from kindergarten to fourth grade, those kids tend to reveal all that’s happening at home.
Their revelations include financial status (or lack of), political leanings as well as abuse that’s happening physically and sexually. It’s the real deal.
As an aside, any potential crimes are fully documented and reported.
The point here is, this contact has revealed that children, family members and extended family members are severely ill or dropping dead after receiving an ‘injection’.
However, the surviving family members are just too stupid (or afraid) to put it together; the injections are causing the deaths.
It’s some kind of mental block and/or mass hypnosis.
It’s wrenching and heartbreaking.
However, at the same time and this is where it gets harsh, for those of us in the faith, we know Biblical scripture tells us the Lord delights in hiding the truth.
One has to diligently seek out truth. It takes work and a prayerful form of neural plasticity; the ability to be mentally flexible.
Truth is not for the lazy, the incompetent, the coward.
Why should immutable truth come to a coward or idiot that does not diligently seek it?
New ‘Variant’:
The rapidly increasing deaths may be passed off by the mainstream media as some kind of new ‘variant’.
That ‘variant’ brings us to the market at hand; oil and oil exploration XOP and possible biotech connection.
XOP Analysis:
As with biotech SPBIO, and its leveraged inverse fund LABD, so too we have Oil & Gas Exploration XOP, and leveraged inverse fund DUG.
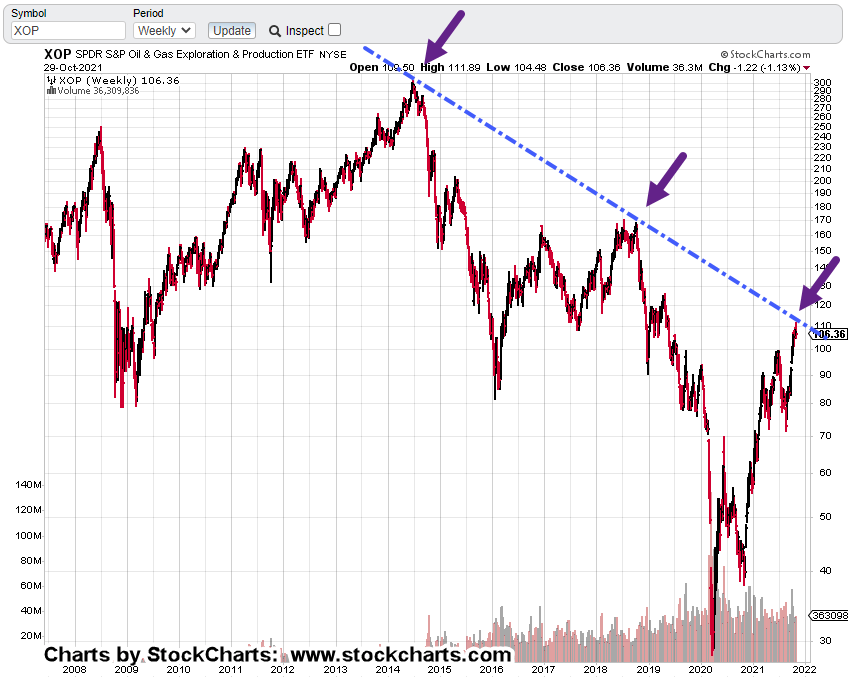
The long term un-marked, weekly chart of XOP:
Next, we have price action contacting a multi-year trendline:
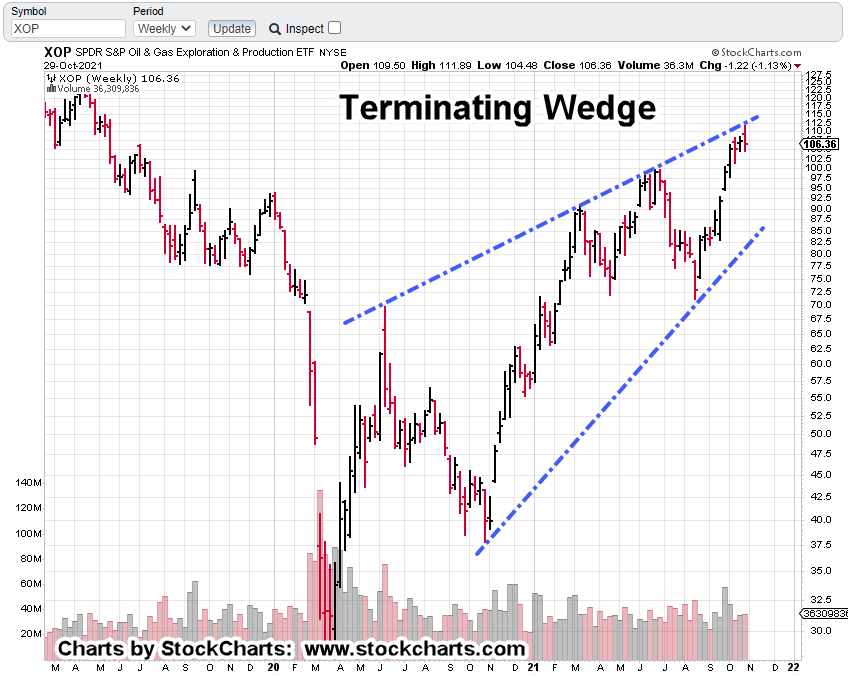
Moving closer on the weekly, we have a terminating wedge:
Terminating wedge(s) typically result in price action moving opposite of wedge formation.
In the case above, that would be a reversal to the downside.
This past week’s bar was a reversal. It’s a potential signal the formation is complete and XOP is ready for the downside.
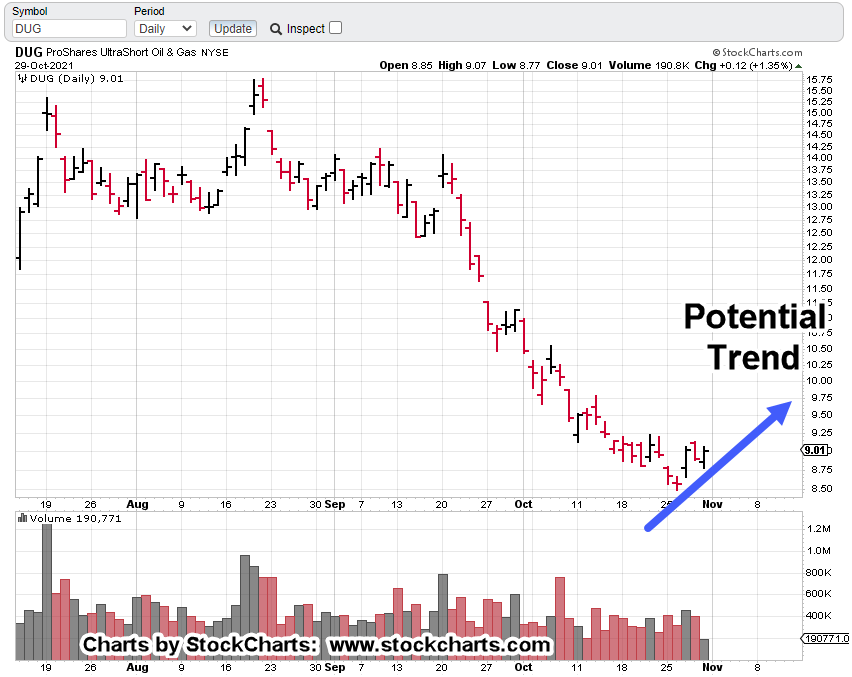
Of course, if XOP is about to head lower, inverse DUG is about to head higher (not advice, not a recommendation).
Daily chart of DUG.
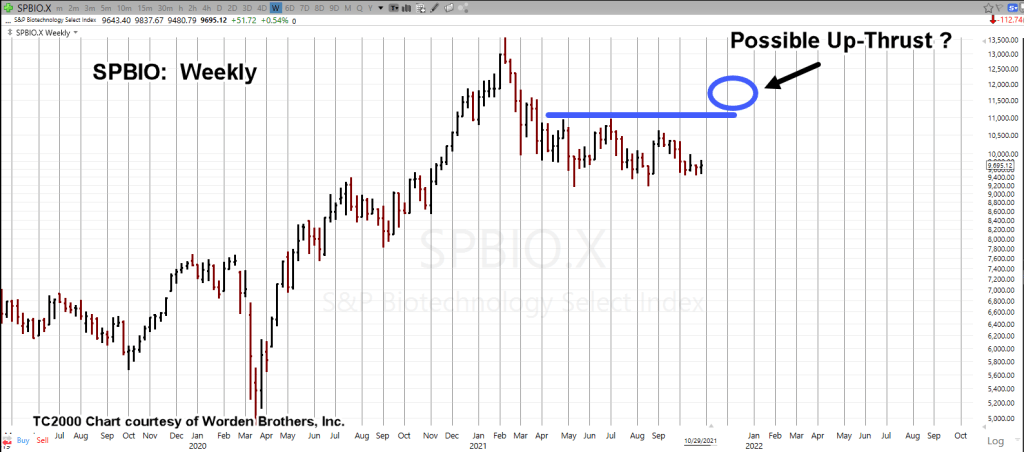
The Biotech (SPBIO) Connection:
The weekly chart of SPBIO, shows momentum on downward thrusts has slowed. The black dashed arrow’s trajectory is becoming more shallow:
If biotech is going to retrace, the solid blue line is a Fibonacci 38%, as well as potential location for an up-thrust (downside reversal).
A new variant (which is likely injection injury) may be used by the media to drive biotech higher to the retrace level.
We’ll have to wait and see if there’s a reduction of the population as we head into the end of the year. It’s a known fact, the injection destroys the immune system … so far, permanently.
That would be a factor in the up-coming flu season.
Remember that?
We used to have a regular flu season … but that all disappeared (re-branded, actually) with our current situation.
Summary:
Nearly all recessions have started with rising oil prices.
However, we’re not in a recession but an all out collapse. The economy is contracting at the fastest rate in U.S. history.
Our current position is demand will collapse faster than supply restriction (not advice, not a recommendation).
Or, we could still have rising oil prices but it won’t be enough to offset the cost of drilling and production; lack of demand may be overwhelming.
Note: Posts on this site are for education purposes only. They provide one firm’s insight on the markets. Not investment advice. See additional disclaimer here.
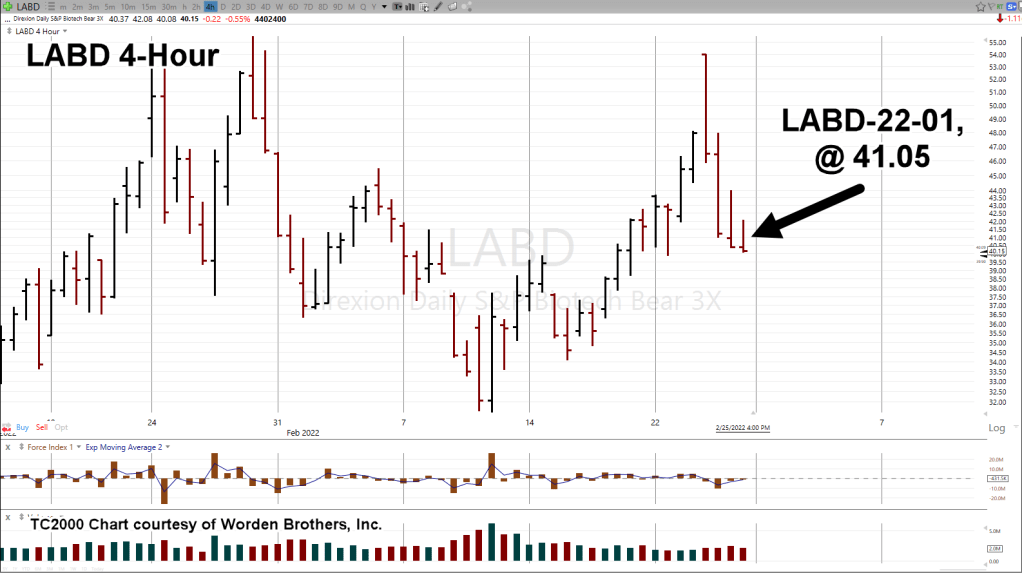
The daily chart above, shows our current location.
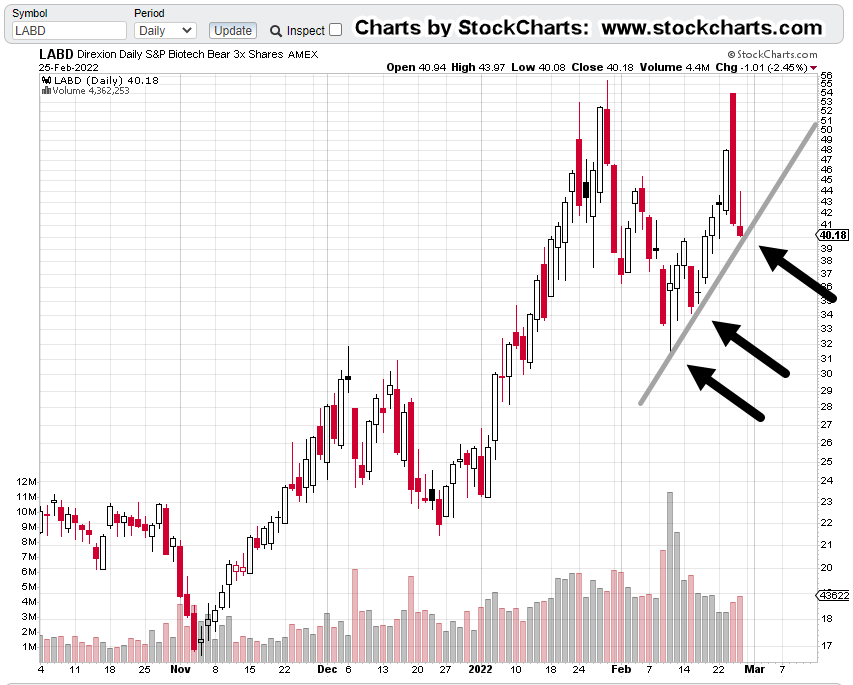
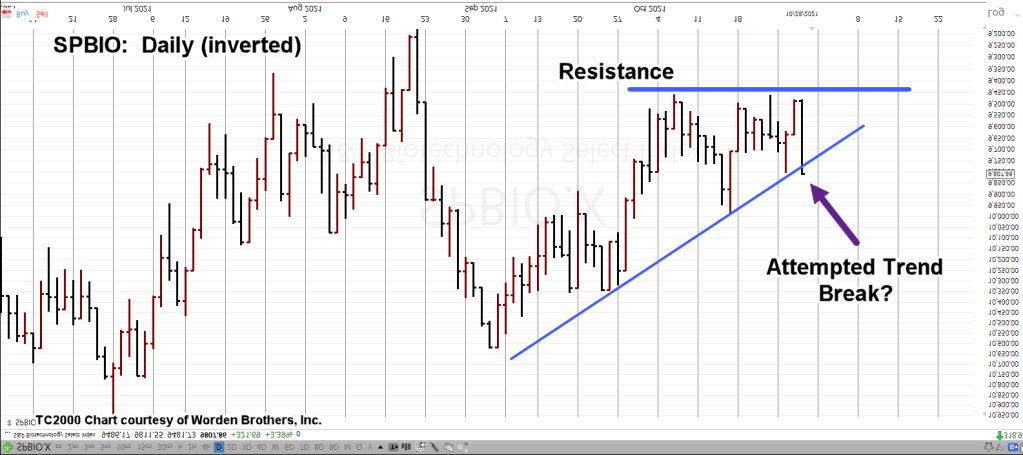
Inverting the chart and expanding the price action gives us the following:
Was today an attempt to break the up-trend (down-trend, non-inverted)?
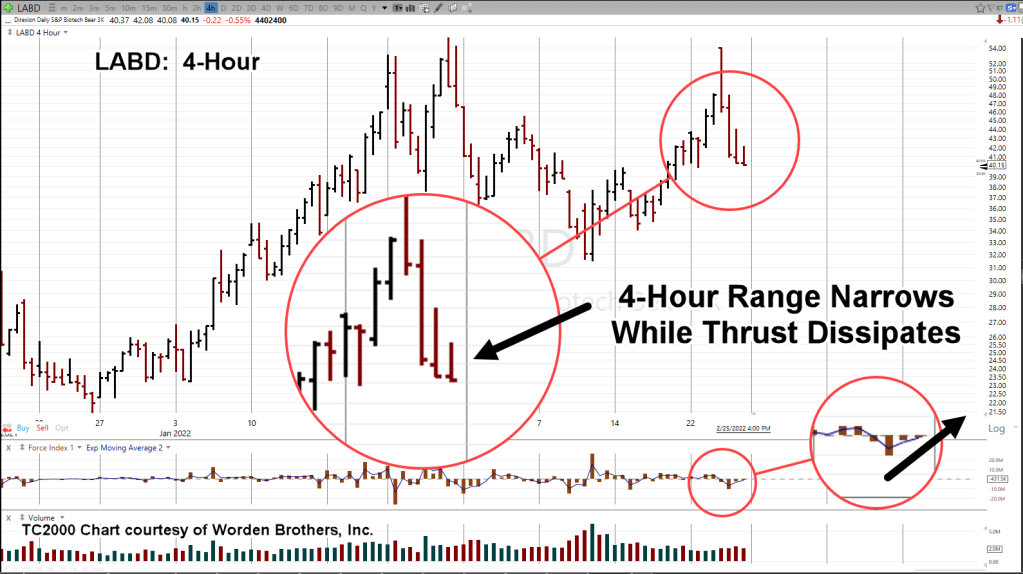
Wyckoff called this type of sharp adverse move ‘threatening action’.
You won’t know if the market’s going to carry out the threat until the next session or subsequent sessions.
Positioning:
My firm’s (core) short position remains unchanged (not advice, not a recommendation).
However, the main account holding of LABD, was reduced by approximately 2.9%, during this session to adjust for margin requirements.
It’s important to note, the after hours session is already trading about 1% higher (for inverse LABD); a typical occurrence when the day’s move was a shakeout.
We’ll see if that action carries over to the regular session tomorrow.
Stay Tuned
Note: Posts on this site are for education purposes only. They provide one firm’s insight on the markets. Not investment advice. See additional disclaimer here.