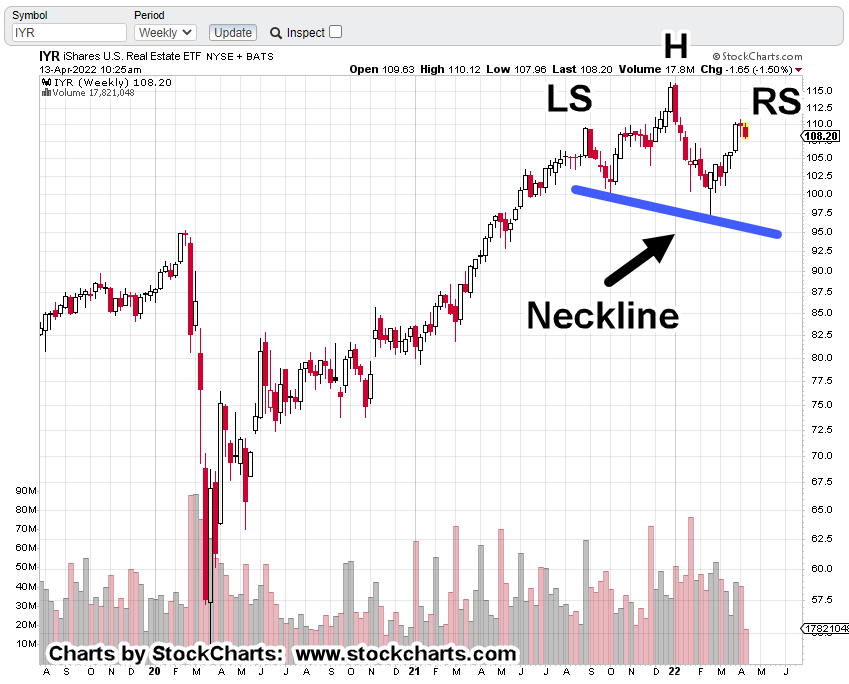
The Head & Shoulders pattern on the weekly chart of IYR, could mean reversal ahead.
Price action’s been attempting to move higher over the past twelve trading days.
‘Attempting’, because it’s not making any significant net progress.
Essentially, we’ve got what’s called ‘evidence of a struggle’ where the bulls may be exhausting themselves.
The last update on bonds (TLT), said they’re at the danger point where an upside reversal was possible.
That update also said:
“At this juncture, there’s either a reversal and much higher levels or down, with rates higher; in turn, leading to the subsequent collapse of real-estate, a-la 2007 – 2008.“
Since then, bonds are lower, rates higher. Housing affordability has collapsed.
Real Estate, IYR, Weekly
At this point it’s a clear H&S, pattern.
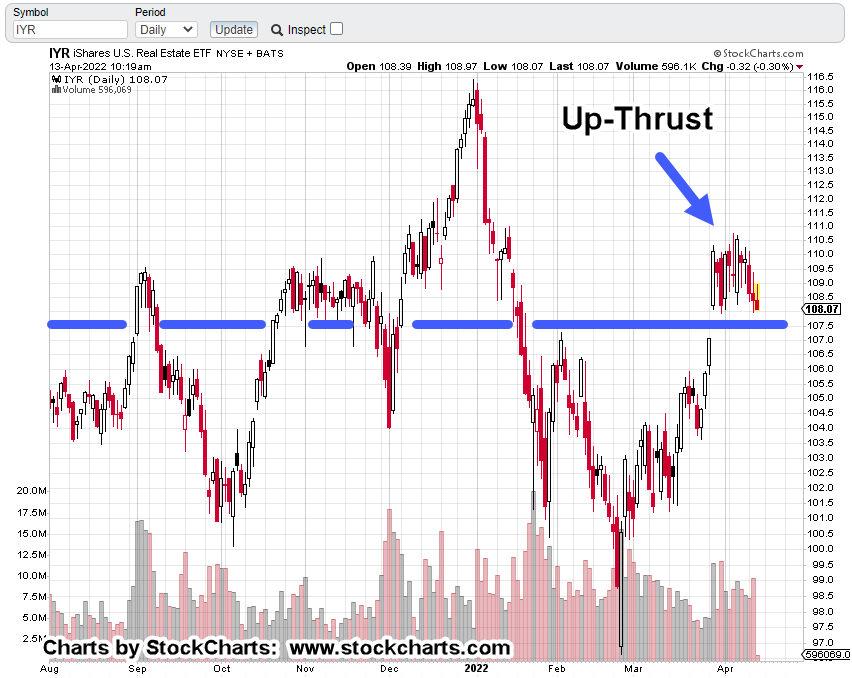
The daily chart shows IYR, oscillating around an axis, support/resistance line; struggling to move higher (in up-thrust condition) with no real progress.
As with bonds in the April 3rd, update, we’re at the danger point with IYR.
A decisive move below the axis (blue) line would indicate the bulls may be exhausted.
Because price action’s been in this range for over two weeks, lends support to the possibility any breakdown (or breakout higher), may be a sustained, directional move.
Note: Posts on this site are for education purposes only. They provide one firm’s insight on the markets. Not investment advice. See additional disclaimer here.
Bonds are at the danger point; poised for upside reversal.
Upside?
Bonds up, rates down, is that even possible?
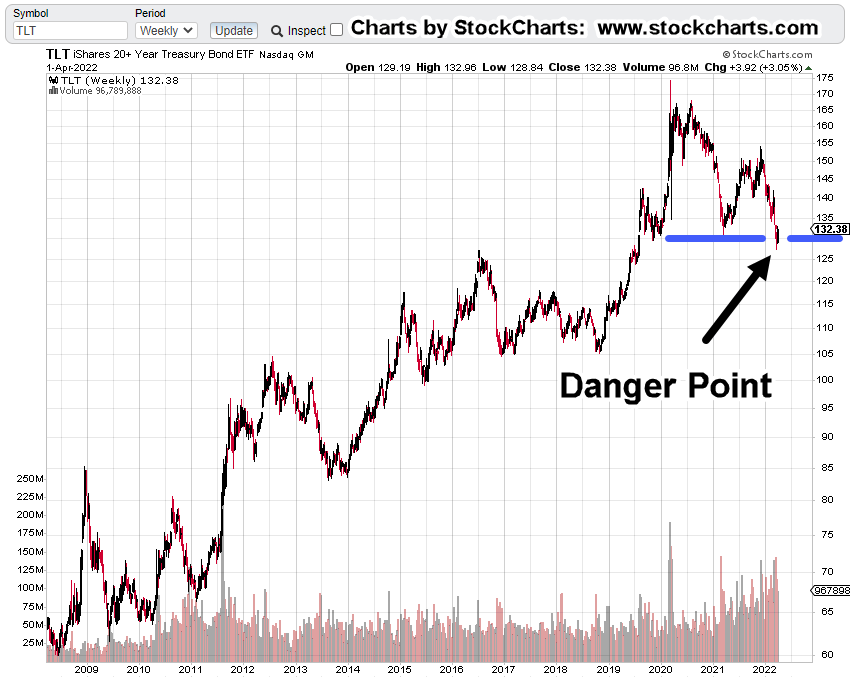
The weekly chart of long bond proxy TLT, is below. It’s not called ‘the danger point’ for nothing.
Weekly, TLT
The danger point is not the top or bottom of a move.
It’s the area where risk is least for either direction. Where the cost of being wrong is reduced as much as possible.
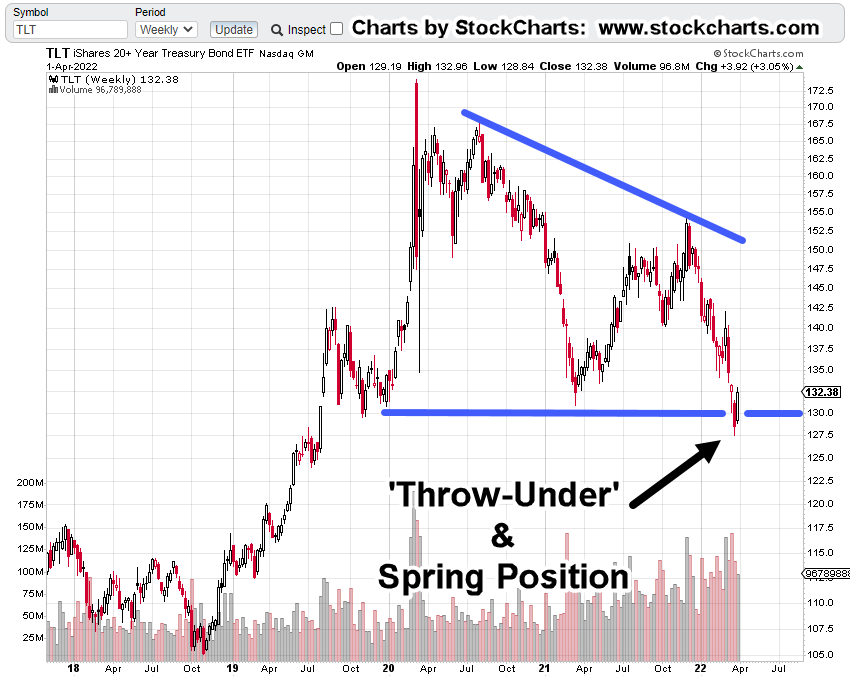
Getting closer-in on the weekly, price action has penetrated support (blue line) and has stopped-dead, so far.
Note the bullish divergence in MACD and MACD lines. It’s not a strong divergence but it’s there.
Next, we have a (bullish) wedge pattern. It’s a big one that took over a year to post.
The False Narrative
If one is serious about their work in the markets, eventually there’s a realization, every narrative is false. The media serves the purpose of the owners and nothing else.
They’re under no obligation to print (or broadcast) anything near the truth, going whole-hog on that ‘freedom’ and fleecing the public at will.
Using that premise, we can say the ‘inflation’ narrative is false or at least twisted; partially true.
The Bond Sell-Off
With incessant dollar ‘collapse’, dollar ‘end of the road’, inflation ‘rampant’, yada-yada, day after day, it’s no wonder bonds have sold off.
At this juncture, there’s either a reversal and much higher levels or down, with rates higher; in turn, leading to the subsequent collapse of real-estate, a-la 2007 – 2008.
Summary
Would I personally be a bond buyer at this point … no. I’m not keen on buying the debt, any debt of a bankrupt nation (not advice, not a recommendation).
It’s important to note, if bonds do rally, the catalyst may be a perverse ‘flight to safety’ on the public’s part resulting from significant downside in the overall markets.
Note: Posts on this site are for education purposes only. They provide one firm’s insight on the markets. Not investment advice. See additional disclaimer here.
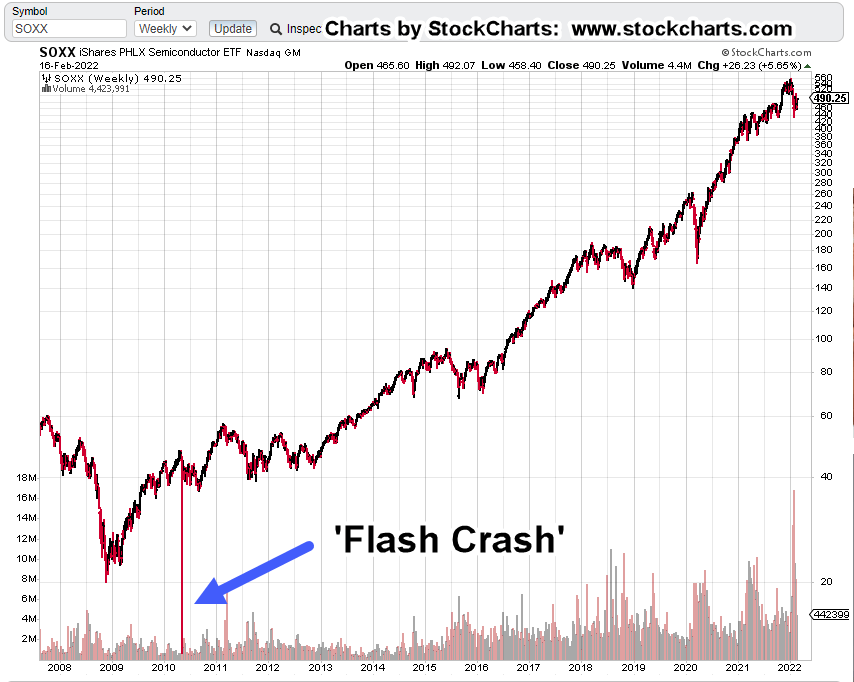
It’s been long enough; most have forgotten the ‘Flash Crash‘ of 2010.
That crash happened in May of that year.
May of this year, would make it 12-years and interestingly, a Fibonacci 144, months.
Normalcy Bias:
As Nissam Taleb said in his book, ‘The Black Swan’, every day is like every other day on the farm, for Mr. Turkey … that is, until Thanksgiving Day.
Let’s take a look at the historical chart of Semiconductor ETF SOXX, and see the effect of a Flash Crash.
Easy to spot … prices did recover by the end of the day.
What about the next time?
This report just out on ZeroHedge, shows liquidity is drying up in the bond market. Actually, liquidity has been drying up ever since Dodd-Frank of 2010.
All of this is working (to increase risk) in the background.
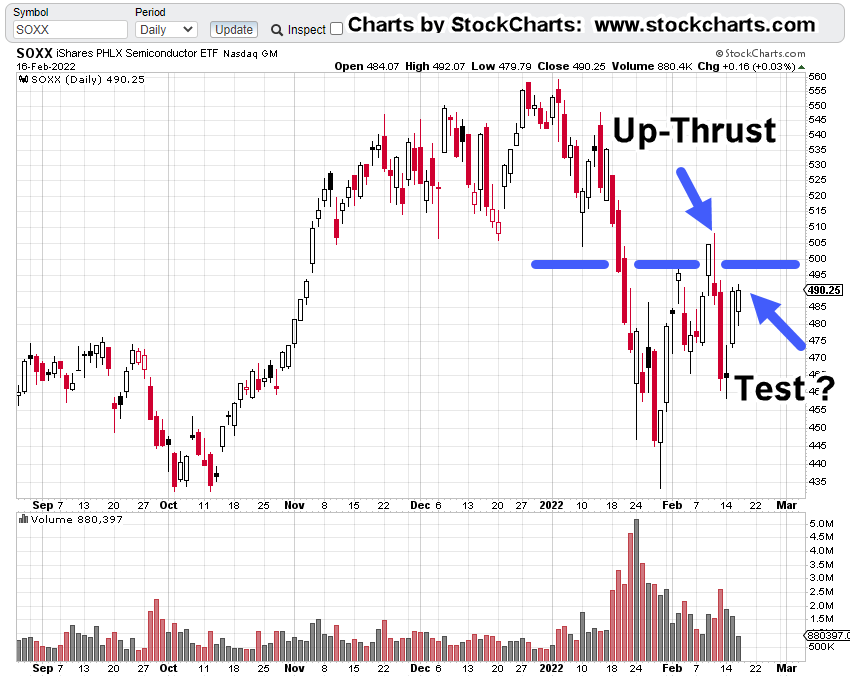
Let’s take a look at another unprecedented event … the downthrust and apparent recovery in the semiconductor index, SOXX.
SOXX, ETF, Daily Chart
First up, is the unmarked chart of the index.
Next, we’ll show the recovery higher is on diminishing volume.
There’s no real commitment to the higher prices …. they are just drifting upward.
We’ve already shown the Elliott Wave assessment of the current structure. Now, let’s look at it from a Wyckoff standpoint; Up-Thrust and Test.
Price action posted an Up-Thrust, declined and now has come back for an apparent test.
Confirmation Bias
At this juncture, both Elliott Wave and Wyckoff Analysis present a price action structure that’s set for downside reversal.
In a way, we’re at the danger point for both methods.
Summary
From a personal and corporate standpoint, going long in this market and all markets for that matter, was abandoned long ago (not advice, not a recommendation).
To borrow a phrase from Dan at i-Allegedly, he repeats over and over in his videos, ‘We’ve had warning, after warning’.
So, we have.
The SOXX, is telling us, it’s ready to resume action to the downside. After-hours, already has the index trading lower.
Note: Posts on this site are for education purposes only. They provide one firm’s insight on the markets. Not investment advice. See additional disclaimer here.
The Danger Point®, trade mark: No. 6,505,279
p.s. The insight of 2010 Flash Crash, anniversary of Fibonacci 144 months in May of this year, is exclusive to this site.
This update proposed we’d get a penetration of support sometime around the upcoming Fed meeting on the 26th of this month.
However, today, TLT price action has moved lower, penetrated support and is resting just below those levels.
Long Bonds (TLT) Weekly
The Weekly chart shows price action hanging just below support levels (blue line).
TLT is at the danger point where risk of going long, is least (not advice, not a recommendation).
My firm has no interest in buying the debt of a bankrupt nation … any nation. So, we’ll stand aside on going long the TLT.
However, we can use this action as a proxy for the overall markets. That is, a strong TLT upside reversal may indicate downward acceleration in the major indices; S&P, Dow, QQQ and on.
Senior Miners, GDX
The daily chart of GDX has posted a new daily low.
This action helps to confirm that GDX remains in the downward trading channel, discussed here and is now continuing to move lower into that channel.
Positioning:
Remaining short GDX via DUST and increasing position size as the market allows (not advice, not a recommendaiton).
Note: Posts on this site are for education purposes only. They provide one firm’s insight on the markets. Not investment advice. See additional disclaimer here.
Hovering right at support, the long bond (TLT) is threatening to break through to the downside.
The usual suspects are out (here and here) pontificating about how many rate hikes there’ll be this year or how the Fed’s ‘not doing enough’ to combat inflation.
By now, anybody with two basis-points rubbing together should know, the Fed’s not going to do anything for anyone except itself.
If you’re reading this and have not separated from the nonsense, predictive programming, and mass-psychosis that is the financial press, feel free to do so now.
Not that one has to ignore them altogether.
It’s ok to monitor what they’re doing but ‘ol Zig Ziglar probably stated it best when he said (paraphrasing):
‘I read the Bible and the newspaper every day. That way I know what both sides are up to’. 🙂
Incorporating that worldview into one’s analysis is a healthier, more sane approach than trusting government statistics or mainstream propaganda.
Of course, one also has to be able to strategize and read price action. That’s the hard part.
So, let’s take a look at what bonds (TLT) are doing; then come up with a potential reversal (to the upside) scenario.
Asset Confiscation
Wait !!!
Bonds up and rates down? How is that possible. Aren’t interest rates going up in 2022?
Well, it could happen.
However, there’re several behind the scenes agendas at work; not the least of which is asset confiscation of the middle-class: “You will own nothing”, right?
This confiscation scheme has been planned for so long, it’s even got a name: Neo Feudalism.
If market participants and ‘investors’ find themselves in yet another wipe-out, they’re going to flock to the supposed ‘safety’ of U.S. bonds (just like they did last time).
Couple that with a few potato-head executive orders saying the market’s too dangerous for the proletariat; only bonds can be purchased and voila!!!
Long Bonds, TLT
Will that scenario above, play out in 2022?
Of course, that’s unknown until it actually happens.
However, what we do have as shown in the weekly chart of TLT, is a potential bear trap setting up.
Price action finished this past week hovering just at support. The range narrowed and the volume declined slightly … in effect, validating that support.
We’ve got an FOMC meeting coming up with the usual suspects issuing a propaganda statement at 2:00 p.m., EST on the 26th.
What To Watch:
Between now and then, bond price action could re-write the entire script just as it did with the gold market set-up.
Back then, the original gold (GLD) breakout idea was tabled only to have it show up again a few weeks later.
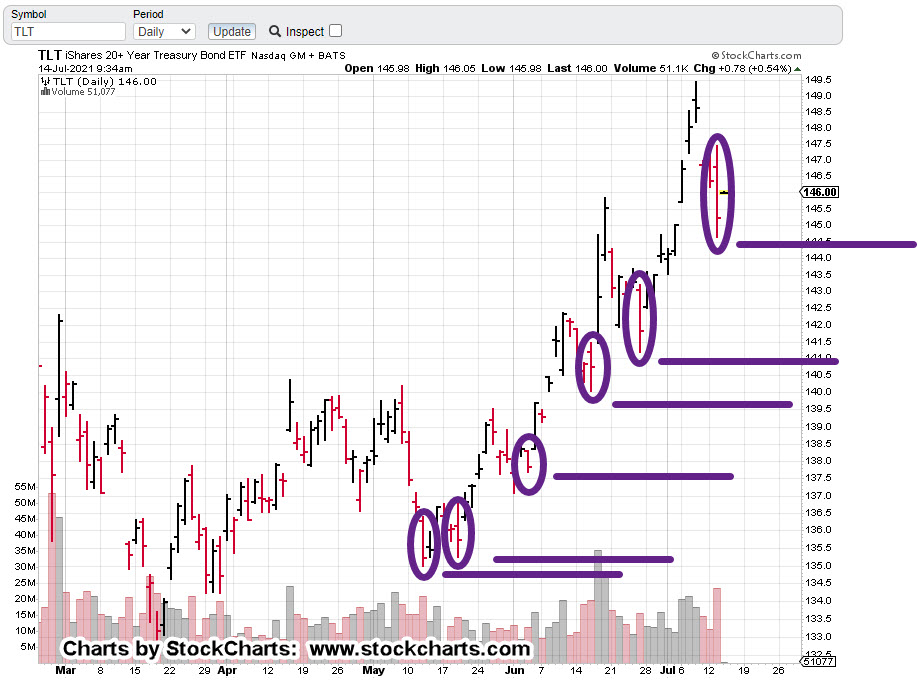
Note: Gold (GLD) broke to the upside exactly at the (purple) circled area shown:
Time and location, identified in advance.
Of course, the markets are a fluid and fractal mechanism. We’re dealing with probabilities and strategy, not pure (one answer only) mathematics.
Anything can happen.
However, given all the above discussion, the chart of TLT shown, has a reasonable potential to trap the bears in a bullish reversal if it penetrates support.
What’s the most likely time for this to happen?
Well, that would be on or about 2:00 p.m., EST, January 26th (absolutely not advice, not a recommendation).
Note: Posts on this site are for education purposes only. They provide one firm’s insight on the markets. Not investment advice. See additional disclaimer here.
With all the media press and hype, you would think bond yields have just spiked above 15%.
We have to remind ourselves that everything, that is, every move, every press release, every interview, is controlled.
Controlled for the purpose of “deception” as Livermore put it during an interview with Wyckoff in 1921.
With that in mind, who stands to benefit from the sharp move lower in bonds?
Seems like the obvious answer is, the short-term shorts and the longer-term bulls; especially if the hapless ‘hedge funds’ have jumped on the band wagon to short the market.
Bond (TLT) Analysis:
What Is The Market Saying About Itself?
The sharp move lower over the past four trading sessions, has likely cleared out the weak hands and emboldened the shorts to short some more.
The problem is (for the bears), we’re at a 50% retrace of the March 18th low. In addition, price action has just penetrated well known support.
That puts the bond market (TLT) in spring position.
We can see from today’s open, TLT is gap-higher and now, just below the support level.
We’re at the danger point, where the risk of going long is least (not advice, not a recommendation).
Because the four-day down-draft was so swift, don’t expect TLT to launch into an instant and sustained rally.
There may be quite a bit of testing (if and) before this market heads higher.
Note: Posts on this site are for education purposes only. They provide one firm’s insight on the markets. Not investment advice. See additional disclaimer here.
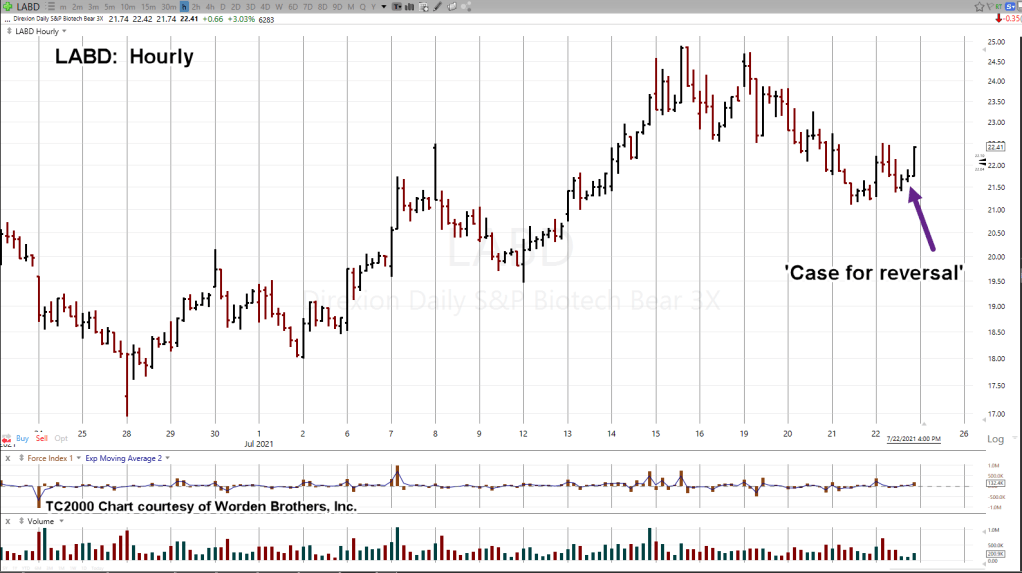
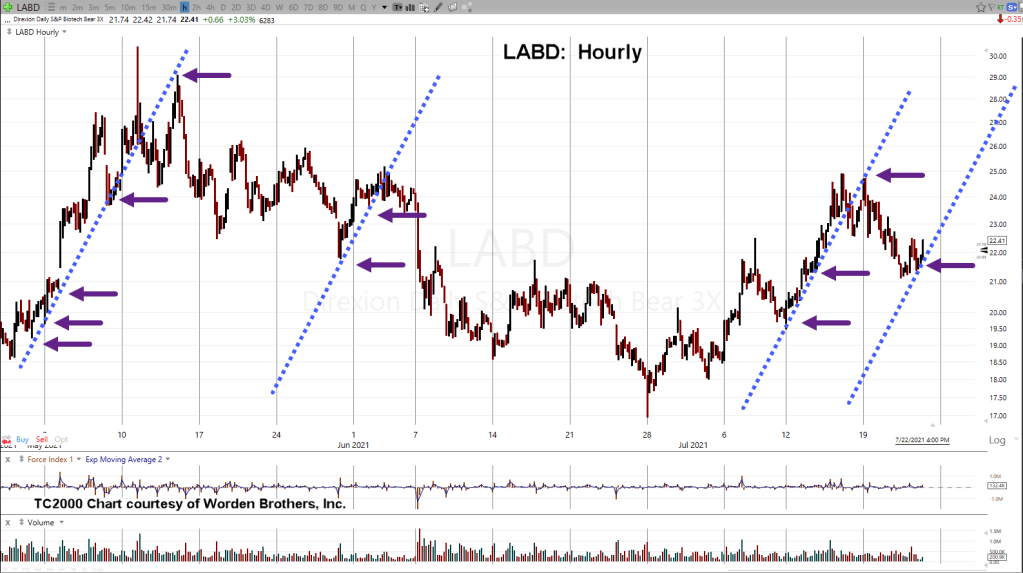
The unmarked hourly chart (above) of inverse fund LABD, shows the location of the last update.
That update called for LABD to reverse higher; based on thrust action of the market itself.
Soon after (magenta arrow), LABD pivoted higher.
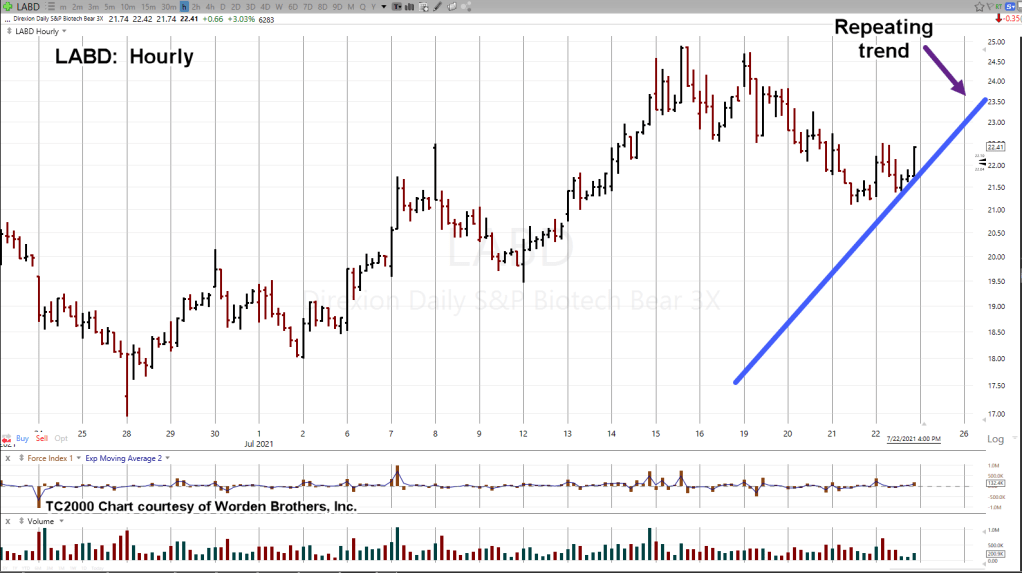
The right side action has a familiar repeating trend:
The chart below is a compressed version.
The repeating lines have been added. Arrows show contact points:
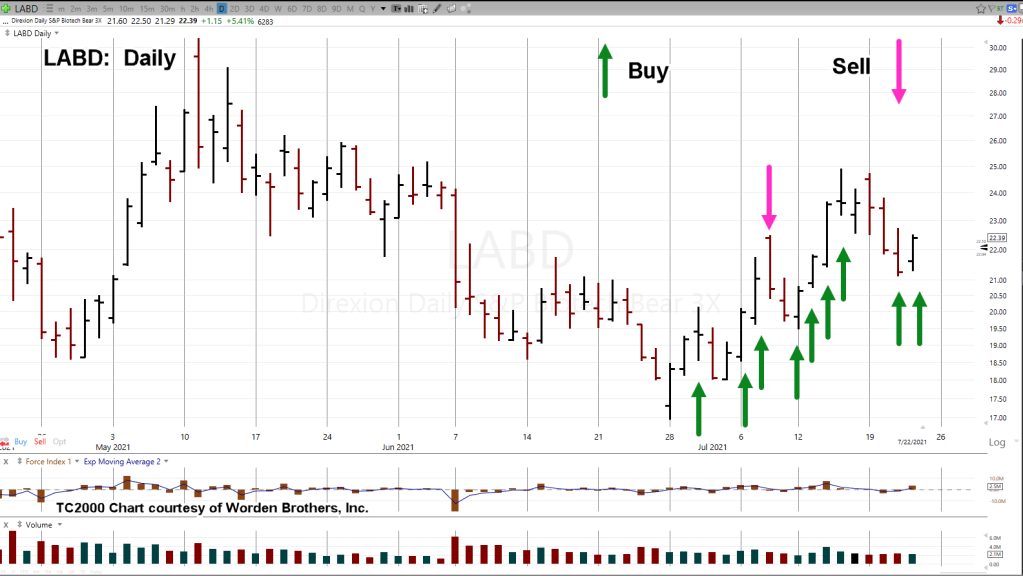
Strictly as a courtesy, daily chart of LABD is below with notations of buy and sell (not advice, not a recommendation) for my firm’s main account.
A good many that monitor this site have probably become bored with biotech … just as they did with Steven Van Metre’s analysis of bonds (back at the lows).
Van Metre is providing an excellent service. True, he probably has people moving their accounts to him. He’s running a business after all.
However, that does not negate the fact, he’s one of, if not the only one saying that we’re about to enter a deflationary environment (if not just temporally); complete opposite the conformist (and media led) crowd of hyper-inflationists.
Even Johnny Bravo has said, ‘hyper-inflation will come … but when?’
Summary:
The short positioning in biotech (via LABD) continues: Not advice, not a recommendation.
Rumors are swirling now about power outages and cyber attacks with major corporation website shut-downs.
Does anyone really want be to playing around with long positions when torpedoes (to hit the market) are already in the water?
Stay Tuned
Note: Posts on this site are for education purposes only. They provide one firm’s insight on the markets. Not investment advice. See additional disclaimer here.
This article, just out from ZeroHedge, says ‘consumers’ are in a revolt.
No more high prices.
Buying plans for the major items, housing, auto, appliances has declined dramatically.
One chart, linked here, shows consumer complaints about high prices are the most since the data started … 1961.
The reality is the retail consumer has come to the end of the rope.
To loosely quote Von Mises; ‘If you don’t voluntarily get your spending under control … the market will do it for you.’
To quote another financial source, Steven Van Metre; he has discussed for months, that high prices will be rejected. The economy will contract and bond prices will rise.
Bonds have indeed gone up in anticipation of contraction; or forecasting an outright collapse.
Throw into the mix that we’re going to have some kind of ‘fatality event’ this coming winter; for sure, there won’t be much demand for high priced items … just from the contraction of the population itself.
Which brings us to biotech (SPBIO).
SPBIO (LABD) Analysis:
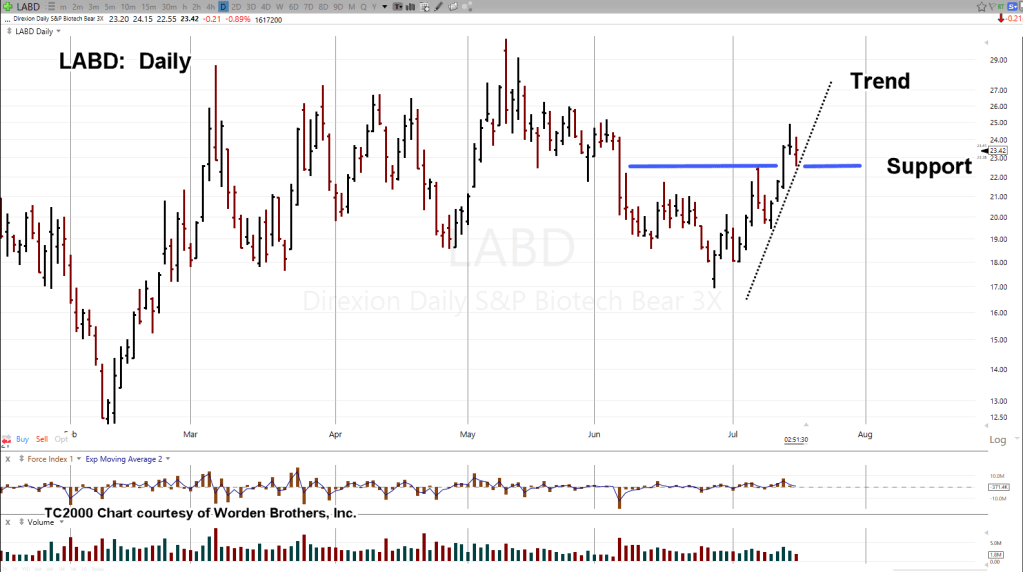
The unmarked chart of inverse fund LABD is first (just to give perspective):
Next we’ll show that LABD has or is testing support and at the same time, confirming a trendline:
Biotech is the downside leader … sometimes tag-teaming with gold but for the most part it’s biotech.
Positioning:
It’s no secret I have positioned my firm short this sector in a big way since April of this year (not advice, not a recommendation).
That position has been adjusted over the months but has been steadily increased since the intermediate low on June 28th.
Since that low, the position has been increased six times (including yesterday) and may also be done so today.
Summary:
Once again, we’re heading into the weekend. The S&P (SPY) has just printed ‘out-side-down’.
Anyone still want to hold long the market?
Stay Tuned
Note: Posts on this site are for education purposes only. They provide one firm’s insight on the markets. Not investment advice. See additional disclaimer here.
That’s a comment often seen on any number of Jerimiah Babe’s updates; openly mocking his doom and gloom assessment.
Whether he’s at the local homeless camp in Los Angeles, or in his home next to the golf course, the question remains the same;
‘J.B., When’s the collapse?’
Sometimes his response (if he’s at home) is to turn his head to the window and say “Have you looked outside?”
A good number of American’s have become so pathetically weak, ignorant, and just (to overuse the word) plain stupid, they expect to sit on their newly built patio deck (using last year’s stimmie check) and observe the fall of the U.S. from the comforts of their own back-yard.
Of course, there are some (including this author) who are first generation Americans. Their parents and grandparents emigrated (or escaped) from communist countries.
Those people do not have to ‘wake up’; they were never asleep.
Coming Attractions:
South Africa gives us the model for what’s in store … at least for sections of the U.S.; probably starting first with the blue sates (we’ll see).
You might say, it’s already happening in Portland.
Yesterday’s update showed how the so-called ‘bloodbath‘ was actually a set-up to go long (not advice, not a recommendation).
It didn’t take long for bonds (TLT) to give a Weis method ‘buy signal’. That happened at the open today.
The bull move in bonds does not confirm the ‘re-opening’ hype. That in itself, should be all that’s needed to make decisions.
It is interesting to note; on sites like ZeroHedge, there’s no talk whatsoever that biotech has (already) reversed and is leading the way down.
As of this post, inverse biotech fund LABD, is up about 38%, from its lows of late June. It appears poised for yet another breakout; lower for SPBIO and higher for LABD.
Note: Posts on this site are for education purposes only. They provide one firm’s insight on the markets. Not investment advice. See additional disclaimer here.
Note: Posts on this site are for education purposes only. They provide one firm’s insight on the markets. Not investment advice. See additional disclaimer here.