Three Amigos

The Good: Only the Senior Miners, GDX, have managed to claw their way past the highs set nearly five years ago in August of 2020.
The Bad: Junior Miners GDXJ, remain below that August ’20, level.
The Ugly: Silver Miners SILJ, are the worst, having their peak a bit later in February of 2021; they remain over -35%, below their highs.
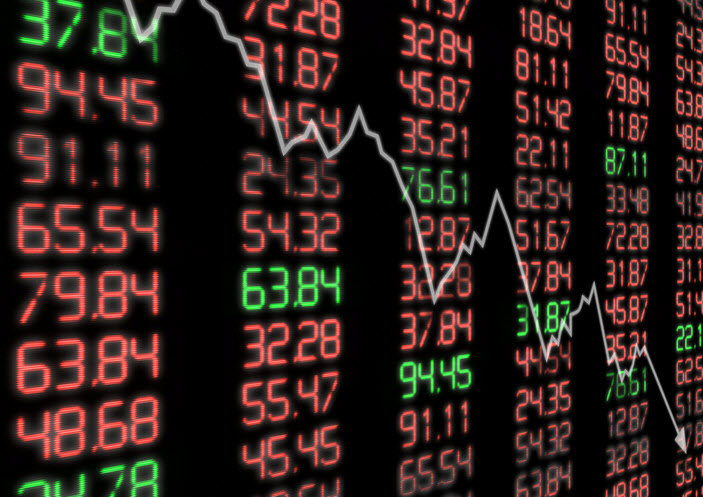
The Market Rolls Over
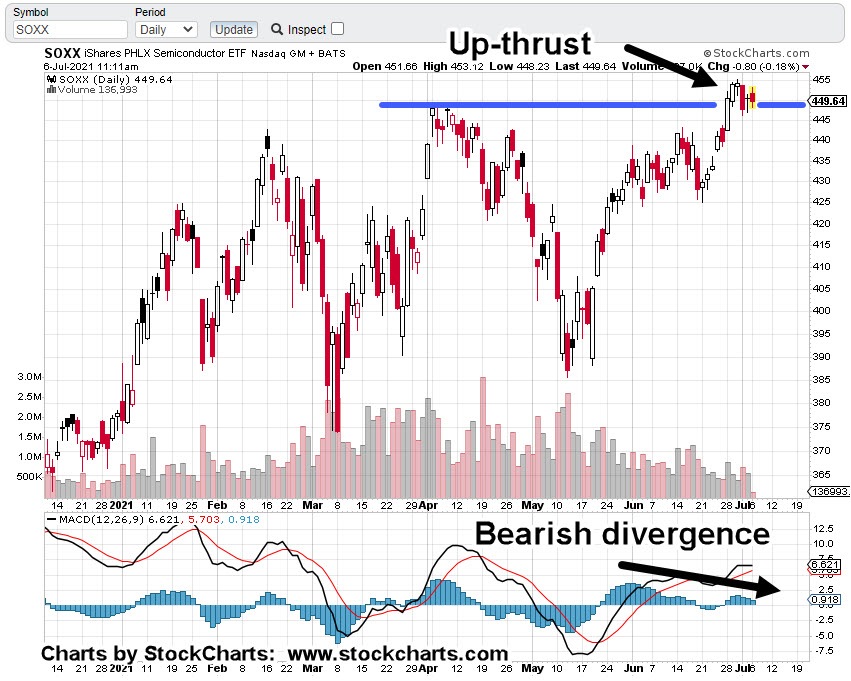
Yesterday, Friday, was a down day for the Dow, S&P, The Qs, Transports, Airlines, Semis, nearly everyone.
For some of these indices, their all-time highs were posted months, if not years ago.
There may be some (bidding) ‘defensive’ action with gold (GLD) continuing higher; as said in earlier posts, the rest of the monetary metals are far below their highs.
Let’s look at the weakest; the silver miners, as they are likely going to be the ones most affected by an economic decline (not advice, not a recommendation).
Silver Miners, SILJ, Daily
We’re at an interesting spot.
Friday was a down day that pushed below existing support, shown in zoom area.

We have simultaneous action.
Once resistance was penetrated on March 18th, it could not hold. After eight trading days, on Friday, it posted lower on heavy volume.
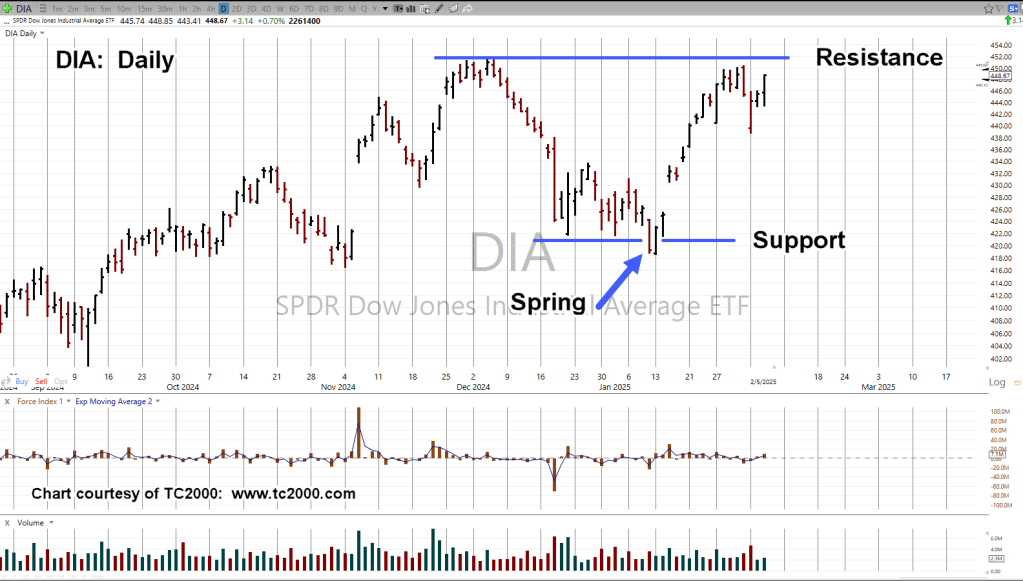
However, we can see that SILJ, is now in (a minor) Wyckoff ‘spring’ position. So, the question is, what happens next?
Stay Tuned
Charts by StockCharts
Note: Posts on this site are for education purposes only. They provide one firm’s insight on the markets. Not investment advice. See additional disclaimer here.
The Danger Point®, trade mark: No. 6,505,279