How is it possible to have silver stocks sold out here and here, yet silver bears have trapped the bulls.
As we’ll show below, this morning’s action in SLV, has confirmed the reversal; a Wyckoff up-thrust, pointing silver’s probability to lower levels.
For starters, let’s recap on how this (trading) game is played.
That is, the public i.e., the masses, need to be led to and fro so they are continuously on the wrong side of the trade.
That’s it.
So it is with precious metals and specifically silver.
The media came out recently, effectively telling everyone ‘Now is the time to buy gold’.
Where were these guys in 2001, when gold bottomed around $271/oz.
No, they show up at the end of the move … not the start.
Public Buys Hype, Not Facts
So the public has bought into the hype and run the silver coffers dry. Everyone excepts an immediate currency collapse and certainly anything can happen.
The original (bullish reversal) analysis is now supported by the facts; it’s been nearly two-years since that post and the dollar (UUP) is still headed higher.
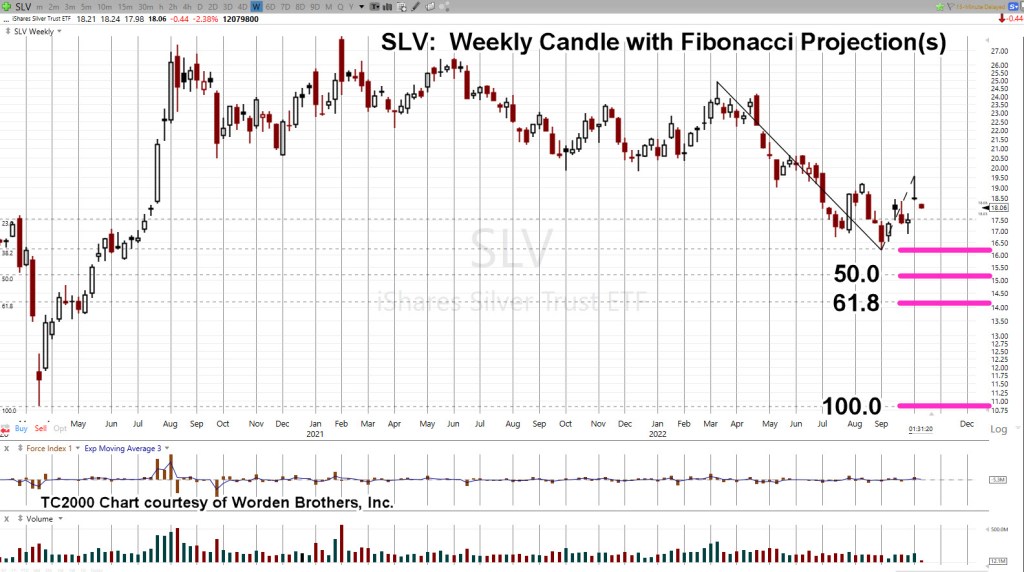
So, let’s find out where silver is likely to go. For that, we go to the weekly chart.
It’s a repeating pattern found across the markets.
Price action gets itself into a spring condition by penetrating support which subsequently sets up the reversal; the up-thrust.
Next, we’ll use the Fibonacci Projection Tool, showing likely areas for downside destination.
A full 1 : 1 projection gets us right back to where we started the whole ‘short-squeeze’.
If SLV, gets back down to the 10.50 – 11.0, level, one can only imagine what type of hype will be in vogue.
However, at those levels, it’s reasonable to expect the local bullion dealer will be begging for sales … they might even offer their product at, or near, spot. 🙂
Note: Posts on this site are for education purposes only. They provide one firm’s insight on the markets. Not investment advice. See additional disclaimer here.
Note: Posts on this site are for education purposes only. They provide one firm’s insight on the markets. Not investment advice. See additional disclaimer here.
In the weeks and months that followed, dollar updates proposed that because we’re looking at the longer weekly timeframe, ‘any rally is likely to go farther and last longer than anyone expects.’
So now, here we are.
ZeroHedge just acknowledged the obvious, with this report.
At the time of the original dollar analysis, it was (still is) popular to talk about the ‘imminent dollar collapse’.
That (dollar) post was released in the face of overwhelming opposition to any upside.
All of which, brings us to gold and silver.
Gold’s ‘Changing of Hands’
With the passing days and weeks, it looks like the insight of gold (GLD) changing hands (here and here) is proving correct.
It’s not a popular view and it’s sure not getting any ‘clicks’.
However, as we’ll see below, there’s potential for gold and silver to head to much lower levels if not just temporarily.
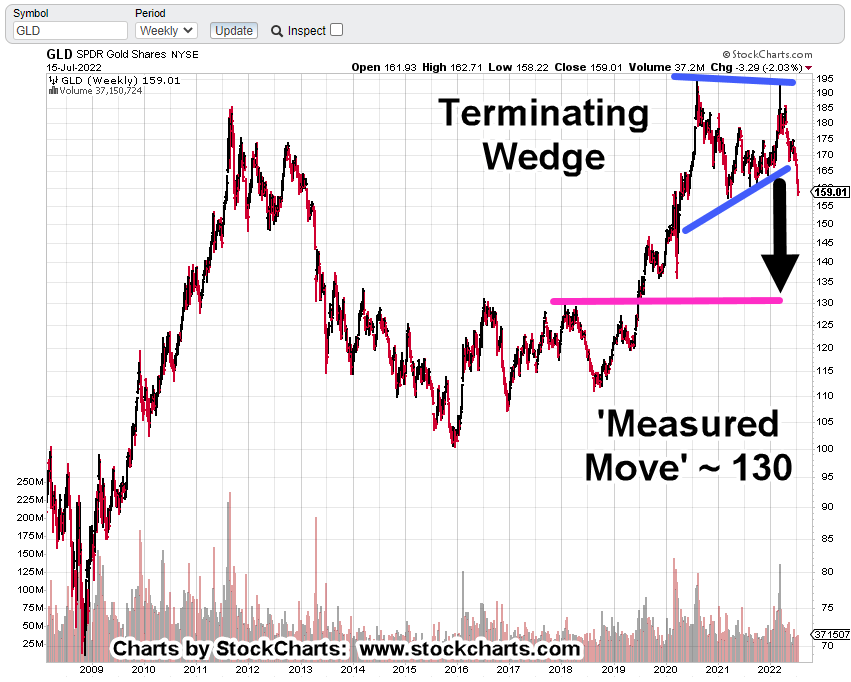
Gold (GLD), Weekly Bar
The wedge breakdown with measured move.
It’s clear, the 130 area, is an obvious support level.
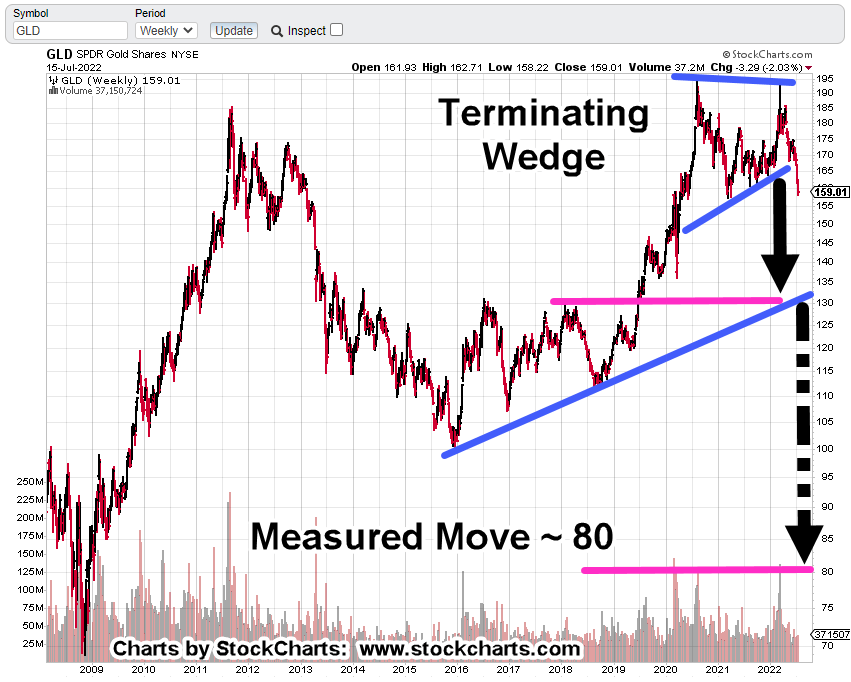
The sticky part, previously discussed here, what if somehow, gold heads lower after the measured move?
We may have something that looks like this:
If that happens, think of the confusion that would result.
From an ‘oligarch’ standpoint, it makes perfect sense.
We’ll not elaborate on that in an open (unsecured) forum.
However, let’s just say, we should keep in mind, it’s the corn and grain first, then gold and silver (not advice, not a recommendation).
Silver (SLV) projections are similar; potential targets at SLV 13 -14, then, if lower to single digits, around SLV 9.0 – 9.5
Summary
First it was, ‘The dollar’s going to collapse’, it’s ‘Imminent‘ (years ago).
Then, when that did not work out, it was the ‘Silver short-squeeze’ and we’re going to ‘Put it to the man!
Then, when that did not work out, it was ‘Gold’s going to $3,000/oz. in months, not years!’
Then, when that did not work out, it’s now ‘The Fed’s going to seize all your money.’
Ah ha! … We may have some truth but not in the way that’s obvious.
If the typical middle-class individual is maxed-out with debt, having overpaid for depreciating ‘assets’ such as cars and housing, there really isn’t much left in the banking accounts, right?
Retirement accounts … now, that’s different.
Covered many times (scroll to No. 3) on this site is just how easy it is (will be) to confiscate the IRA.
Note: Posts on this site are for education purposes only. They provide one firm’s insight on the markets. Not investment advice. See additional disclaimer here.
As far as is known, no other site has identified, gold (GLD) has “changed hands” with the next probable direction, as sideways or down.
That is, until now.
Sometimes, it literally takes years to find anything useful from mainstream financial media. However, you really can’t blame them; it’s not their job to reveal the truth.
By chance, every once in a while, someone makes a mistake and bits of truth, escape.
That may be where we are with the following Kitco NEWS interview, linked here.
It’s worth a half-hour to watch the entire exchange but for us, the real business starts at time stamp: 19:05.
The Overall Gold, Premise:
If the dollar moves sharply higher and the markets move lower (or crash), gold’s response may be a wash-out to $1,300/oz., or lower.
“Changing of Hands” as identified on this site, was mostly intuitive. We won’t know for sure if it was the (real) inflection point until gold resolves itself.
Now, we have another view from a separate party (above), that at least recognizes gold’s downside potential.
With that said, let’s look at gold (GLD), Quarterly
Gold (GLD), Quarterly Chart
There are only two trading days left in the quarter; it’s reasonable to think we’ll get something similar to the un-marked chart below.
The next chart shows the Wyckoff up-thrust (reversal) along with an attempt to move higher (the test) that was rejected; prices continued lower.
The next chart is the one no gold bull wants to see; downside projection(s).
Using a standard Fibonacci tool, we have the above projections.
If there’s a major unwind of gold positions, price could decline to the GLD, 133-area, corresponding roughly to physical gold @ $1,300/oz.
Uncharted & Unprecedented
The caveat: We’re not in any time that’s happened before (other than maybe the collapse of the Roman Empire).
It’s uncharted territory.
We should expect market events to reach never before seen extremes. That would include the potential for a severe draw-down in gold.
The World, Then
If gold gets to the $1,300/oz level, it would easily be considered a buying opportunity.
What if gold keeps going lower, moving below $1,000/oz?
The second projection, targets approximately $950/oz.
What, then?
What if the $1,300 level, was bought by those with means, using both hands … including massive margin (if it’s still available).
What happens if there’s another leg down; then margin calls?
Can’t happen one might say.
Well, oil going negative for the first time in history couldn’t happen either … until it did.
Note: Posts on this site are for education purposes only. They provide one firm’s insight on the markets. Not investment advice. See additional disclaimer here.
A military invasion of Ukraine, nuclear power plant (supposedly) bombed, set on fire, power outages and potential food rationing, yet gold’s still below all-time highs?
Not only that as we’ll see below, the actual price has traced out what’s so far, a counter-trend (a-b-c) move; that is, the main trend is down … not up.
I like gold as much as the next guy but we’re seeing again and again, that’s not the crux of the immediate (world-wide) plan on a go forward basis.
Dollar & Gold: Game Of ‘Chicken’
Like a game of chicken, both the dollar and gold rallying strongly together; waiting to see who’s going to reverse first.
What do you think?
With as much control as certain entities have over both the dollar and gold … who’s likely to turn lower first?
If it’s gold, then at this juncture (below), it’s in a good position for reversal.
Weekly Gold (GLD) Close
The yellow vertical lines above, are of equal length.
GLD could push slightly higher and still maintain the ‘corrective’ a-b-c, structure.
As labeled, price action fits the ‘rule of alternation‘. The structure of the ‘a’ wave is brief and sharp. The structure of the ‘c’ wave is overlapping and longer duration.
The Danger Point:
Gold (GLD) is there now.
Continued upward pressure would change the ‘reversal’ assessment, to potential breakout … much higher prices ahead.
However, as J.B., points out in this latest video (time stamp 9:25) saying, he’s never seen so much traffic on the roads … as if gasoline’s at 99-cents.
One answer could be, this is the herd:
Completely unprepared and running around to find another herd as equally unprepared.
Panic buying of precious metals because everybody else is doing it, could be the reason behind gold’s current juncture.
Note: Posts on this site are for education purposes only. They provide one firm’s insight on the markets. Not investment advice. See additional disclaimer here.
Gold (GLD) has pushed past prior resistance and is now hovering at the 177.00 – 177.50 level.
International tensions are the usual excuse for the metal’s move but has it really done anything out of its recent norm?
This is a good time to see what the gold market is saying about itself.
Gold (GLD) Daily Chart
We’re going to use a somewhat compressed version of GLD. The reason for that will become apparent.
Starting with the un-marked daily chart below:
First is the obvious Wyckoff up-thrust (potential reversal) condition.
Price action has pushed past resistance and is now hovering at the 177.50, area … as if unsure what to do next.
GLD can come back and test on its way higher; it can come back, test and fail into a downside reversal.
The next chart is where it gets depressing for the bulls.
Price action in GLD, shows the current rally’s distance, is no different than it’s been for at least the past year.
We’ve highlighted the most recent move in blue and then moved that same line back to prior moves of nearly the exact same distance (magenta lines).
So, gold’s not doing anything out of the norm (so far) that it hasn’t done already.
Note how the entire twelve months shows price action as choppy and over-lapping.
This type of deep retracement action is characteristic of a countertrend move … that is, gold moving higher in choppy action is actually counter to its main trend … down.
Summary
With the dollar moving higher and the continued possibility of gold/dollar inverse correlation, somebody’s likely to reverse … soon.
The dollar’s been in a year-plus long upside reversal. The weight’s on the gold bulls to prove the dollar/gold inverse correlation is disconnecting.
Note: Posts on this site are for education purposes only. They provide one firm’s insight on the markets. Not investment advice. See additional disclaimer here.
What if the ‘imminent collapse’ of the dollar is overblown by about 50 – years?
According to this just out, on private gold-filled currency, the article states average life of a fiat currency, is four generations. It goes on to say there are exceptions like the British Pound, continuing on even after hundreds of years.
The Black Swan
In Taleb’s book ‘The Black Swan’, he says it’s an event that nobody expects. It has long lasting repercussions and permanent change.
However, what most if not nearly everybody ignores or leaves out, is his alternate definition. That is:
A Black Swan can also be a future event that’s widely accepted as fact, that does not happen !!!
Is that where we are with the U.S. Dollar?
Even though the dollar has not collapsed and in fact, has rallied as we’ll see below, the ‘collapse’ talk continues unabated.
It’s easy to talk about dollar collapse.
It’s what gets the clicks. No matter that an actual collapse may be years if not decades away.
As of this post, how many ‘monopoly money’ YouTube videos can be found? Seems like it’s the same number or more than, ‘gold to skyrocket higher’.
Well, so far, gold has not skyrocketed higher.
On top of that, this site’s even provided an exclusive correlation that gold’s moving inversely to corn.
See ‘Insight Note‘ at the end of this post.
Ever since the ‘Derecho‘, it’s never been the same.
Back to the dollar.
No doubt, the dollar was whacked over the past trading week. Let’s take a look at what the UUP, price action is saying about itself.
Dollar, UUP, Weekly Chart
The unmarked chart shows the dollar oscillating, testing support for six-months at the beginning of 2021.
Then, in mid-June ’21, UUP pivoted decisively higher (gold, GLD, pushed lower) and never came back to those levels.
Of course, this past week The Usual Suspects were out talking about the dollar and ‘monopoly money’.
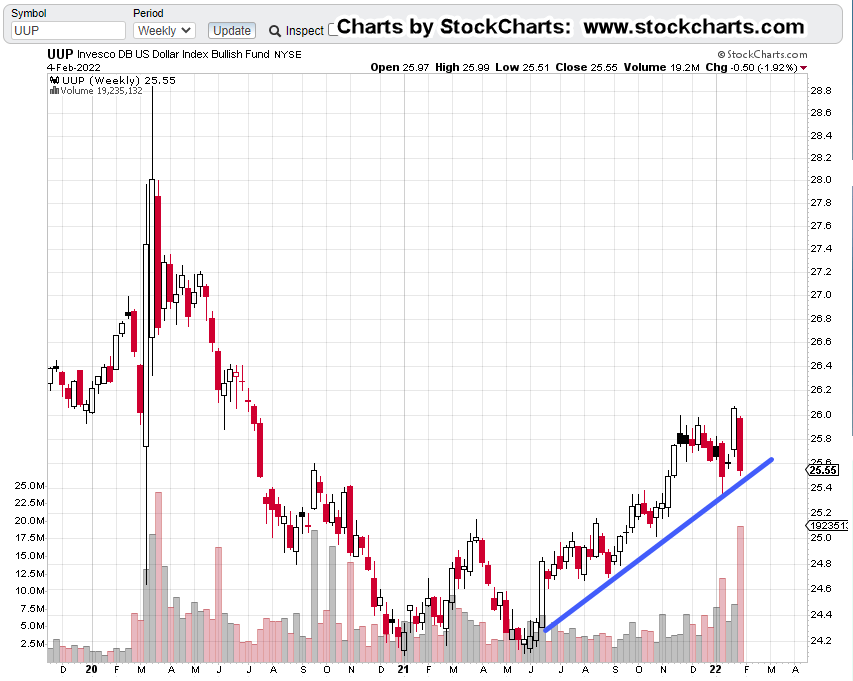
The chart below shows last week’s bloodbath has served to bring UUP, down to an established trend-line.
It’s important to note, with all that (down) volume, the most since early 2020, UUP was not able (thus far) to break through the trend (blue line).
That leaves the dollar at or near, the danger point.
Continued, sustained selling, risks breaking the uptrend.
If the opposite takes place and UUP starts to rally, last week may have been an inflection point (to the upside).
Gold (GLD) and the dollar appear to still be inversely correlated.
Summary:
Ever since removal of the link to gold in 1971, the dollar has the potential to collapse at any moment.
However, in this case, we at least have some historical precedent that on average, fiat currencies tend to last four generations before becoming worthless.
Wyckoff sates in his writings over and again, ‘somebody always knows something’.
If there’s a collapse afoot, he tells us to look at what the market is saying about itself (not advice, not a recommendation).
Note: Posts on this site are for education purposes only. They provide one firm’s insight on the markets. Not investment advice. See additional disclaimer here.
The Danger Point®, trade mark: No. 6,505,279
Insight Note:
It’s been a strange coincidence over the past year or so, ideas presented on this site make their way to certain YouTube sites either in the titles, or within their content.
The timing of this phenomenon, that within a day or two, ‘post it first here, see it on YouTube there’, has occurred more times than one would consider as just ‘coincidence’.
Admittedly, the insights (making their way to certain YouTubers) have not been exclusive … that is, until now.
Recognition of the Gold/Corn inverse correlation, first posted here, is unique to this site.
As far as is known, this correlation has not been presented on any other financial site or YouTube channel or any other medium.
It may be an important data-point and map into this site’s long-time premise; it’s the corn and the grain first, then gold and silver (not advice, not a recommendation).
For more detail, search for Genesis 41.
When ideas from others are incorporated into the analysis presented on this site, full acknowledgement of the source is cited.
As Dr. Elder said in his book ‘Come Into My Trading Room’:
“I have zero respect for thieves”
He’s talking about the theft of his book title: “Trading For A Living”. He goes on to say, (paraphrasing)
‘Do you really want to use market analysis or input from someone that can’t think for themselves?’
Authorization:
Therefore, this footnote is authorizing the further use of the Gold/Corn inverse correlation by others in the industry if they so choose with the following caveat:
If one of the sites monitored (or some other media) uses this exclusive insight, and does so without referencing the source, it puts this author in the unenviable (but not unfamiliar) position of calling out the thief by name … not unlike what Stew Peters is doing (to the hoax/genocide perpetrators) on his broadcasts.
This market environment’s providing a fantastic public service:
It’s separating out the hucksters, the shysters and the otherwise incompetent from those who are, or who are striving to provide a service or useful insight.
The general investing public may find out soon enough, they’re on their own. Maybe unbeknownst to them, they’ve always been on their own.
That is, the strategies and research presented on this site are leading actual news events by about twelve months.
Example No. 1: The Dollar Rally
The dollar rally potential (when first recognized) was presented in this post over a year ago.
Since then, about 10 – 11 months later, ZeroHedge picked it up only after it had become a full-blown reversal.
The dollar has continued to rally and is currently (after breaking support), in Wyckoff ‘spring position’.
Example No. 2: The Food Supply & ‘Inflation’
One of the earliest posts discussing the intentional destruction of the food supply, is linked here.
From that update, we had:
“The entire U.S. agricultural food supply infrastructure is being systematically dismantled.”
Those statements looked hyperbolic at the time.
Obviously, at this point, it’s becoming common knowledge; at least for anyone that’s listening.
Example No. 3: The ‘Speck Effect’
In what may have seemed like a brutal rant, has now become fact.
This rendition of ‘The Night Before Christmas’, posted over a year ago, had no links to support the intuitive assessment of what was to come.
That post has now been updated with the facts.
Warning Note:
Obviously, not everyone injected, is a coward.
Children are rightly terrified. Let’s be realistic.
However, the idiot parents and enabling Doctors and Pharmacists are (eventually) likely, as Dr. Vernon Coleman puts it, to be arrested and tried/convicted for either murder or attempted murder.
Summary
There are other research examples like gold and the gold miners but the three above, cover the picture fairly well.
From the data presented, it’s apparent at least two things are happening simultaneously.
No. 1: Strategic Analysis
World, market, and local (within the U.S.) events are researched and analyzed for potential impact.
No. 2: Market (Wyckoff) Analysis
Those events from No.1, are then linked to market action if any. Potential opportunities are identified.
The Path Forward:
This update is a very brief description of the site’s go-forward objectives.
What’s here, is a long-term (documented) track record of situational awareness; coupled with reading price action which in turn, is used as a case for market positioning.
Stay Tuned
Note: Posts on this site are for education purposes only. They provide one firm’s insight on the markets. Not investment advice. See additional disclaimer here.
If there ever was a CPI report to completely break the ‘inflation’ narrative, this was it.
Several articles, here, here, and here, all saying essentially the same thing … skyrocketing ‘inflation’.
If that really was true, why is the 5,000-year-old hedge against inflation (gold) not responding … and even worse, heading lower?
That’s because, it’s all rigged, man !! (cue, Tommy Chong).
Well, it has always been rigged.
Both Wyckoff and Livermore talked about that ‘rigging’ way back in 1921, when Wyckoff interviewed Livermore about his trading methods. Later, in 1922, a series of articles on Livermore was published in Wyckoff’s ‘Magazine of Wall Street’ (a forerunner to Barron’s).
The point is, we’re not interested in who is doing the rigging. That’s what the press tries to find out (a waste of time). The real question is, what are those ‘rigging’ trying to accomplish?
Answer that, and you may have a potential trade set-up.
We’ve got supply chain, controlled-demolition with corresponding asset price inflation; the kicker is, gold and the dollar, say we’re in some kind of monetary deflation.
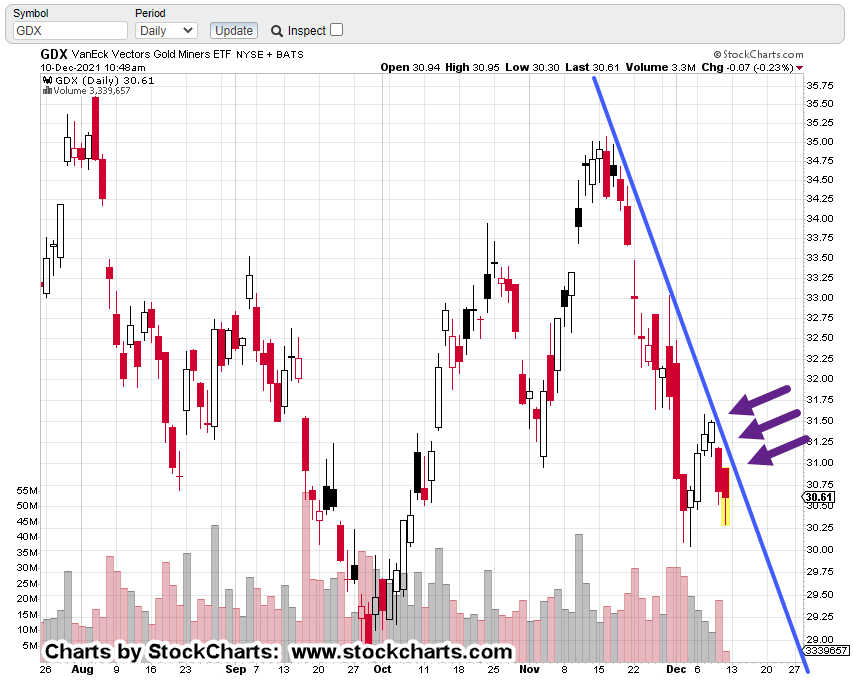
Senior Miners, GDX Confirming Trend
Price action in the gold market and the miners confirm that (deflation) assessment … for now.
Zoom-in on trend line contacts.
Summary
Based on the articles linked above, if there ever was a data-set release that would launch gold (and the miners) higher, today would be the day … right?
Both Wyckoff and Livermore did not concern themselves with what ‘should’ be happening. They were focused on what ‘is’ happening.
Gold and the miners are (and have been) moving lower.
As yesterday’s post said, we’ll remain short (not advice, not a recommendation) until the market itself says to exit.
Note: Posts on this site are for education purposes only. They provide one firm’s insight on the markets. Not investment advice. See additional disclaimer here.
You have to wonder; will this nonsense be the excuse for a market collapse?
Looks like the gold miners (GDX) are not waiting around to find out.
Yesterday’s ‘gut-check’ counter trend move, was summed up with the following quote:
“Such a move, is typically what happens just before a market gets underway in earnest.”
Today, the Senior Miners, GDX, reversed and closed down a solid, – 3.05%.
However, the main topic for the day is the dollar and specifically, the UUP tacking fund.
We’re just a few days shy, where a year ago, this site identified the dollar was in position (potential does not equal guarantee) for a sustained upside reversal.
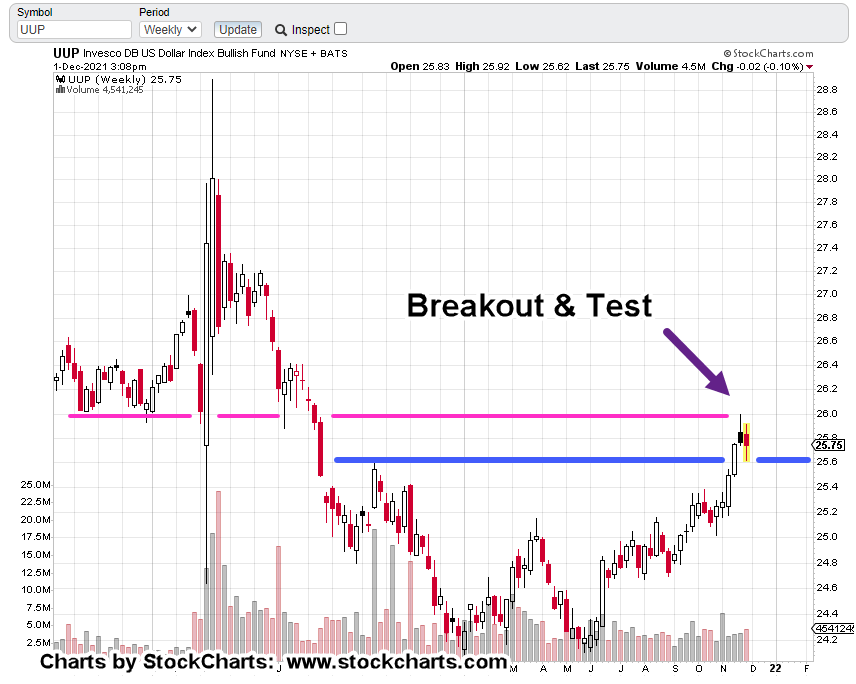
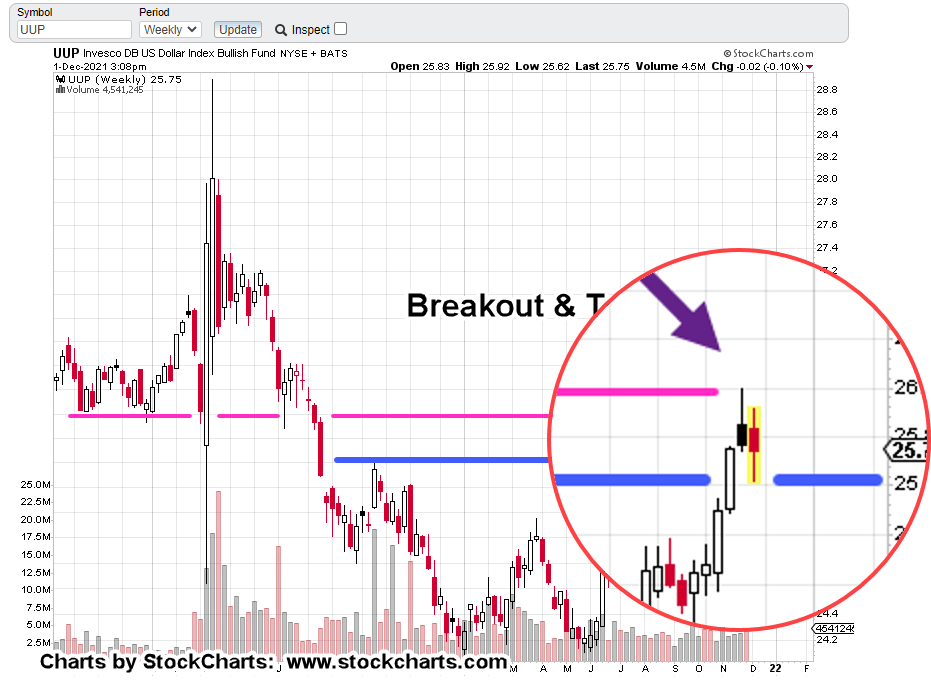
Dollar, UUP
The weekly chart of UUP shows where we are.
The magenta line is resistance and the blue line is support.
The next chart highlights the current action.
If the rally is to continue and if this market action was happening at some other (non-Omicron) time, you’d expect an amount of sideways oscillation before more upside; maybe several weeks or so.
It could happen that way … or, behind Door No. 2, we might have some kind of ‘event’ launching the dollar over the resistance area.
Farther down on the list, is downside reversal.
However, at this point, gold (GLD) and the miners, are saying it’s the lower probability choice.
Note: Posts on this site are for education purposes only. They provide one firm’s insight on the markets. Not investment advice. See additional disclaimer here.