Gold, Dollar: In Tandem

Dollar Rally, Gold Rout

Markets Remain Inversely Correlated

First, let’s start with a review of the dollar reversal.

Back in early May, this report pointed at the possibility for a bullish set-up in the dollar.

That type of head’s up gives one time to investigate the correlations.

Correlations like, ‘is gold still inversely correlated to the dollar (and bonds)?’

Over the weeks as the set-up unfolds, confirmation or negation can be added by observing price action.

By the time we get the dollar penetrating support levels, we have gold at interim highs.

In fact on June 9th, the day the above ‘penetration’ report was posted, gold (GLD) had already reached its peak and was in a reversal.

Five days later (before the major down-move), this report was published on gold.

Therefore, at this juncture, we’re still inversely correlated.

So, what does that mean?

The updates on the dollar have proposed, since the bullish divergence (now turned rally) is on a longer, weekly time frame, the ensuing move could have the potential to carry the index UUP, to the top of the trading range shown here.

Then, what happens to gold?

If the negative correlation remains intact, gold gets whacked.

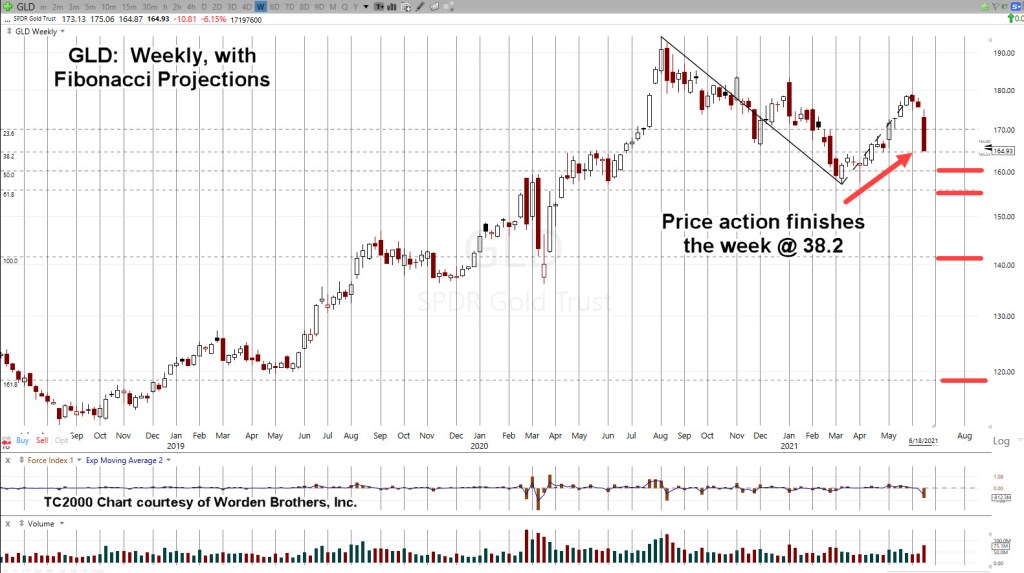
The weekly chart of GLD (above) has the index closing right at the Fibonacci 38.2%, projected level.

Wide bars tend to get tested. There could be some kind of rally in the coming week but it’s not required.

The Fibonacci projections highlighted as the orange bars, go all the way down to 161.8%. That’s equivalent to GLD at ~ 118.65, or the futures market somewhere around $1,300 – $1,350.

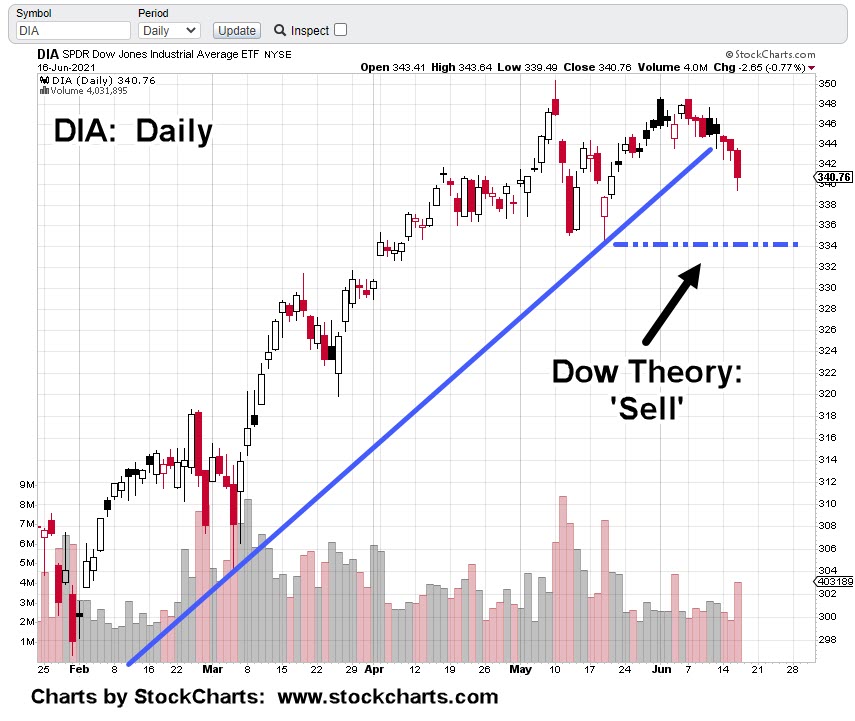
With the Dow 30, (DIA) penetrating and closing below the 336, support levels on Friday, we have a Dow Theory Sell Signal (not advice, not a recommendation).

The markets appear to be rolling over.

The last market reversal in February – March, of last year, had GLD dropping over – 14.5%, in two weeks.

Fast forward to now; GLD, is already down over – 15.2%, from its August 2020, highs.

Stay Tuned.

Note:  Posts on this site are for education purposes only.  They provide one firm’s insight on the markets.  Not investment advice.  See additional disclaimer here.

Update: Dow Theory, ‘Sell’

9:05 a.m., EST

Dow 30 (DIA) breaks trendline

Price action declining towards support

Price action rolls over and in the process, breaks the uptrend.

The prior update, had this link to an explanation of the sell signal (not advice, not a recommendation).

The sell signal is confirmed if/when the support at the dashed line is penetrated with a close below that line.

Summary:

The markets were volatile yesterday with sharp moves in the dollar, gold and the gold miners.

Pre-market action has gold (GLD), continuing sharply lower; – 4.1 points, or – 2.37%.

Inverse GDX, gold miners DUST, is trading higher as well; up about + 1.1 points, or + 6.65%.

For those monitoring this site on a regular basis, none of the above is a surprise.

We’ve been reporting on the pending dollar reversal for weeks; how gold (and silver) still appear to be inversely correlated.

Stay Tuned

Charts by StockCharts

Note:  Posts on this site are for education purposes only.  They provide one firm’s insight on the markets.  Not investment advice.  See additional disclaimer here.

Gold Channel … Down

10:47 a.m., EST

Contact points confirm channel

Gold (GLD) heading lower

The two hits on the right side channel line provide confirmation of the trend.

An expanded version of the daily is below:

So far, we’ve had the blockage of the Suez Canal. Auto parts being sent to the bottom of the ocean off Japan. ‘Mysterious’ grain silo fires destroying harvested crops.

But wait, there’s more. This just in:

A fire has destroyed the largest grease plant in the U.S.

If transportation is shut down as a result of cyber attack, fuel pipelines off-line, no grease to lubricate the wheels or any number of other (planned … and don’t think there’re not) events, the last thing that’s going to help get anyone through, is a ‘stack’ of inedible metal.

It’s no secret this site’s been using the Biblical precedent of Genesis 41.

That is: Grain and Corn come first … then gold and silver.

The ‘stacking’ public has got this message reversed. Of course, this is not advice or a recommendation.

However, for those that can see, it’s so obvious the goal is ‘controlled demolition’ of the supply chain. All of it.

We’ll put everything back to ‘normal’ if you just get injected.

Meanwhile, biotech IBB, and SPBIO, have both posted a new daily low.

IBB is poised to penetrate the resistance area identified in this update, and come back to test the wide bar.

If that happens, we have a Wyckoff up-thrust in play. More analysis of biotech to follow.

Stay Tuned

Charts by StockCharts

Note:  Posts on this site are for education purposes only.  They provide one firm’s insight on the markets.  Not investment advice.  See additional disclaimer here.

Dow Theory Sell & Gold

9:23 a.m., EST

Dow Theory; Sell signal nears

Gold, in Wyckoff ‘Up-Thrust’ reversal

Even though the current environment is anything but traditional, the report at this link shows how close the market is to a Dow Theory sell signal.

It could be. Even with valuations and markets at never before seen extremes, the traditional theory will still hold.

Wyckoff analysis, developed during the same time as Dow (published in 1910), does not concern itself with ‘valuations’.

That’s the key

Wyckoff discovered early on, that ‘markets have an energy of their own’.

This ‘energy’ has nothing to do with valuations.

Gold (GLD) has been discussed several times over the past few weeks; that it has stalled and in potential reversal.

The weekly chart shows the blue line resistance area. Price action has struggled at this location for weeks.

Now, with the market about to open, GLD is trading down a solid -2.5 points, or – 1.4%.

If that level is held to the open, it puts GLD below the June 3rd (weekly) low and below the resistance area.

With all the inflation, and hyperinflation talk, GLD has not made it to new highs.

Last week, the dollar reversal was confirmed with UUP posting a new weekly high. At the same time, weekly MACD confirmed its bullish divergence.

The stage appears to be set for some kind of surprise; in the markets, the dollar and gold.

Stay Tuned

Charts by StockCharts

Note:  Posts on this site are for education purposes only.  They provide one firm’s insight on the markets.  Not investment advice.  See additional disclaimer here.

Moderna: Reversal Review

‘Reversal at hand’ said the prior update

Reversal still imminent?

MRNA has pushed above resistance on declining volume (shown above) . The next chart has MRNA in a terminating wedge pattern:

Price action this past week has just contacted the top portion of the wedge.

MRNA is the fifth-largest cap equity in the IBB index. Its market moves have a definite effect on that index.

IBB, shown below:

On Friday, the market eased back a little. Will it come back to test the resistance area next week?

There’s no doubt about the wide high volume bar. That day (last Monday) posted the highest daily volume in four years.

Wide high-volume areas are usually tested.

It just so happens, that wide area is below resistance.

To test the wide bar, price action would need to move below the resistance area. Doing so, would put a Wyckoff ‘up-thrust’ into play.

The next chart shows another resistance area not easily discernable:

Although somewhat hidden, there’s another resistance level that for now is putting a limit on the upward travel of IBB.

Summary:

MRNA’s at an extreme. The previous update linked to a site which shows insiders bailing out in the tens-of-millions of dollars.

The bond market, with its upside breakout is not confirming the ‘recovery’ narrative.

The dollar is reversing as well.

Gold and the miners have stalled; potentially reversing.

The narrative is shifting as the media (all controlled don’t forget) has decided on its sacrificial, e-mail lamb.

Don’t worry, nobody’s going to jail. It will just be another distraction to keep the mask wearing masses from getting prepared for the fall.

As a reminder, this is how they think; ‘Just doing the right thing’ Almost like ‘Just following orders’.

Stay Tuned

Charts by StockCharts

Note:  Posts on this site are for education purposes only.  They provide one firm’s insight on the markets.  Not investment advice.  See additional disclaimer here.

Dollar Divergence: Update

2:37 p.m., EST

Dollar penetrated support and is reversing

Potential for sustained, persistent rally

Wide trading range

Looking at the weekly close chart, we can see the wide range.

In addition, there’s a significant bullish divergence that (technically) gives the dollar, UUP, enough energy to test the top of that range; a potential that’s completely opposite the current narrative.

A this juncture, silver, gold and the miners are still correlated.

Yesterday, a potential top and reversal in miners GDX, was identified. Today, it appears to be hovering and looking unsure of its direction.

GDX has not posted a new daily high or low as of this update.

A sustained dollar rally (along with the bond market?) would be unexpected given what seems to be apoplectic hyperinflation ranting.

Separately, in biotech, the market (IBB) has stalled to the upside in a higher than expected test. Inverse fund LABD, made a new daily low and it too, has stalled.

Downward thrust energy on LABD is dissipating.

Technical update for biotech, planned for tomorrow … market permitting.

Stay Tuned

Charts by StockCharts

Note:  Posts on this site are for education purposes only.  They provide one firm’s insight on the markets.  Not investment advice.  See additional disclaimer here.

Gold Miners Reversal

9:31 a.m., EST

Gold and the dollar, correlated

Dollar’s set up for reversal and miner’s, GDX attempt to move higher, failing

Over the past few weeks, the bullish divergence case for the dollar has already been presented.

Now, it looks as if miners GDX has topped and reversed

Price action above shows that so far, GDX has not been able to get back above resistance.

Inverse fund DUST just opened higher +1.26%, at 15.25

Stay Tuned

Charts by StockCharts

Note:  Posts on this site are for education purposes only.  They provide one firm’s insight on the markets.  Not investment advice.  See additional disclaimer here.

Inflation Reaches Peak Narrative

11:32 a.m., EST:

Just like ‘peak oil’ back in the summer of 2008, now it looks like we’ve reached ‘peak narrative’ for inflation.

‘Narrative’, because the markets are a game of manipulation.

If you don’t know who’s being manipulated, then that person is you (slightly changing a Buffett quote).

Bolstering the assessment, is this report from ZeroHedge.

Looks like everybody’s on board and reporting higher prices. Just like they were on board last year with: “We’re all in this together”.

The exact same tag-line for every major U.S. corporation … with ready made (like they knew ahead of time) banners to boot.

The problem is, the markets are not following along.

Reported two days ago, senior gold miners are testing their reversal.

Yesterday, was an upward push that wound up being an ‘out-side-down’ bar (GLD, GDXJ, SLV) … a reversal in itself.

That’s not in the script. Or, is it?

At this point, the public’s literally redirected, manipulated, at will. It’s a sick game being played by all who control the media.

From a personal standpoint, I’d rather make some popcorn, take my red wagon full of fiat, go camp down around $800/oz., and wait.

The gold ice cream man may never show up. If he does, great.

If not, there’re other opportunities; at least I’ll not be one of the manipulated masses screaming inflation hyperbole if/as/when gold ratchets all the way down.

Stay Tuned

Note:  Posts on this site are for education purposes only.  They provide one firm’s insight on the markets.  Not investment advice.  See additional disclaimer here.

Senior Miners (GDX), Testing

11:27 a.m. EST:

With price action similar to the Amgen reversal, senior mining index GDX, is testing resistance.

As if taking a cue from yesterday’s report on gold heading lower, today we have gold and the miners deciding to head higher.

All is not what it seems however.

The GDX chart above, shows we’re already in up-thrust condition. There has been a sign of supply (selling overwhelming the buying) and now we’re heading up into a test.

Going back to this report on Amgen, it’s a near exact replica of price action; except it’s (apparently) taking place quicker.

Note the bottom of the ‘Sign of Supply’ is a Fibonacci 8-Days from the high posted on April 21st.

That would naturally lend itself to expect testing action to complete on Fibonacci Day 13, which is this coming Friday.

Remember, that as soon as everyone’s got it figured out (Fibonacci time frame) it changes to something else. So, if no one is really paying attention and still in the hyper-inflation bull camp, they’ll look at this action as a bull move; missing the reversal (when or if it comes).

Tests can fail as well. GDX could push through the resistance and negate the up-thrust.

As stated many times before, the gold market’s too crowded with too many rabid bulls.

This may be a good test and reversal set-up but we’ll stick with shorting biotech (not advice, not a recommendation).

By the way … biotech’s doing very well on the short side today … 🙂

Charts by StockCharts

Note:  Posts on this site are for education purposes only.  They provide one firm’s insight on the markets.  Not investment advice.  See additional disclaimer here.

Gold, The Big Picture

The bottom line for gold is: Retrace, lower

No-one in the inflation camp wants to hear that … it’s uncomfortable to face the potential of being so wrong.

Albeit wrong in the short term but probably right later … after it’s too late. More on that farther down.

Just like the lazy (and complicit, we might add) financial journalist publishing the standard (speck blaming) propaganda for the day, so too are the hyper-inflationists, jumping on the most popular bandwagon in town.

Not even considering the potential for a retrace; admittedly, which could be short and sharp but significant nonetheless.

This site has presented several times, we’re in a situation similar to that of Genesis 41. It’s the corn and grain first … then gold and silver.

Just to back that up a bit before getting to the charts, we have the following:

Crop failures world-wide

Systematic destruction of the food supply chain

Systematic elimination of farms and viable (for millennia) ranching practices.

Solar minima activity (decreased sun-spots) causing erratic weather patterns, shifting growing zones; even as far as sub Sahara, Sudan.

Those so focused on stacking metals will likely be using that stack to pry much needed food, food staples, seeds and fertilizer out of the hands of those not willing to sell … at any price.

Why are the oligarchs not worried about the ‘little guy’ stacking metals?

Because there’re going to make it irrelevant … at least for just long enough to completely bankrupt, starve or ‘inject’ the middle class.

Moving on to the charts:

The title header said ‘big picture’. Here we are with monthly gold charts going back to the 1950s, time-frame.

It’s been a long … long bull market. It appears to have made a top at ~1,972 and is retracing … if only just a bit.

The second chart is the one that gives us pause. Consider the potential for a more substantial pull-back.

Markets like to retrace and test. It’s what they do.

That second chart is scary. It’s plain, the 760 – 780 area is a long time (monthly) support level that goes all the way back to 1980.

Absolutely no-one expects, or is planning for gold to get back to $800/oz, or lower.

Think of the irony. The ‘stackers’ (and maybe the rest of us), having to exchange actual money, gold and silver, for worthless fiat just so they/we can buy food to stay alive.

After the middle class stackers have exhausted their metals hoard, that’s when gold and silver will launch into the next bull phase.

It has been done this way (keeping the peasants under control), literally for millennia. The method works … why change?

Summary:

The intent here, is to at least recognize the possibility for the above scenario. It’s clear and becoming more clear every day, food is the weapon of choice.

The objective is to have enough food ahead of time; be in position to take advantage of once-in-a-lifetime metals prices should that opportunity be presented.

Stay Tuned

Charts by Macrotrends

Note:  Posts on this site are for education purposes only.  They provide one firm’s insight on the markets.  Not investment advice.  See additional disclaimer here.