The Market Set-Up … This Week

What To Watch … Gold, Bonds, & Real Estate

First off, ‘Goldman‘ says melt-up.

Not to be outdone, we have this ‘me too’ melt-up article as well.

Let’s not forget, all the ‘Fed must do something’ rumors and feigned concern by its members.

If anyone really wants to know the big picture, the overall plan (a wide majority do not), this interview may be the best explanation to-date.

With all of that, we certainly could get some kind of rally in the coming week. We’ll let the price action speak for itself.

As a reminder, Wyckoff analysis does not concern itself with press releases, rumors or ‘fundamentals’; Wyckoff himself, determined based on price action alone, they have no material effect on market movement.

In his words, ‘other forces are at work’, and it’s those forces that interest us.

Gold & Silver

As said in this update, gold (GLD) was just ‘ticks’ away from posting a new monthly low. In fact, it got just 0.24-pts, from a new low before rebounding.

Of course, each time we get any kind of rally in the metals, there’s the usual hysteria. Even though for the past seven months and counting, those rallies occur at lower and lower levels … i.e., a bear market.

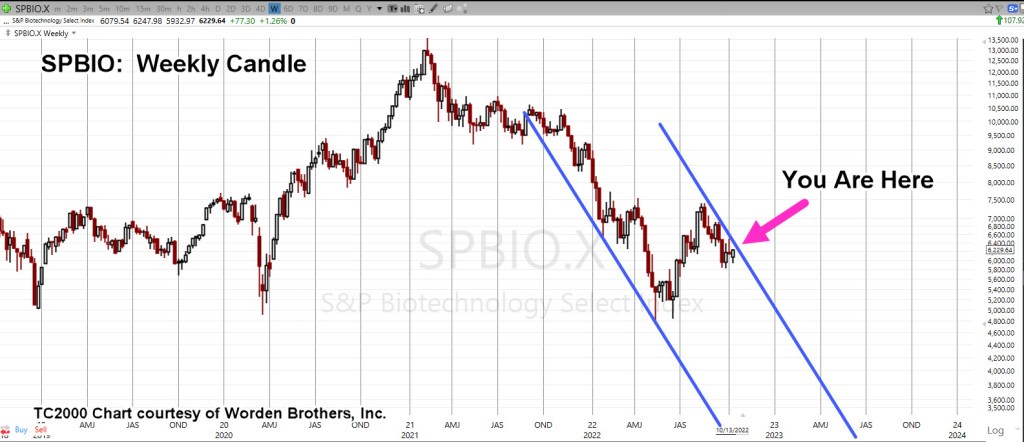
Shown below, it’s in a trading channel with price action at the right-side channel line.

Gold (GLD) Weekly

The chart below gets closer-in.

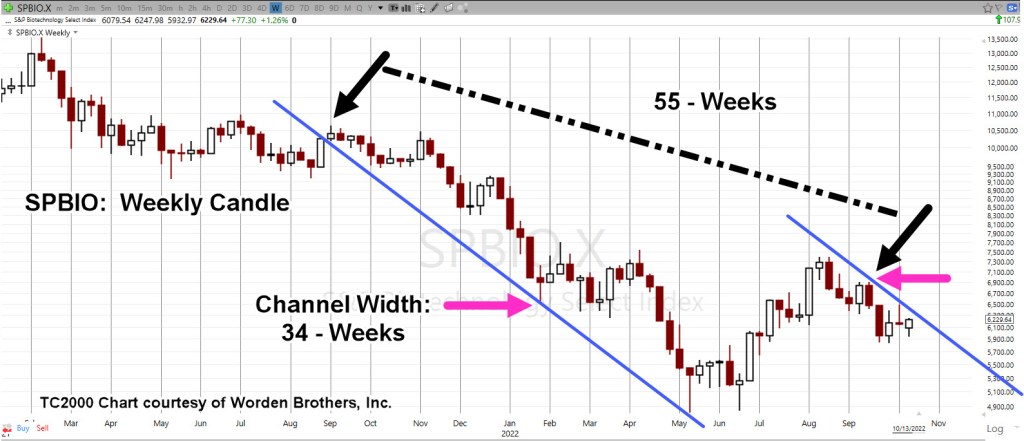
From left-most contact point on the channel to the initial contact on the right side is a Fibonacci 13-weeks.

Also note, the weekly high posted at the center line is a Fibonacci 5-weeks from the left-most contact.

Highly emotional markets tend to adhere to Fibonacci until either the emotion wears off or ‘everybody’ recognizes the structure.

Obviously, to keep the channel intact, a lower open (and lower action) at the next session is needed.

Silver (SLV) has already been discussed in this update and this one.

Bond (TLT) Capitulation ?

Was this past Friday the day?

Gap-down trading on huge volume.

Looking at the daily chart of TLT below, Friday’s level of (down) volume has occurred only three times in the past three years.

Each time, there was a near immediate rebound or in the case of March 2021, the rebound came several weeks later.

Bonds (TLT) Daily

Moving in closer, we see the possibility of an ‘island-gap’ at the next open.

What could drive capital into the bond market?

Well, how about a ‘shock’ or continued market melt-down (not advice, not a recommendation).

A quick check of the local newsfeed (as of 12:45 p.m., EST) shows nothing on the horizon other than usual nuclear attack threats, power outages, child mutilation protests, marauding bears and the disarmament of Canadians.

Nothing to see here …
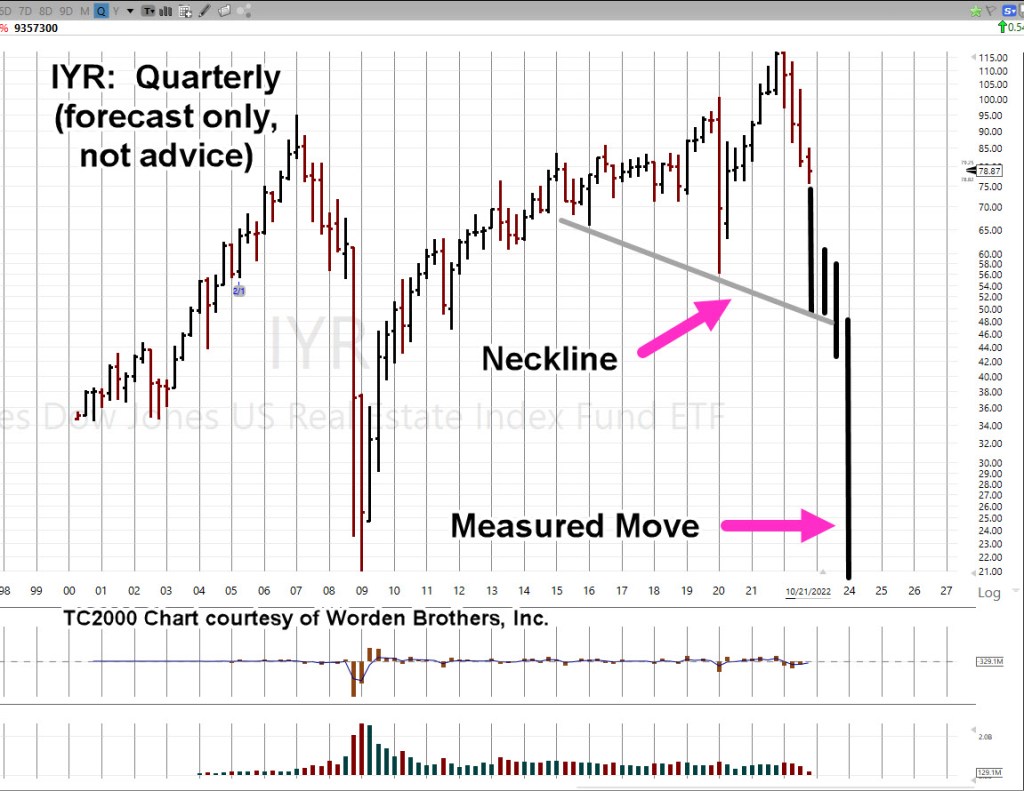
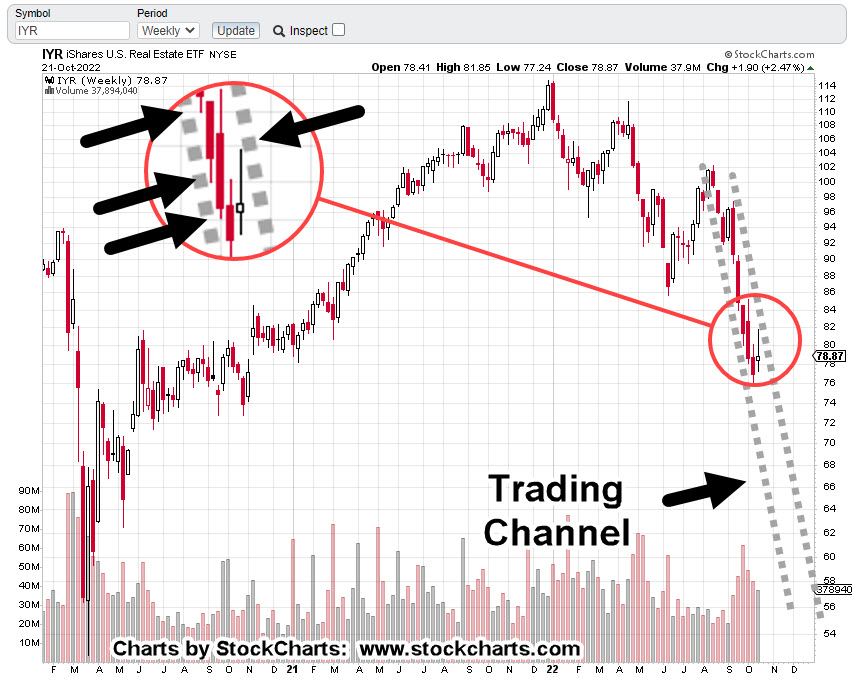
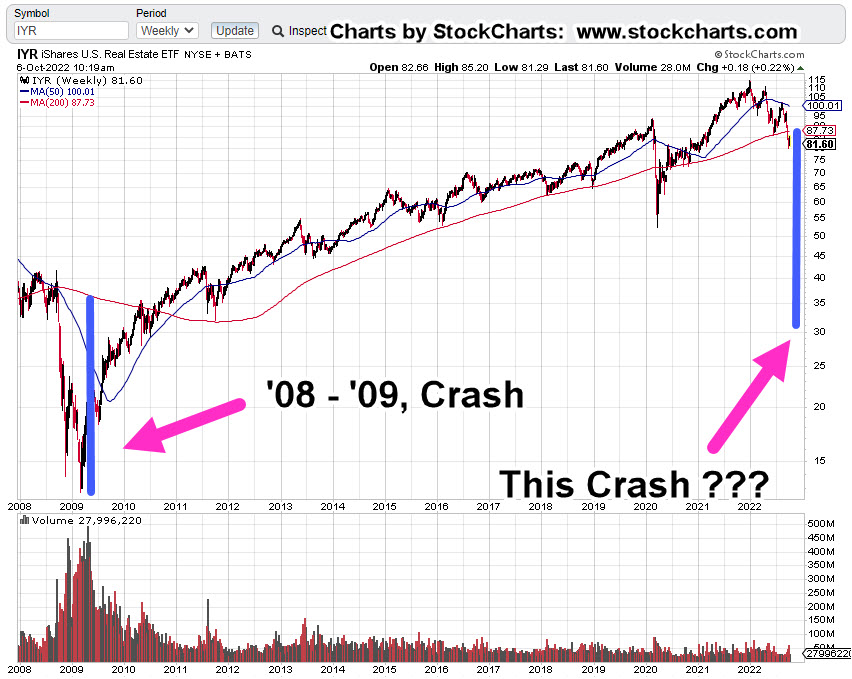
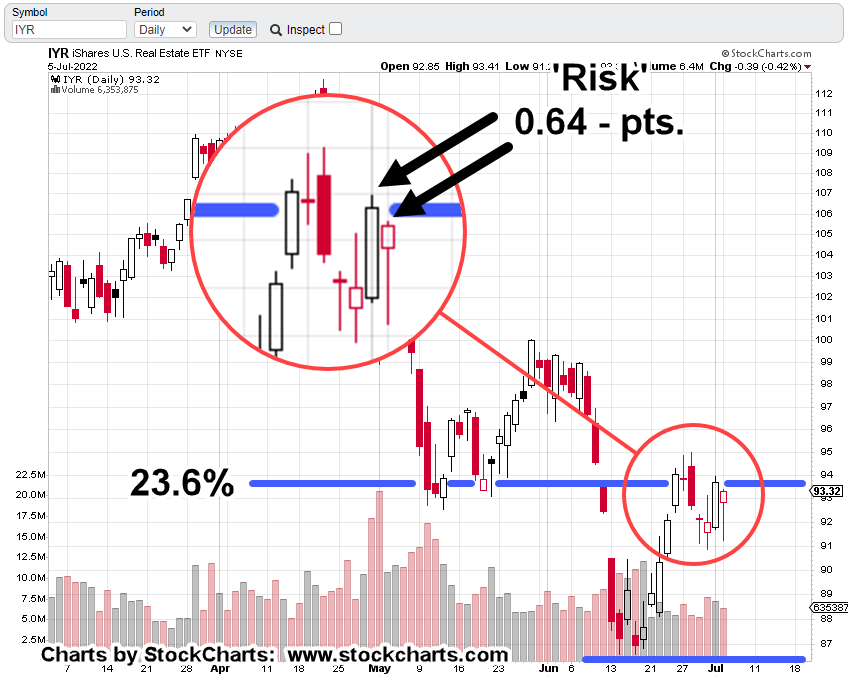
Real Estate

There is no mistake, events in real estate are happening at the fastest pace in recorded history.

As Scott Walters put it, over 10-million people bought into the ‘work from home’ hype and got themselves instantly (nearly) upside down in their transaction.

Now, the layoffs start.

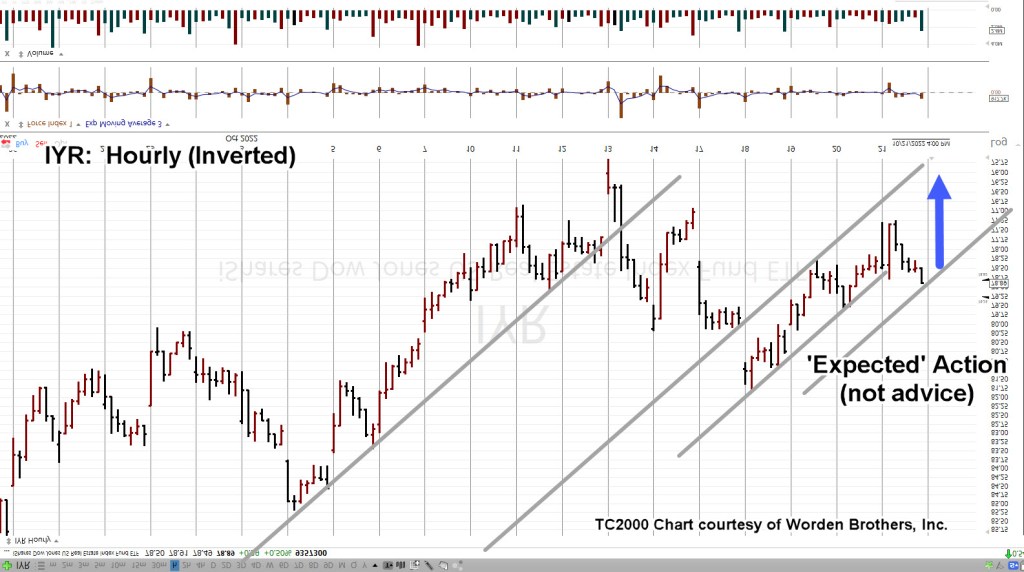
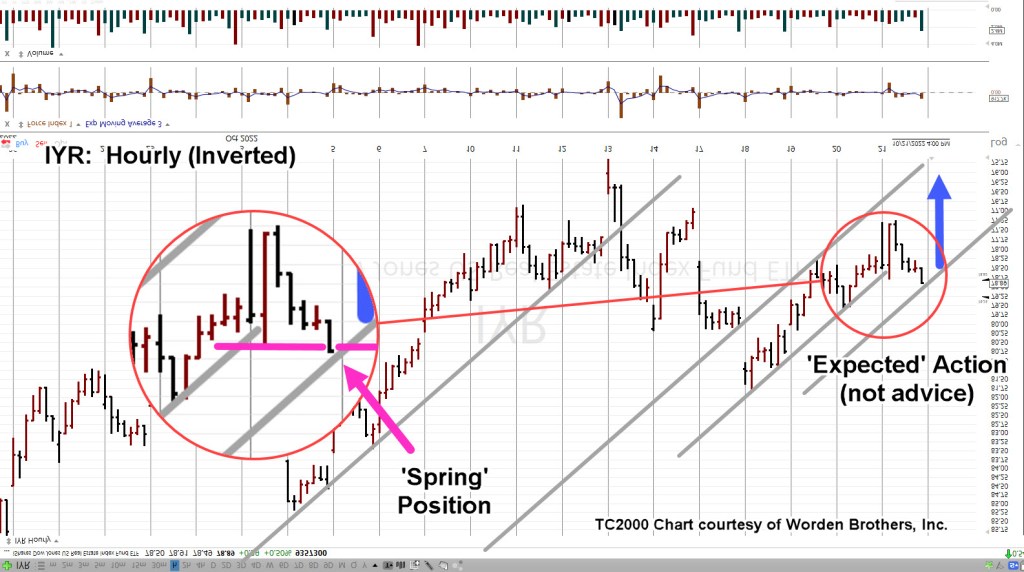
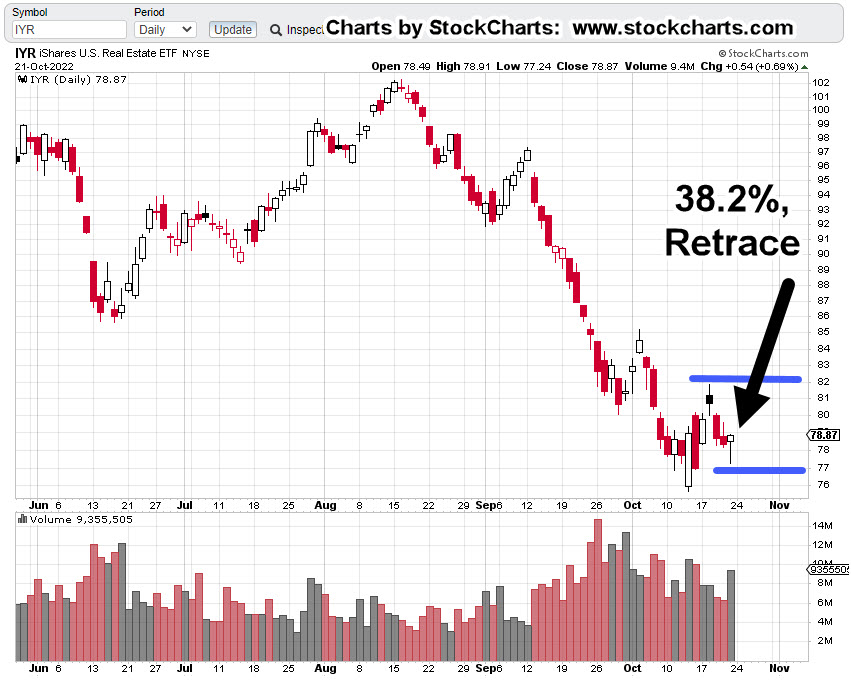
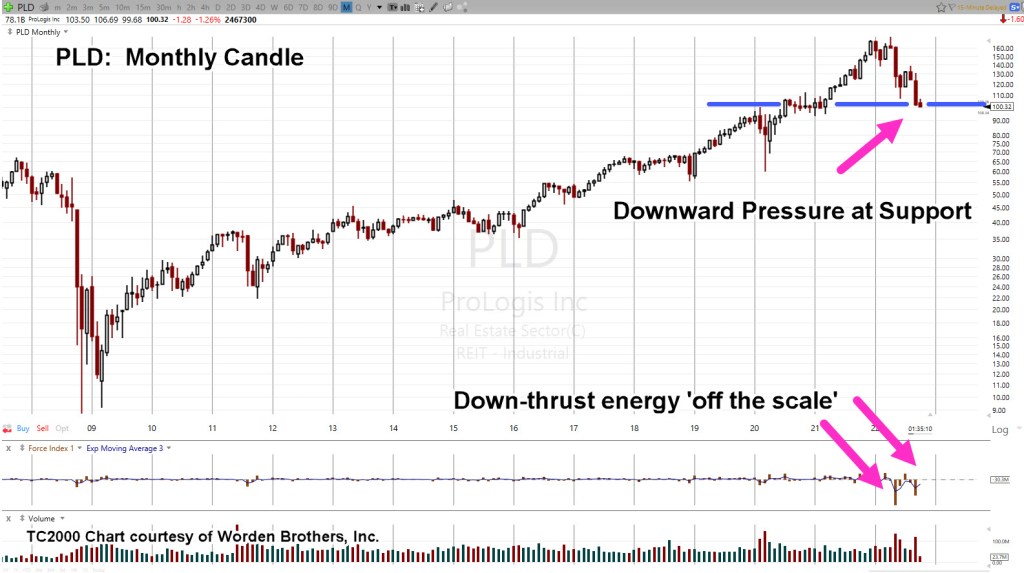
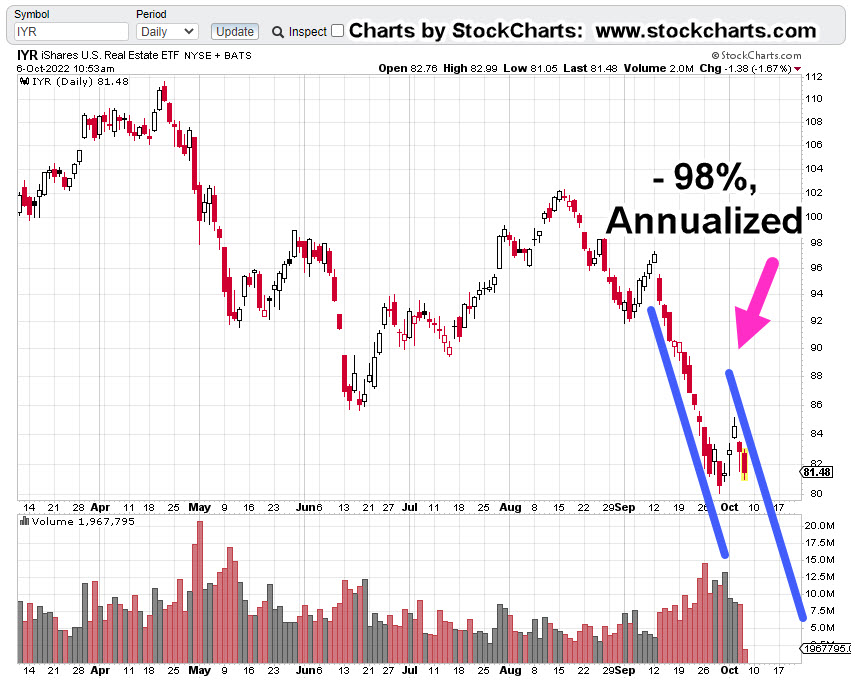
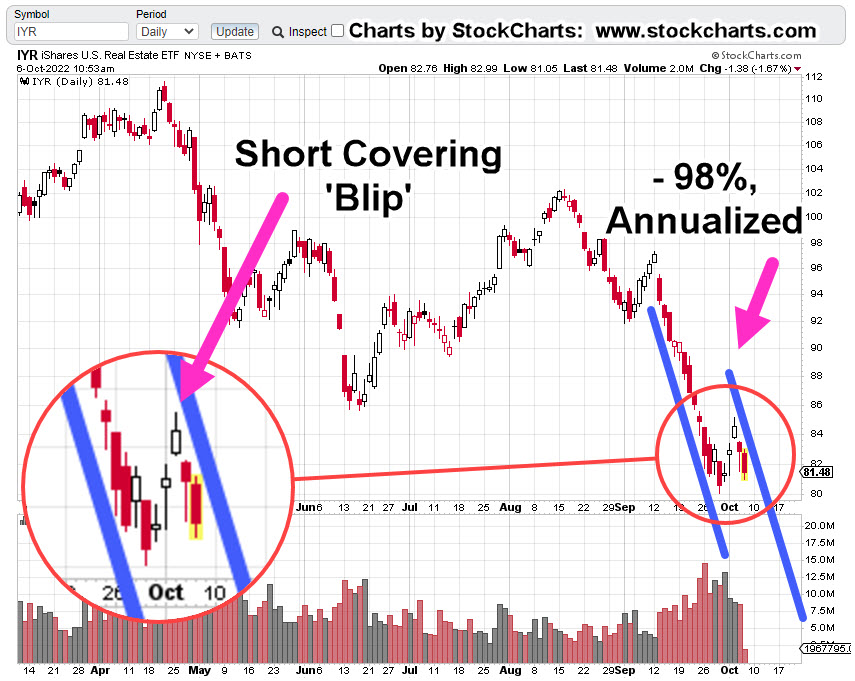
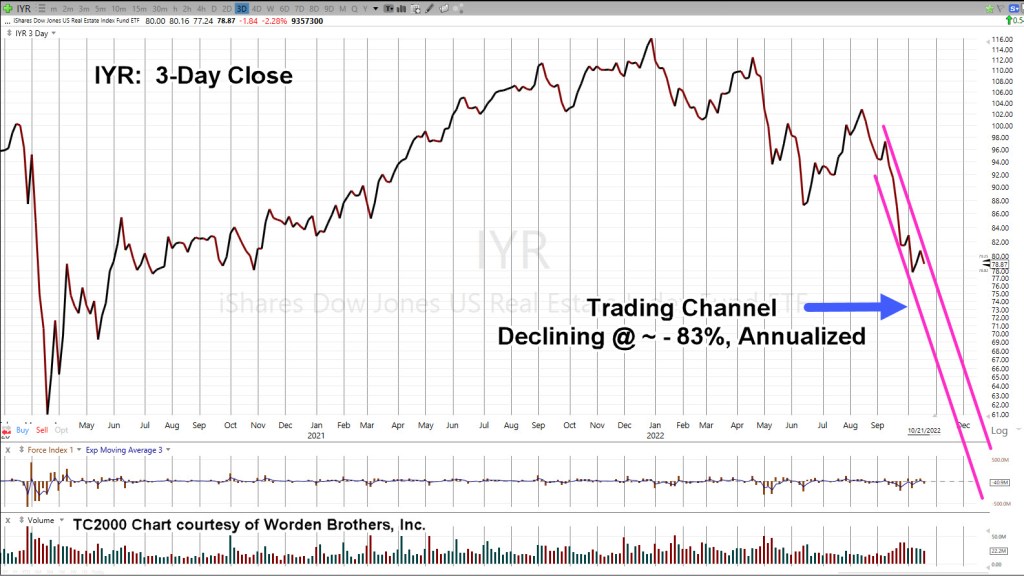
Real Estate IYR, 3-Day Close

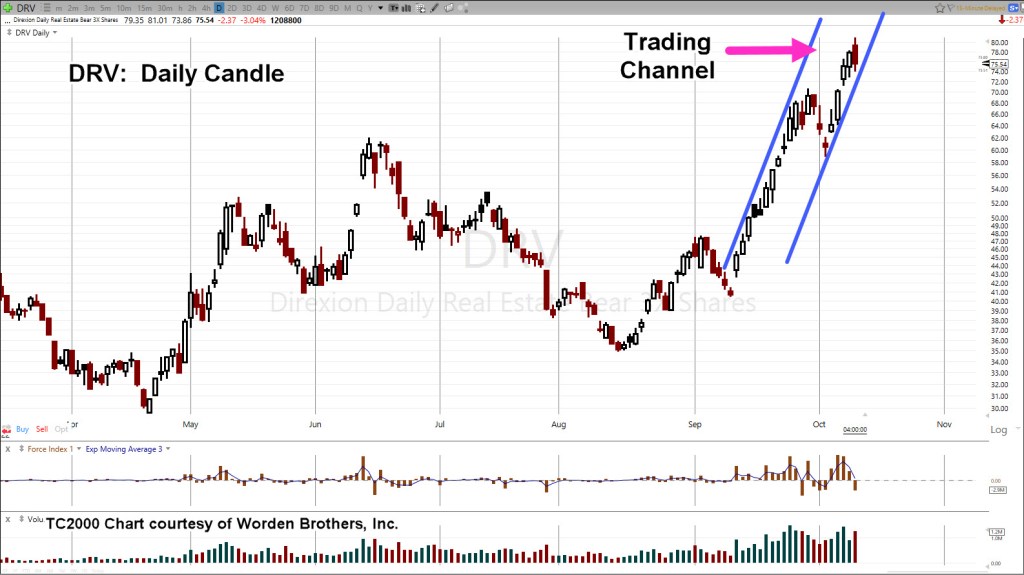
Zoom-in, on the channel

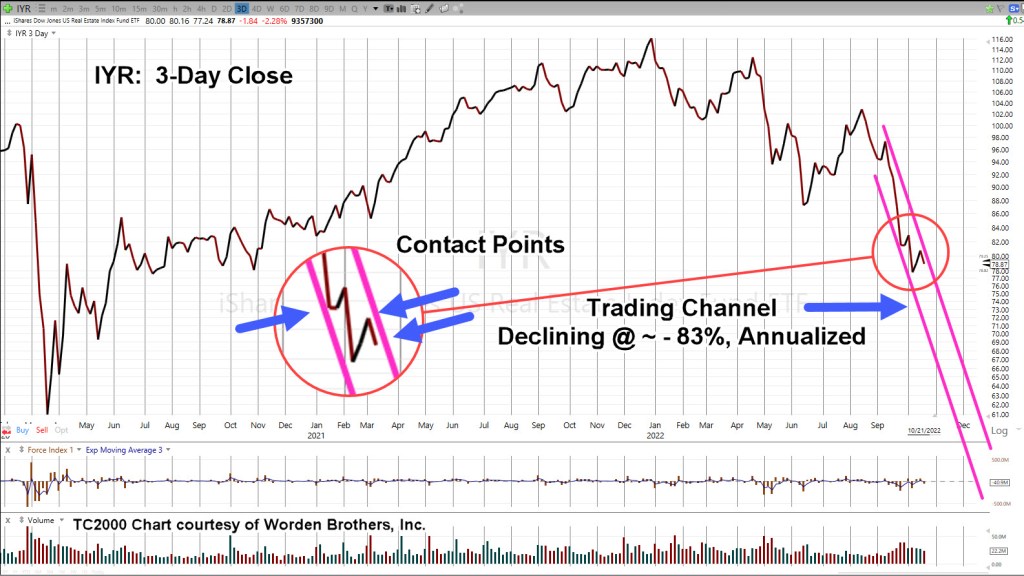
As the last update said, we’ll know soon enough if there is more upside or if last Friday was it, and the downdraft continues.

Stay Tuned

Charts by StockCharts

Note:  Posts on this site are for education purposes only.  They provide one firm’s insight on the markets.  Not investment advice.  See additional disclaimer here.

The Danger Point®, trade mark: No. 6,505,279

Set-Up Details … Real Estate

At A ‘Confluence’

The last update, posted late in the session, said with the upward bias provided by the sizable Op-Ex event, we can look for the weakest (or one of the weakest) sectors.

The chart below summarizes yesterday’s action:

Friday 10/21/22, Single Day Gains

Gold miners GDX, is the outlier at the top and real estate IYR, the outlier at the bottom.

Before anybody gets excited about ‘hyperinflation’, just a reminder; silver SLV’s, action has retraced to a weak 38.2% (chart not shown), as it was forecasted to do from last week’s update:

“Silver (SLV) is currently at support levels; therefore, some upward action (staying below SLV: 18.5) is normal behavior.”

Price action is the final arbiter; we’ll see what happens next.

Back to real estate.

Professional Wisdom: ‘The Crash’

We’re going to use the experience and insight provided by Scott Walters concerning the potential for real estate; that is, we’re in a world-wide event the scale of which, no one alive (and possibly, ever) has seen before.

The Economic Ninja has just seconded that opinion (time stamp 3:45) with his quote:

“Right now, we are in the greatest collapse since The Great Depression; and I believe it will be as severe, if not worse, sharper, faster, than what people experienced in 1929”.

So, what would that ‘collapse’ look like on a chart of real estate, IYR?

Ah, yes. That’s the hard part.

To take useful wisdom like that above, and somehow map it into potential market behavior.

For that, we’re going to use the Quarterly chart of IYR.

Real Estate IYR, Quarterly

There are still two months and one week left to go in the 4th, Quarter.

We’re at a confluence of price action as we’ll cover in the Hourly chart farther down; first, what’s the potential?

Here is one artist’s rendition (not advice, not a recommendation).

That puts it into perspective.

We may know at the very next open, if we’re pivoting higher or continuing the decline.

Butterfly In The Amazon

Of course, the market’s not going to tell anyone its next move. We have to decipher that (read the tape) ourselves.

Sometimes, as Wyckoff said a century ago … ‘It’s as if the weight of a feather is all that’s needed, to push the market further or to reverse.’

So, let’s look at that feather (the butterfly) on the hourly chart.

Since we’re positioned short (DRV-22-05), the chart’s inverted to mimic leveraged inverse fund DRV.

Real Estate IYR, Hourly (Inverted)

The important part is we see a repeating pattern of trendlines.

Moving in closer, we have this. The blue arrow is ‘expected’ action based on the analysis up to this point (not advice, not a recommendation).

Moving even closer, the zoom shows IYR, finished the day in Wyckoff spring position; having pushed past minor support (resistance on non-inverted).

Summary

If IYR opens lower or gap-lower, we’ll have to wait and see if it posts a new daily low (below IYR ,77.24).

If that happens, we have some confirmation lower prices are ahead and can then set a definitive stop for DRV-22-05.

Obviously, a higher open (pushing past IYR 78.91), negates the trade.

Stay Tuned

Charts by StockCharts

Note:  Posts on this site are for education purposes only.  They provide one firm’s insight on the markets.  Not investment advice.  See additional disclaimer here.

The Danger Point®, trade mark: No. 6,505,279

Real Estate … The Set-Up

Looking For The ‘Reversal’ To Fail

The $2-Trillion Op-Ex today, provided upward bias for the overall markets.

Not expected, was biotech SPBIO, to be part of that move.

After today and possibly because of this announcement, we’re out of the sector until price action demands attention.

While the Dow, S&P, NASDAQ were up significantly for the day, obviously absent, was real estate (IYR).

Days like today help narrow the focus. Who is not participating in the up move?

While the other indices are up multiple percentage points, IYR, finished the day up only +0.69%.

Real Estate (IYR) Weekly

The prior linked YouTube post from Scott Walters is not the premise for going short (not advice, not a recommendation).

It is, however, a reminder that what’s going on, is at a level no one has seen before.

Unless IYR, somehow gets out of the channel, it’s declining at -84%, annualized.

The set-up for this short trade (DRV-22-05) is based on a weak retrace (to 38.2%) on the daily with the anticipation, today’s reversal bar will ‘fail’ at the next session.

Real Estate, (IYR) Daily

The expectation for the next session is straightforward; lower open or gap-lower open and posting a new daily low.

The chart of IYR below, shows what we’re looking for (not advice, not a recommendation).

Obviously, a new daily high at the next session negates the set-up and warrants a trade exit.

A new daily low and we’ve got a ‘failure’ of the reversal bar; DRV-22-05, is liklely to be increased (not advice, not a recommendation).

Stay Tuned

Charts by StockCharts

Note:  Posts on this site are for education purposes only.  They provide one firm’s insight on the markets.  Not investment advice.  See additional disclaimer here.

The Danger Point®, trade mark: No. 6,505,279

Position Changes

Courtesy Update: 2:38 p.m., EST

Charts to be posted in a subsequent update.

Biotech is not behaving as expected; LABD-22-08, has been exited completely with an overall profit of about +8.5%.

We all know that real estate is in the largest bubble in U.S. history … and that’s not hyperbole.

With today’s upward bias in the market and IYR, not responding in kind (remaining weak), a position has been opened in leveraged inverse, DRV @ 74.53 (not advice, not a recommendation).

Price action in IYR, could still pressure somewhat higher into the close; thus, DRV would decline but the anticipation is if so, not by much.

Trade is labeled as DRV-22-05; stop is TBD, to be provided after the close.

Stay Tuned

Charts by StockCharts

Note:  Posts on this site are for education purposes only.  They provide one firm’s insight on the markets.  Not investment advice.  See additional disclaimer here.

The Danger Point®, trade mark: No. 6,505,279

The Market Set-Up … This Week

What To Watch

First off, it’s nice to know, traders at J.P. Morgan, don’t have clue as what to do.

They say it themselves; Not One Person

On top of that, I’m supposed to pay money reading about how clueless they are. 🙂

No thanks. Let’s see if we can do better than the average ‘investment firm’.

Before we get started, a reminder; as Michael Cowen says:

‘It’s the bear market that reveals those who really understand’, not the bull market ‘geniuses‘.

With that, let’s get into it; first up, is silver.

Silver: Wyckoff Analysis Results

The downside reversal was identified to the day.

Adding to that post, Europeans could not only be freezing or starving this winter, but also subject to radiation poisoning.

Surely, they’re all thinking that ‘stack’ of silver is going to save them.

Silver (along with gold) remain trending lower.

Silver (SLV) is currently at support levels; therefore, some upward action (staying below SLV: 18.5) is normal behavior.

Bonds: Are They Ready?

Hold your nose … bonds could be setting up for a rally.

As Steven Van Metre reports here, the Fed ‘shenanigan’ meter is pegged.

Bonds, TLT Weekly

Note, the bullish TLT, set-up is not confirmed until MACD ticks higher (not advice, not a recommendation).

Also note the repeating pattern of ‘spring to up-thrust‘.

Last up, biotech

Biotech SPBIO, Hourly (Inverted)

We’re going to use the chart from yesterday’s post to set the stage for getting closer-in.

This past Friday’s early morning ‘spike’ is barely visible; the 30-minute (inverted) chart below, has more detail.

SPBIO, 30-minute (Inverted)

Price action rejected the lower levels (higher on SPBIO) and pulled away throughout the session. That ‘pulling away’ continued on, all the way into the close.

That’s a clue there may be follow-through at the next session.

If the early session opens ‘gap-higher’ (SPBIO, lower), into the resistance area (four magenta arrows, hourly chart), it would be the fourth time pressuring at this area; markets rarely hold a fourth attempt.

Summary

Of course, other markets are being watched like real estate (IYR), Tesla (TSLA), and even Basic Materials (DJUSBM), a potential sleeper for significant downside.

Updates are planned if/when low risk shows up.

Positions: Current Stance (courtesy only, not advice).

The following is the positioning of my firm’s main (largest) account.

LABD-22-08:

LABD Entry @ 25.1278, 24.735, 26.025, 22.99, 22.29***, Stop is @ LABD 21.23***

***, Indicates change

Note: Positions may be increased, decreased, entered, or exited at any time.

Stay Tuned

Charts by StockCharts

Note:  Posts on this site are for education purposes only.  They provide one firm’s insight on the markets.  Not investment advice.  See additional disclaimer here.

The Danger Point®, trade mark: No. 6,505,279

Wheels Come Off … Biotech

Unraveling, Quickly

This just out on ZeroHedge:

An Epoch Times article, using excerpts from a Lancet Report, linked here.

It’s best to let the reader sort out what it all means, arriving at one’s own conclusions.

Of course, the obvious problem, the ‘elephant’ is not addressed directly.

However, VAERS is quoted in The Epoch Times article, thus giving it legitimacy.

Leading The Downside

For some time, this site’s highlighted, biotech (SPBIO), as unique to all other indices save GDX, and GDXJ.

That is, it’s down the most since the bear market started.

As of today’s close, it’s down over – 54%, from all-time highs while the S&P is down only – 23.7%.

As documented over several years, the sector’s unique; it’s at risk (more than other indices) to implosion.

With today’s close, it looks like we’re at a critical juncture.

Biotech SPBIO, Weekly

The unmarked weekly chart

Compressed, with added trendlines.

It’s an obvious trading channel of immense size … but so is nearly everything else concerning these markets. We’re operating at unprecedented scale in unprecedented times.

But wait, there’s more.

The trading channel has Fibonacci time correlation(s).

We’ll expand the weekly chart for more clarity.

From channel entry, week ending 9/3/21, to the right-most contact point (week ending 9/16/22), is Fibonacci 55-Weeks.

Channel width measured from week ending 1/28/22, to the same contact-point, week ending 9/16/22, is a Fibonacci 34-Weeks.

We’re at The Danger Point®

Positions & Current Stance (courtesy only, not advice).

The following is the positioning of my firm’s main (largest) account.

DRV-22-04:

Entry @ 66.463, Stop @ 63.98

Discretionary exit (today) @ 75.96***

Trade Closed

LABD-22-08:

Entry @ 25.1278, 24.735, 26.025***, 22.99***, Stop is Open (to be set at next session)

***, Indicates change

Note: Positions may be increased, decreased, entered, or exited at any time.

Stay Tuned

Charts by StockCharts

Note:  Posts on this site are for education purposes only.  They provide one firm’s insight on the markets.  Not investment advice.  See additional disclaimer here.

The Danger Point®, trade mark: No. 6,505,279

Real Estate Crash … Exit Targets

The DRV, Exit(s)

Well-calculated stops, (mostly) take care of trade implosion. So, where’s the exit?

The answer is there’s no set answer.

We’ll explain that by using the current plan for DRV-22-04 (not advice, not a recommendation).

Questions

First question to determine an exit in this case, is to ask:

“What are the media pundits, and/or ‘experts’ talking about right now?”

Well, that’s easy.

Just like the ‘silver squeeze’ idea that won’t go away (even as SLV continues downward), the ‘Fed pivot‘ is another delusion that keeps holding on.

As parts of the market (like IYR) continue their free-fall, all eyes are on the next Fed meeting; waiting for them to pivot and ‘save us’.

Right around November 1st, or 2nd, seems like it can’t help but be some kind of emotional cathartic set-up.

Unless stopped out ahead of time, the plan, is to plan an exit within that window.

Let’s go to the IYR, 3X Leveraged Inverse fund DRV.

IYR, 3X Inverse, DRV, Daily

At the end of today’s session DRV has posted a downside reversal candle.

The next session will be important.

We either have follow-through to the downside, thus validating the reversal (and exit of the position) or we have some variation of an inside day or new daily high.

If the trading channel remains valid, the compressed chart below shows a potential exit range: DRV 140 – 200.

During the next session(s), if DRV, posts a new daily high (unless stopped), the DRV-22-04, stop will be moved to this session’s low @ 73.86

Positions & Current Stance (courtesy only, not advice).

The following is the positioning of my firm’s main (largest) account.

DRV-22-04:

Entry @ 66.463, Stop @ 63.98

ZSL-22-01:

Entry @ 28.08, Stop @ 28.53:

Discretionary exit (today) @ 31.5513***

Trade Closed

LABD-22-08***:

Entry @ 25.1278 (yesterday) and 24.735 (today), Stop @ 22.59

***, Indicates change

Note: Positions may be increased, decreased, entered, or exited at any time.

Stay Tuned

Charts by StockCharts

Note:  Posts on this site are for education purposes only.  They provide one firm’s insight on the markets.  Not investment advice.  See additional disclaimer here.

The Danger Point®, trade mark: No. 6,505,279

ProLogis … Real Estate Proxy

The Work Has Already Been Done

This is how it pays off.

Work was done months ago, on ProLogis (logistics/warehouse, real estate) which at the time, was the largest cap in the IYR.

It’s now No.2, just behind AMT, but the effort is still valid.

From that post last May, the behavior of ProLogis during a bear market was summed up with the following:

“It’s straightforward.

Using 2008 – 2009, timeframe as the proxy, PLD was vaporized; straight down for two-months.”

Well, that was back in ’08 – ’09.

Let’s see how our ‘vaporization’ is going now.

ProLogis PLD, Monthly

Price action is at support.

Downward pressure is immense.

We should all be able to agree, this time is worse than last time (’08 – ’09).

There’s no money left for a ‘save’, and our chief cook and bottle washer, the Fed, seems to be on a different agenda.

So, let’s remind ourselves of the potential for this down-move should it come to fruition.

The weekly chart of PLD, and distance traveled below the 200-wk Moving Average, gives us a sense of the enormity.

ProLogis PLD, Weekly

To position for a potential event, there may be plenty of time, or no time.

Either way, when things really get started to the downside, confusion, panic, locked-up brokerages, internet outages, will likely be the norm.

Positions & Current Stance (courtesy only, not advice).

The following is the positioning of my firm’s main (largest) account.

DRV-22-04:

Entry @ 66.463, Stop @ 63.98

ZSL-22-01:

Entry @ 28.08, Stop @ 28.53***

***, Indicates change

Note: Positions may be increased, decreased, entered, or exited at any time.

Stay Tuned

Charts by StockCharts

Note:  Posts on this site are for education purposes only.  They provide one firm’s insight on the markets.  Not investment advice.  See additional disclaimer here.

The Danger Point®, trade mark: No. 6,505,279

Real Estate ‘Crash Channel’

Not Saying That Lightly

For real estate, the crash may be happening as we speak.

Even if it’s not, the sector (IYR) has developed an aggressive trading channel as we’ll see below.

First, we’ll look at ‘big picture’ potential on the weekly chart.

Real Estate IYR Weekly

The distance traveled from the 200 Week Moving Average during the crash of ’08 – ’09, is shown.

That same distance is projected on the current situation.

Everybody’s ‘looking for the bottom’ … well, there it is. 🙂

Of course, that’s only a potential bottom.

Where it gets really scary is the channel that’s been confirmed on the daily chart, shown below.

The zoom version shows the weak blip higher … potential short covering that looks complete.

One caveat is that as (or if) IYR price action approaches the lows, technically speaking, it’s a support level.

That’s the time to watch the right-side channel line to see if it’s penetrated, thus negating the aggressive downtrend.

Positioning

Everyone has their own style and this is NOT financial advice.

However, a short was initiated early this session in Leveraged Inverse Fund DRV, labeled DRV-22-04.

Opened @ 66.4633, with a stop at session low, 63.98

Stay Tuned

Charts by StockCharts

Note:  Posts on this site are for education purposes only.  They provide one firm’s insight on the markets.  Not investment advice.  See additional disclaimer here.

The Danger Point®, trade mark: No. 6,505,279

“The Big One” for Real Estate

Subtle Clues, Time’s Up

‘Sometimes it seems as if the market hangs in the balance by the weight of a feather.’: Wyckoff, circa 1910.

Is this the big reversal to the downside?

Before we get to that answer, let’s review two recent market pivots (including today).

A Day To Remember

Back on May 4th, the post with the same title, linked here, was to be used for reference on a go-forward basis.

The post has a linked article, whose comment section could be surmised as the bourgeois rebuke of a 78-year-old fund manager.

That manager was quoted as saying, “It’s the biggest bear market of my life”; to which the younger crowd responded with derision, effectively saying the old man’s a dolt, an idiot, a doofus and needs to retire.

Now that time has passed, let’s remind ourselves when the quote was published with the daily (IYR) chart below.

Not only did IYR, not close higher after that, it never printed higher either. It was the top of the pivot reversal, to the day.

The 23.6%, Retrace

Then we have this report just days ago, showing IYR’s price action coming back to a (very weak) Fibonacci 23.6%, retrace.

The daily chart repeated below, showed the ‘risk’ on a short position as approximately 1.04-pts (not advice, not a recommendation).

Risk Narrows Even More

As a result of today’s new daily low and lower close, one can (theoretically) reduce the risk of a short position even further (not advice, not a recommendation).

The risk is now defined as the distance between today’s close (IYR: 93.32) and Friday’s high of IYR: 93.96

A subsequent push above Friday’s high negates the short and would likely indicate a potential move to a 38.2%, retrace.

Subtleties of The Market

A lower daily print and marginally lower close (IYR down just – 0.39-pts.) does not look like anything of consequence.

We’ll see about that, at the next session.

Stealth Crash?

Lastly, we have this and especially this.

Could we be right in the middle of a historic crash and not even know it?

Of course, it’s never for sure, until it’s over.

However, if shorting opportunities are being spotted, entered, and managed correctly, probabilities are that one will already be positioned short when ‘the big one’ hits.

Stay Tuned

Charts by StockCharts

Note:  Posts on this site are for education purposes only.  They provide one firm’s insight on the markets.  Not investment advice.  See additional disclaimer here.

The Danger Point®, trade mark: No. 6,505,279

Active: Positioned short via SRS (SRS-22-01), with stop at SRS: 16.38