Note: Posts on this site are for education purposes only. They provide one firm’s insight on the markets. Not investment advice. See additional disclaimer here.
Unfortunately, the (mad scientist) graphic at left, is not too far removed from what’s really going on in biotech.
While the S&P, Nasdaq Qs, Gold Miners, Semiconductors, Financials, The HOOD, ORCL, and others, continue to make all-time highs, conspicuously absent is biotech, XBI and IBB.
Now, it appears that quietly, in the background, XBI is reversing to the downside.
Biotech XBI, Daily Close
The up-thrust is there, but is a weak penetration of resistance.
Even so, on the ‘test’, volume contracted by -49.24%, when compared to volume on the upside penetration.
Until proven otherwise, this set-up appears to (currently) be the best short opportunity.
With that said, all other short positions have been closed to focus on biotech.
Leveraged inverse fund LABD is being used at this juncture: Trade LABD-25-10, with stop at the session low (not advice, not a reocmmendiaton).
Note: Posts on this site are for education purposes only. They provide one firm’s insight on the markets. Not investment advice. See additional disclaimer here.
Note: Posts on this site are for education purposes only. They provide one firm’s insight on the markets. Not investment advice. See additional disclaimer here.
The Russell 2000 has been recovering (along with the rest of the major indices) from the lows posted on April 7th, and 9th, this year.
What the index has not done, unlike the Qs, and the S&P is post new-all-time highs.
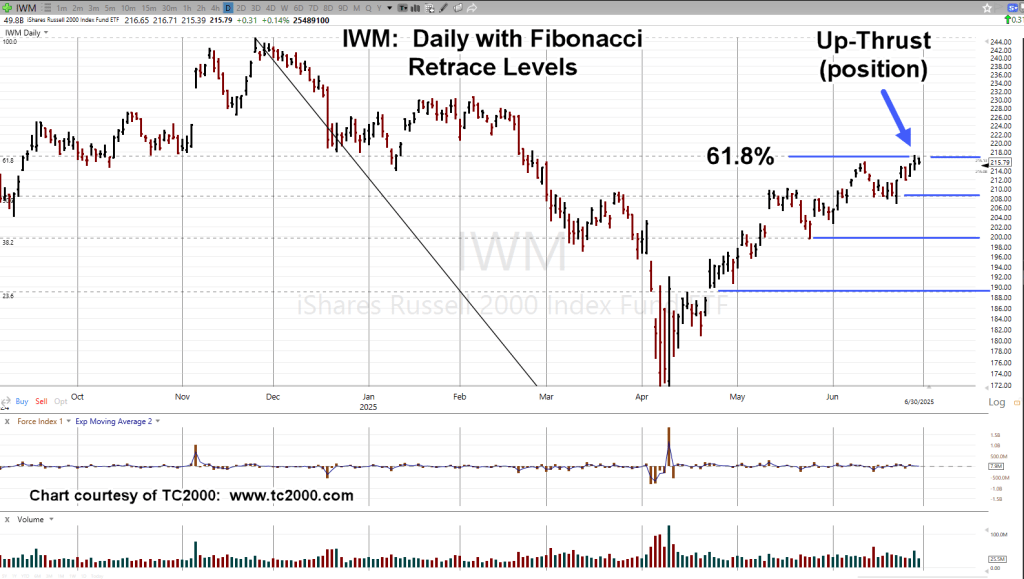
At this juncture, tracking fund IWM, is at a Fibonacci 61.8%, retrace, and giving just a hint, it might be finished with further upside.
Russell 2000 ETF, IWM, Daily
As the chart notes, we’re in up-thrust ‘position’; meaning, there’s no new daily low to help confirm a potential reversal.
As presented many times in previous posts:
‘In the markets, you’re either early, or late’.
Upside risk (on a short) is set at last Friday’s IWM high; risk is low (but not zero).
With that said, a short position was opened (after-hours session, yesterday) in the IWM, via leveraged inverse fund TZA, trade TZA-25-03 (not advice, not a recommendation).
Note: There was no ‘new daily low’ in the IWM tracking fund to ‘confirm’.
However, in the pre-market, IWM is trading lower at 214.72, and threating to post a new daily low at 214.13.
Open Positions
At this juncture, 8:50 a.m., EST, open positions are as follows (not advice, not a recommendation).
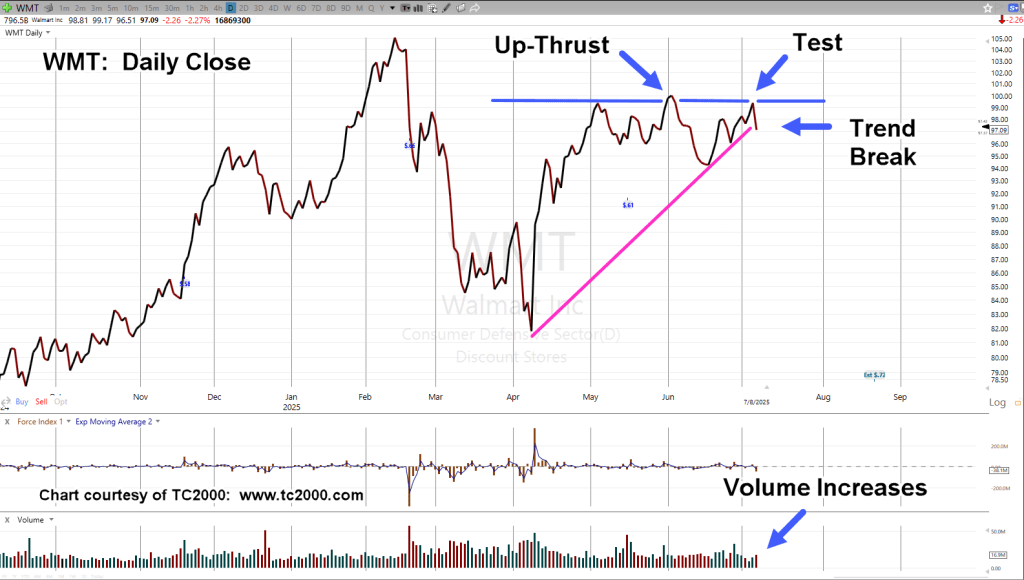
Short Wal-Mart: WMT-25-03, Stop @ 98.16
Short Tractor Supply Co.: TSCO-25-01, Stop @ 52.93
Note: Posts on this site are for education purposes only. They provide one firm’s insight on the markets. Not investment advice. See additional disclaimer here.
The Good: Only the Senior Miners, GDX, have managed to claw their way past the highs set nearly five years ago in August of 2020.
The Bad: Junior Miners GDXJ, remain below that August ’20, level.
The Ugly: Silver Miners SILJ, are the worst, having their peak a bit later in February of 2021; they remain over -35%, below their highs.
The Market Rolls Over
Yesterday, Friday, was a down day for the Dow, S&P, The Qs, Transports, Airlines, Semis, nearly everyone.
For some of these indices, their all-time highs were posted months, if not years ago.
There may be some (bidding) ‘defensive’ action with gold (GLD) continuing higher; as said in earlier posts, the rest of the monetary metals are far below their highs.
Let’s look at the weakest; the silver miners, as they are likely going to be the ones most affected by an economic decline (not advice, not a recommendation).
Silver Miners, SILJ, Daily
We’re at an interesting spot.
Friday was a down day that pushed below existing support, shown in zoom area.
We have simultaneous action.
Once resistance was penetrated on March 18th, it could not hold. After eight trading days, on Friday, it posted lower on heavy volume.
However, we can see that SILJ, is now in (a minor) Wyckoff ‘spring’ position. So, the question is, what happens next?
Note: Posts on this site are for education purposes only. They provide one firm’s insight on the markets. Not investment advice. See additional disclaimer here.
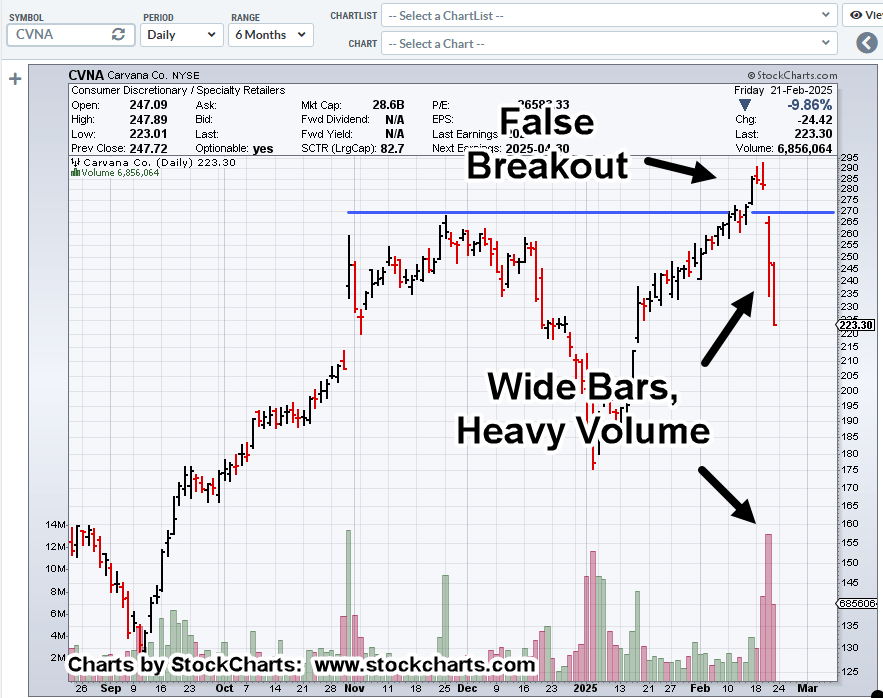
That is, finishing its initial downward thrust, then a retrace to test the wide bar(s), high volume.
Carvana CVNA, Daily
On a percentage basis, CVNA has weaker action (which may not be finished) than NVDA.
The ‘Short’ Side
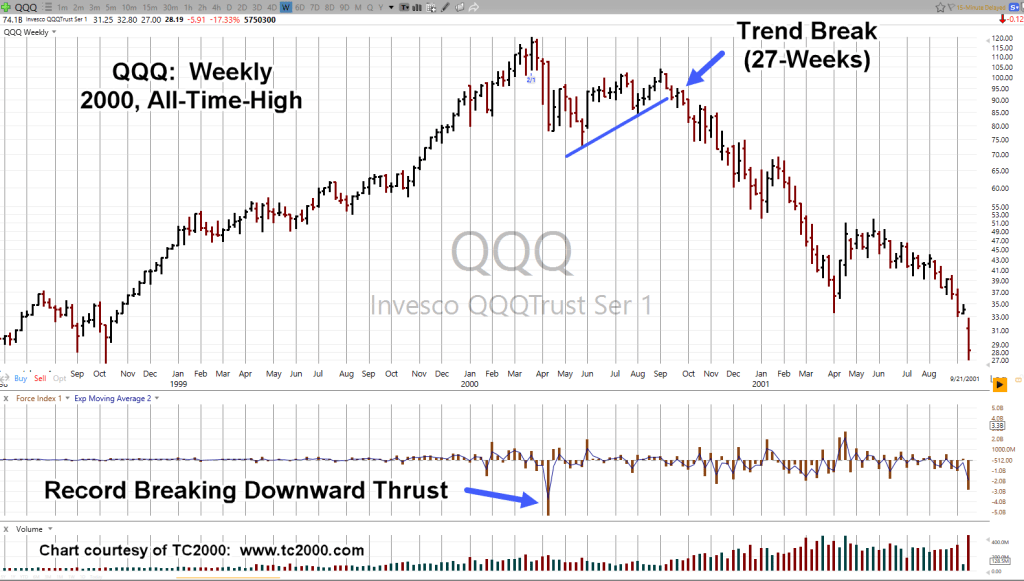
If the market begins a persistent decline, will the SEC ban short selling as it did in 2008, link here.
It’s important to note, immediately after that announcement, the market absolutely cratered on massive volatility; the Qs dropped over -41%, from that point.
This time around (if it happens), with a new Sheriff, will there be a short-selling ban?
Note: Posts on this site are for education purposes only. They provide one firm’s insight on the markets. Not investment advice. See additional disclaimer here.
Note: Posts on this site are for education purposes only. They provide one firm’s insight on the markets. Not investment advice. See additional disclaimer here.
Note: Posts on this site are for education purposes only. They provide one firm’s insight on the markets. Not investment advice. See additional disclaimer here.
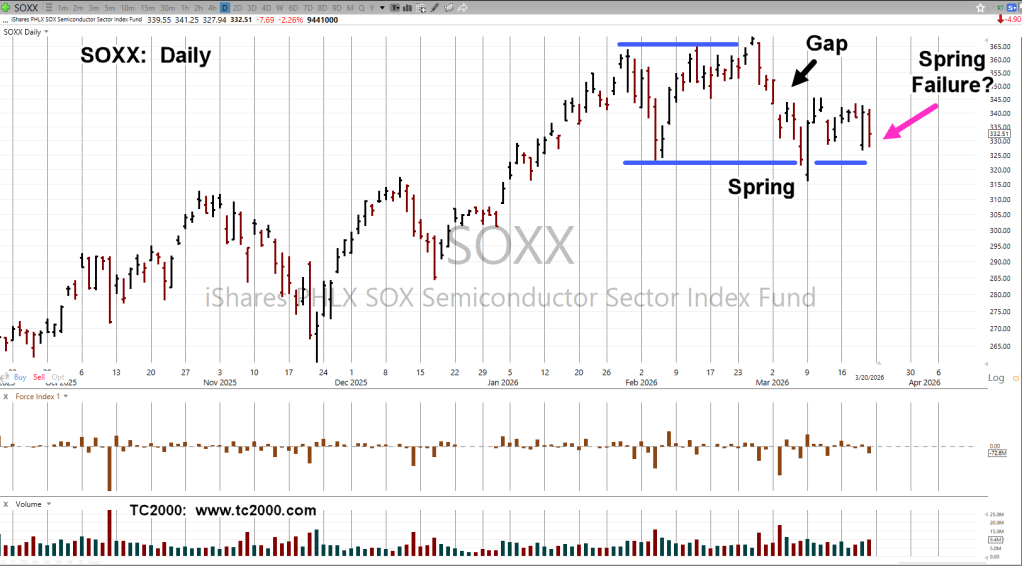
We’re still waiting for a more definitive short-sell signal on the SOXX, but it’s the QQQs that may be setting up first (not advice, not a recommendation).
The chart below shows the QQQ’s have essentially stopped dead right above resistance.
Upside force has gone missing.
Nasdaq QQQ, Daily
Price broke out above resistance (blue line) with upside pressure diverging.
Of course, anything can happen, and price could continue to drift higher.
However, if there’s a lower daily low and lower close for the next session, the risk on a short trade via QID or similar, is well established (not advice, not a recommendation).
Note: Posts on this site are for education purposes only. They provide one firm’s insight on the markets. Not investment advice. See additional disclaimer here.
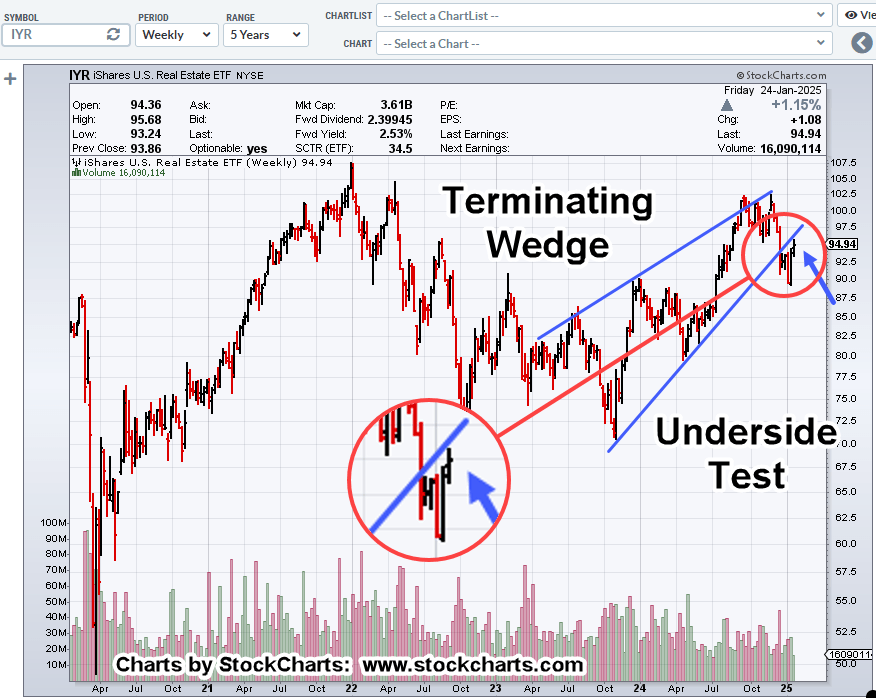
There tends to be a period of consolidation and organized chaos, before price action enters and exhibits channel behavior.
Of course, the problem from a trading perspective, be able to wait through the chaos getting to the set-up and that’s no small feat.
Several of the major indices are in a channel right now. Those are (ETF symbol) SPY, QQQ, IYR and IWM.
We’ll discuss the Q’s farther down but first, this just out, on ZeroHedge, concerning the overall economic conditions.
That is, we’re already in full scale economic collapse and they have the data to prove it.
As incredible as it may be, there are still sectors of the population that believe, ‘the consumer is strong’.
A big wake-up call is coming for them. Oh wait, is that a telephone ringing off in the distance 🙂
The media lies appear to be crumbling at an exponential rate; there’s no guarantee it’ll all hold together into late January, or mid-February as presented only yesterday.
From a Nasdaq (QQQ), technology sector perspective, we have the following.
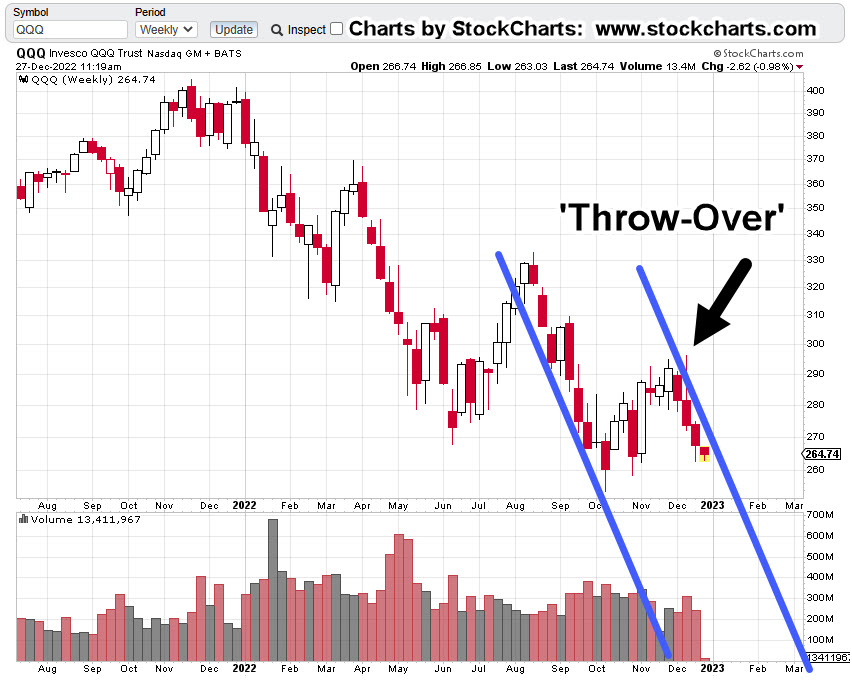
NASDAQ QQQ, Weekly
The Q’s began the week with a lower open and within the range of the prior week.
It’s a subtle clue the direction remains down and the market’s not volatile … just yet.
Next up, is the channel
It has the right ‘look’.
Moving in closer; the right-side trend line verification (hits).
There are no fewer than four weekly hits (including today) that verify the right side. The attempted push out of the channel is identified as the ‘Throw-Over’.
Attempted breakouts (and failures) are common market behaviors. We see that price action quickly got itself back into the channel.
Get In … Get Out
At this juncture, price action remains in the channel.
A short position (via QID, or equivalent) is a viable choice for the trader/speculator (not advice, not a recommendation).
For the reasons described above (the collapse), we appear to still be in the early stages of the down channel.
Obvious discretionary exit points for a short trade would be left side contact of the channel i.e., the ‘demand’ side or a decisive right-side breakout i.e., the ‘supply’ side (not advice, not a recommendation).
Summary
In a separate market, Netflix (NFLX), may have hit the right side of its own tend line as well.
Note: Posts on this site are for education purposes only. They provide one firm’s insight on the markets. Not investment advice. See additional disclaimer here.