Set-Up Details … Real Estate

At A ‘Confluence’

The last update, posted late in the session, said with the upward bias provided by the sizable Op-Ex event, we can look for the weakest (or one of the weakest) sectors.

The chart below summarizes yesterday’s action:

Friday 10/21/22, Single Day Gains

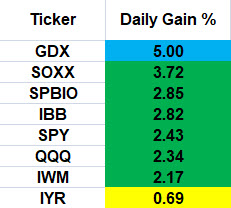
Gold miners GDX, is the outlier at the top and real estate IYR, the outlier at the bottom.

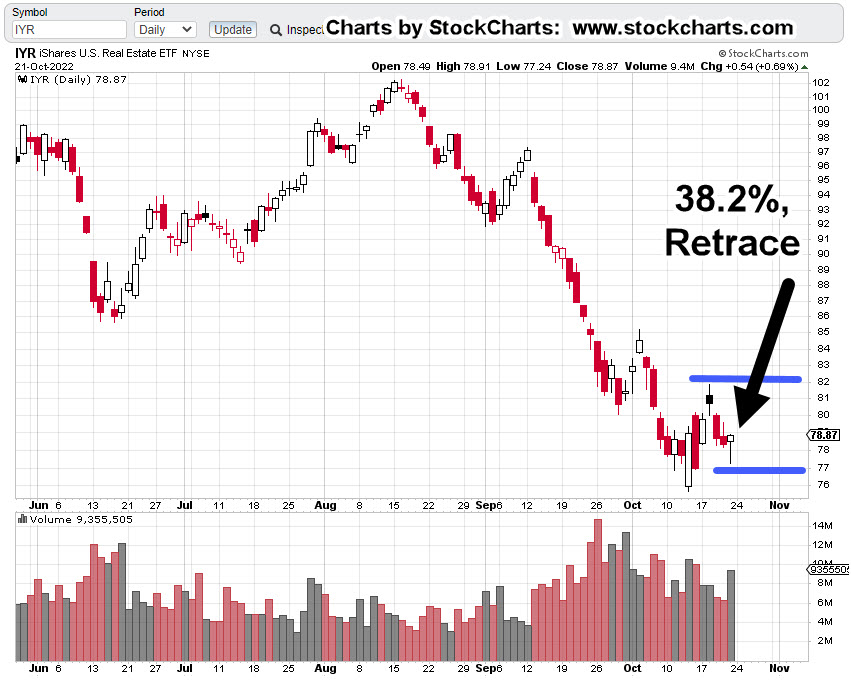
Before anybody gets excited about ‘hyperinflation’, just a reminder; silver SLV’s, action has retraced to a weak 38.2% (chart not shown), as it was forecasted to do from last week’s update:

“Silver (SLV) is currently at support levels; therefore, some upward action (staying below SLV: 18.5) is normal behavior.”

Price action is the final arbiter; we’ll see what happens next.

Back to real estate.

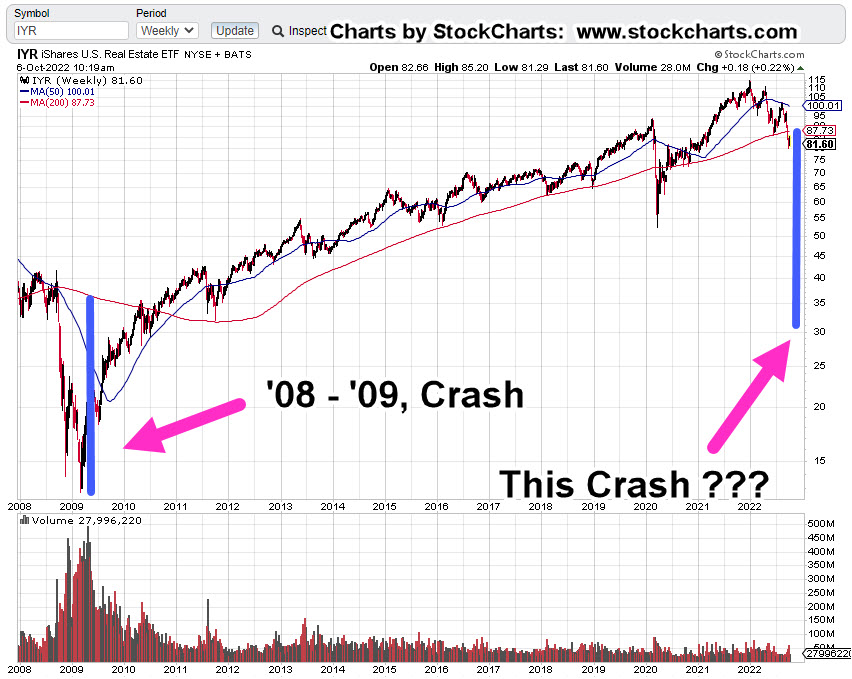
Professional Wisdom: ‘The Crash’

We’re going to use the experience and insight provided by Scott Walters concerning the potential for real estate; that is, we’re in a world-wide event the scale of which, no one alive (and possibly, ever) has seen before.

The Economic Ninja has just seconded that opinion (time stamp 3:45) with his quote:

“Right now, we are in the greatest collapse since The Great Depression; and I believe it will be as severe, if not worse, sharper, faster, than what people experienced in 1929”.

So, what would that ‘collapse’ look like on a chart of real estate, IYR?

Ah, yes. That’s the hard part.

To take useful wisdom like that above, and somehow map it into potential market behavior.

For that, we’re going to use the Quarterly chart of IYR.

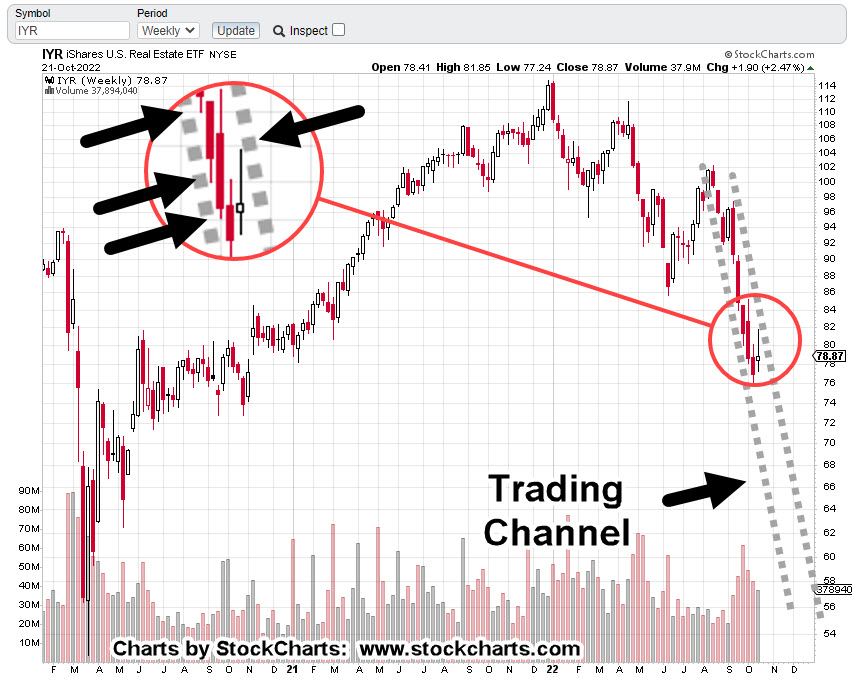
Real Estate IYR, Quarterly

There are still two months and one week left to go in the 4th, Quarter.

We’re at a confluence of price action as we’ll cover in the Hourly chart farther down; first, what’s the potential?

Here is one artist’s rendition (not advice, not a recommendation).

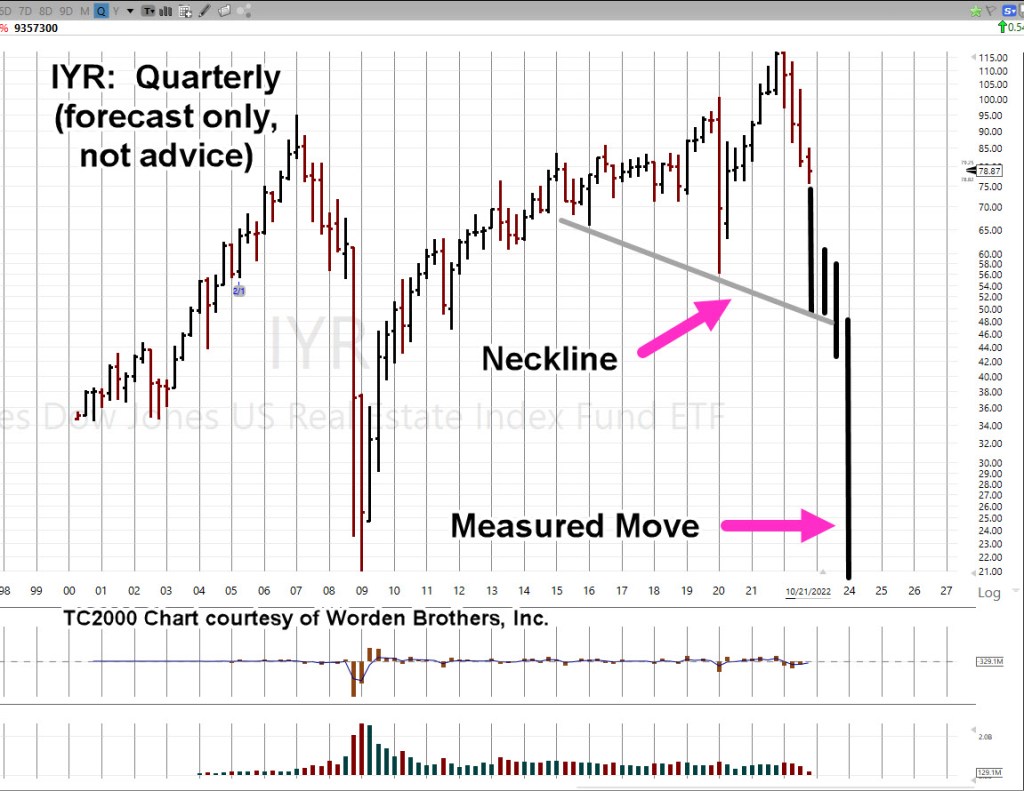
That puts it into perspective.

We may know at the very next open, if we’re pivoting higher or continuing the decline.

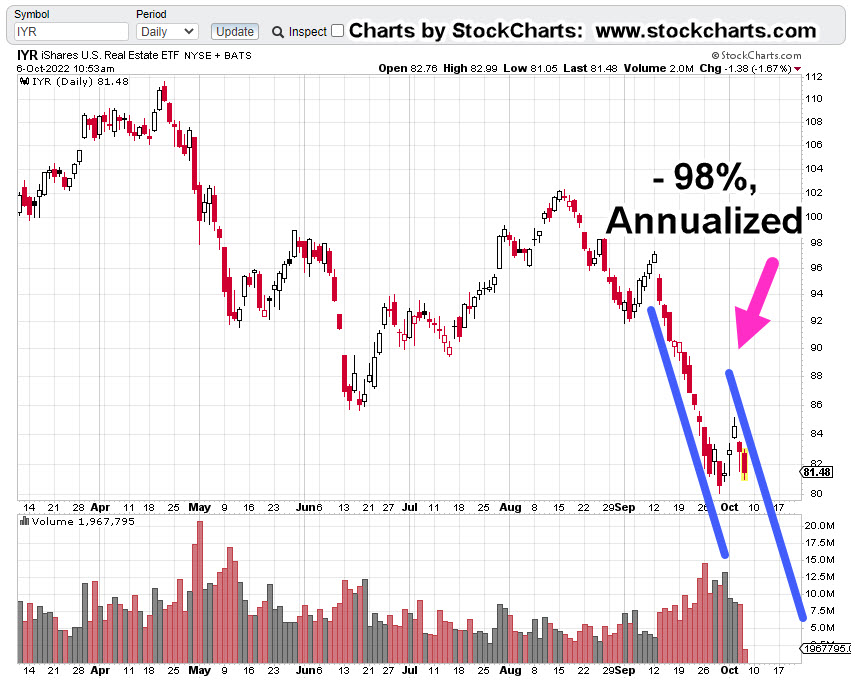
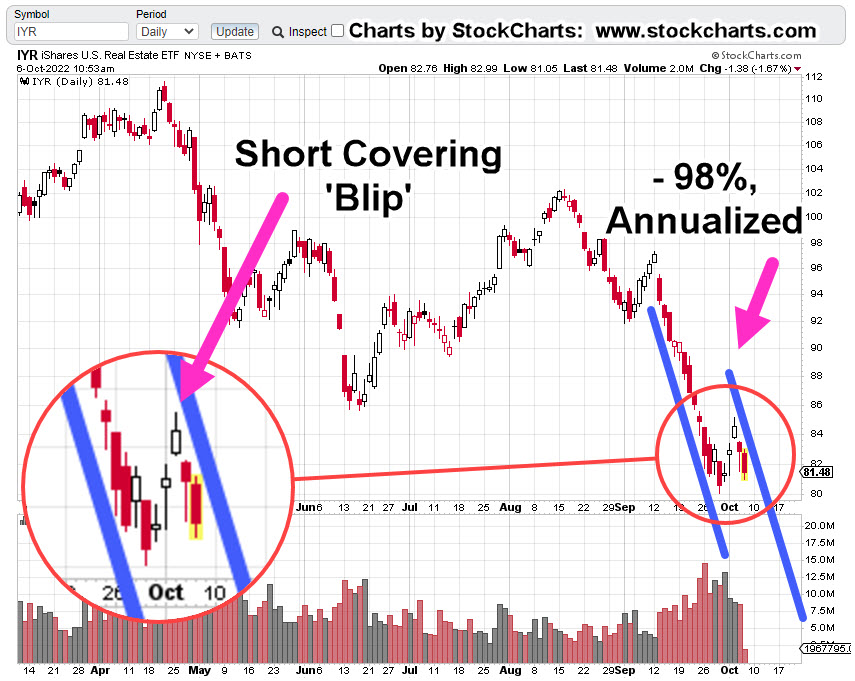
Butterfly In The Amazon

Of course, the market’s not going to tell anyone its next move. We have to decipher that (read the tape) ourselves.

Sometimes, as Wyckoff said a century ago … ‘It’s as if the weight of a feather is all that’s needed, to push the market further or to reverse.’

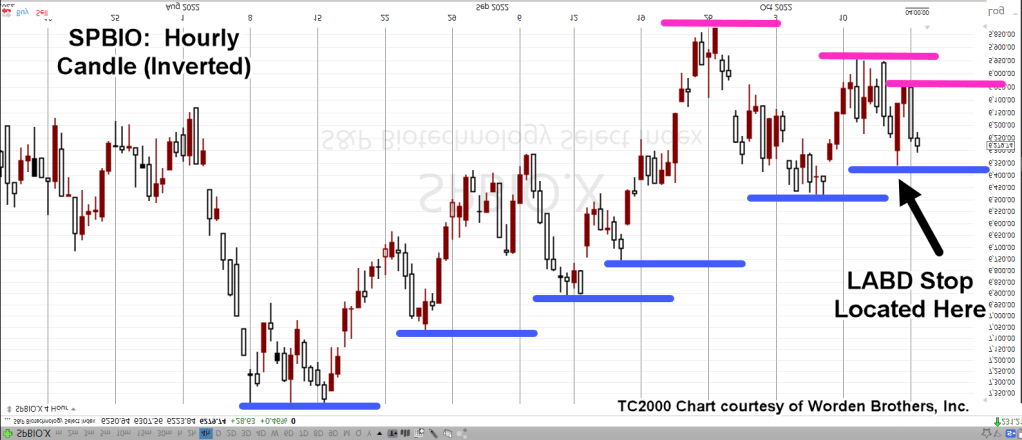
So, let’s look at that feather (the butterfly) on the hourly chart.

Since we’re positioned short (DRV-22-05), the chart’s inverted to mimic leveraged inverse fund DRV.

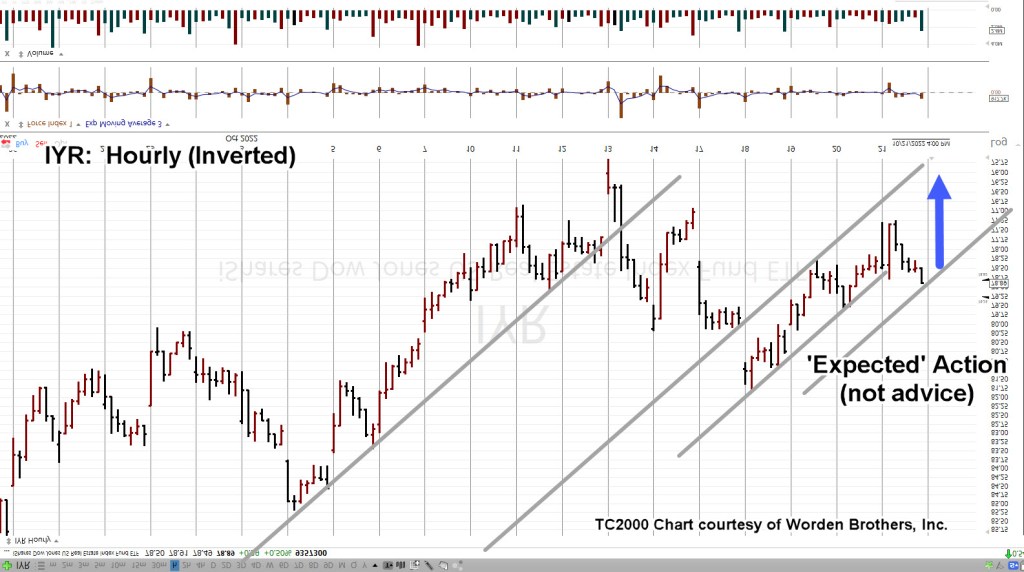
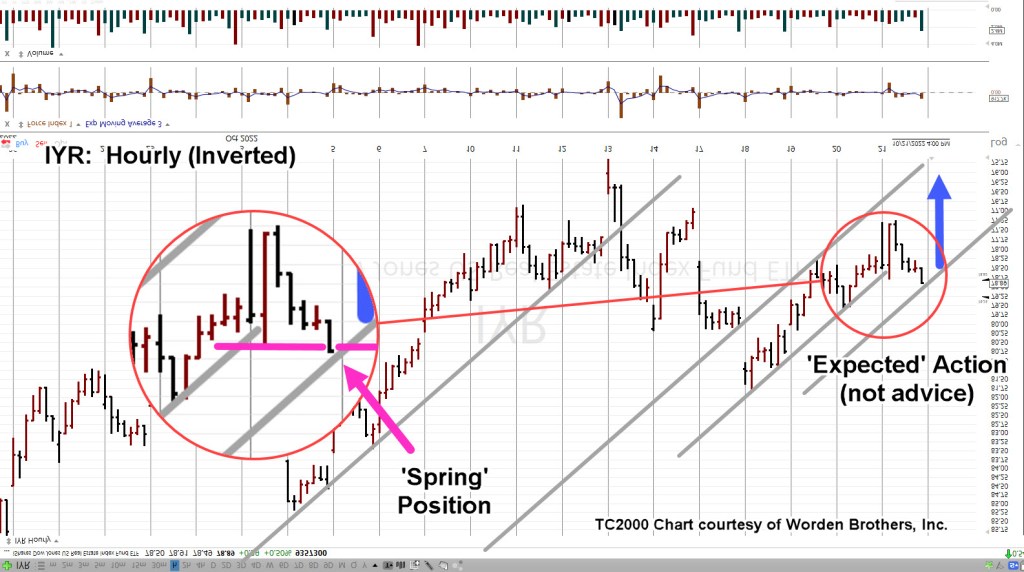
Real Estate IYR, Hourly (Inverted)

The important part is we see a repeating pattern of trendlines.

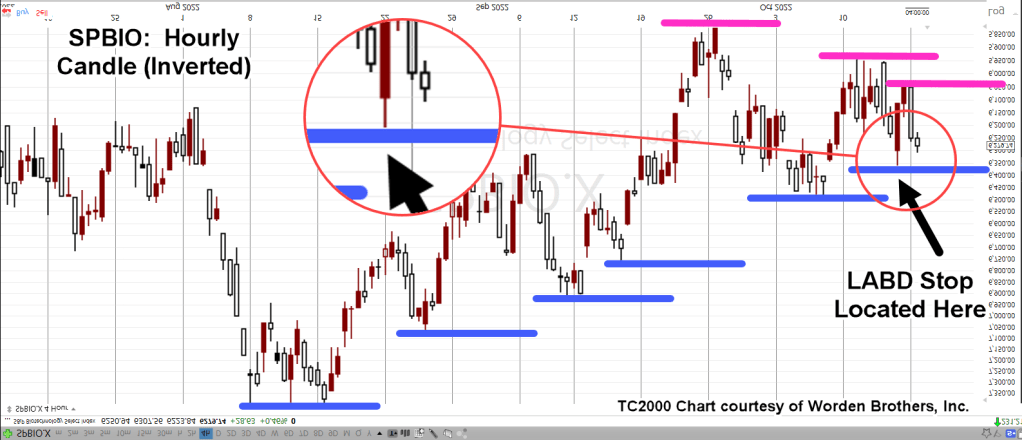
Moving in closer, we have this. The blue arrow is ‘expected’ action based on the analysis up to this point (not advice, not a recommendation).

Moving even closer, the zoom shows IYR, finished the day in Wyckoff spring position; having pushed past minor support (resistance on non-inverted).

Summary

If IYR opens lower or gap-lower, we’ll have to wait and see if it posts a new daily low (below IYR ,77.24).

If that happens, we have some confirmation lower prices are ahead and can then set a definitive stop for DRV-22-05.

Obviously, a higher open (pushing past IYR 78.91), negates the trade.

Stay Tuned

Charts by StockCharts

Note:  Posts on this site are for education purposes only.  They provide one firm’s insight on the markets.  Not investment advice.  See additional disclaimer here.

The Danger Point®, trade mark: No. 6,505,279

Real Estate … The Set-Up

Looking For The ‘Reversal’ To Fail

The $2-Trillion Op-Ex today, provided upward bias for the overall markets.

Not expected, was biotech SPBIO, to be part of that move.

After today and possibly because of this announcement, we’re out of the sector until price action demands attention.

While the Dow, S&P, NASDAQ were up significantly for the day, obviously absent, was real estate (IYR).

Days like today help narrow the focus. Who is not participating in the up move?

While the other indices are up multiple percentage points, IYR, finished the day up only +0.69%.

Real Estate (IYR) Weekly

The prior linked YouTube post from Scott Walters is not the premise for going short (not advice, not a recommendation).

It is, however, a reminder that what’s going on, is at a level no one has seen before.

Unless IYR, somehow gets out of the channel, it’s declining at -84%, annualized.

The set-up for this short trade (DRV-22-05) is based on a weak retrace (to 38.2%) on the daily with the anticipation, today’s reversal bar will ‘fail’ at the next session.

Real Estate, (IYR) Daily

The expectation for the next session is straightforward; lower open or gap-lower open and posting a new daily low.

The chart of IYR below, shows what we’re looking for (not advice, not a recommendation).

Obviously, a new daily high at the next session negates the set-up and warrants a trade exit.

A new daily low and we’ve got a ‘failure’ of the reversal bar; DRV-22-05, is liklely to be increased (not advice, not a recommendation).

Stay Tuned

Charts by StockCharts

Note:  Posts on this site are for education purposes only.  They provide one firm’s insight on the markets.  Not investment advice.  See additional disclaimer here.

The Danger Point®, trade mark: No. 6,505,279

Position Changes

Courtesy Update: 2:38 p.m., EST

Charts to be posted in a subsequent update.

Biotech is not behaving as expected; LABD-22-08, has been exited completely with an overall profit of about +8.5%.

We all know that real estate is in the largest bubble in U.S. history … and that’s not hyperbole.

With today’s upward bias in the market and IYR, not responding in kind (remaining weak), a position has been opened in leveraged inverse, DRV @ 74.53 (not advice, not a recommendation).

Price action in IYR, could still pressure somewhat higher into the close; thus, DRV would decline but the anticipation is if so, not by much.

Trade is labeled as DRV-22-05; stop is TBD, to be provided after the close.

Stay Tuned

Charts by StockCharts

Note:  Posts on this site are for education purposes only.  They provide one firm’s insight on the markets.  Not investment advice.  See additional disclaimer here.

The Danger Point®, trade mark: No. 6,505,279

Eye Of The Needle … Biotech

Threading It Close


One more subdivision.

After the last post, was released, looking at the after-hours action, there was one more possibility for SPBIO, to subdivide (higher) and still be in an overall downtrend.

It was the skinniest of margins, the eye of the needle but that’s what we got with yesterday’s price action.

While the rest of the market remains hypnotically fixated on bull or bear and who’s right, one is reminded of the old Ned Davis, trading adage; ‘Do you want to be right, or do you want to make money?’

The tape is always right.

Yesterday, biotech SPBIO, made one last subdivision to the only level it could go while still remaining in a downtrend.

Follow The Rules … Break The Rules

That title is borrowed from the interview with Ed Seykota in the book Market Wizards.

Late Monday night, looking at the after-hours, it was obvious price action might blow through the LABD stop at the next session.

With that in mind, a forecast of price action was drawn on the hourly chart of LABD.

That forecast (drawn on the broker’s platform) showed the conditions under which the rules would be broken, the position held, and the stop temporarily ignored.

Replicated on the Worden Brothers, platform (below), is a representation of that forecast.

SPBIO, Leveraged Inverse LABD, Hourly

Wednesday (today) Early Session

Judge for yourself. We’re interested in the form of the action and not necessarily the time required.

It was thought the reversal would be complete in a day; looks like it’s a day and an extra 30-minutes. 🙂

The Challenge

To those seriously addressing (working) the markets; Challenge yourself to draw the ‘excepted action’ of the market before and after taking a position.

If your forecast does not match, then obviously something else is happening. Is that ‘something’ in line with acceptable price action for your position … only you can decide.

Summary

The short position in biotech (LABD-22-08) has been maintained (not advice, not a recommendation). Now that it looks like a reversal, this sector could be in serious trouble.

All the while, the fundamentals continue to build.

Stay Tuned

Charts by StockCharts

Note:  Posts on this site are for education purposes only.  They provide one firm’s insight on the markets.  Not investment advice.  See additional disclaimer here.

The Danger Point®, trade mark: No. 6,505,279

Subdivision To Decision: Biotech

Lower Highs … Higher Lows

As we’ll see below, SPBIO, has oscillated itself into a decision point.

From a positioning standpoint, my firm has taken a bearish stance on biotech via LABD (not advice, not a recommendation).

Yesterday’s update anticipated more SPBIO, downside which did not happen.

Instead, we got a test of the latest SPBIO, high.

This testing action does not negate the short via LABD, but it’s now very close.

Once again, we’ll use an inverted chart of SPBIO to mimic the action of leveraged inverse fund LABD.

Biotech SPBIO, Hourly (Inverted)

The blue lines are subdivisions higher and the magenta, subdivisions lower.

The zoom chart below shows just how close we’re to short-set-up, exit. If SPBIO posts a new daily high, by definition it will push past the LABD, stop and the trade will close (not advice, not a recommendation).

Strictly speaking, in the chart above, the ‘risk’, is the distance between the latest hourly low for SPBIO (Inverted) and the stop location at the black arrow.

That’s approximately 50-pts on the SPBIO, chart which corresponds to about 0.43pts for LABD.

After hours action (5:57 p.m., EST) has LABD, trading lower -0.37pts, or -1.68%, @ 21.68, but still above the prior stop location @ LABD 21.23.

Stay Tuned

Charts by StockCharts

Note:  Posts on this site are for education purposes only.  They provide one firm’s insight on the markets.  Not investment advice.  See additional disclaimer here.

The Danger Point®, trade mark: No. 6,505,279

The Market Set-Up … This Week

What To Watch

First off, it’s nice to know, traders at J.P. Morgan, don’t have clue as what to do.

They say it themselves; Not One Person

On top of that, I’m supposed to pay money reading about how clueless they are. 🙂

No thanks. Let’s see if we can do better than the average ‘investment firm’.

Before we get started, a reminder; as Michael Cowen says:

‘It’s the bear market that reveals those who really understand’, not the bull market ‘geniuses‘.

With that, let’s get into it; first up, is silver.

Silver: Wyckoff Analysis Results

The downside reversal was identified to the day.

Adding to that post, Europeans could not only be freezing or starving this winter, but also subject to radiation poisoning.

Surely, they’re all thinking that ‘stack’ of silver is going to save them.

Silver (along with gold) remain trending lower.

Silver (SLV) is currently at support levels; therefore, some upward action (staying below SLV: 18.5) is normal behavior.

Bonds: Are They Ready?

Hold your nose … bonds could be setting up for a rally.

As Steven Van Metre reports here, the Fed ‘shenanigan’ meter is pegged.

Bonds, TLT Weekly

Note, the bullish TLT, set-up is not confirmed until MACD ticks higher (not advice, not a recommendation).

Also note the repeating pattern of ‘spring to up-thrust‘.

Last up, biotech

Biotech SPBIO, Hourly (Inverted)

We’re going to use the chart from yesterday’s post to set the stage for getting closer-in.

This past Friday’s early morning ‘spike’ is barely visible; the 30-minute (inverted) chart below, has more detail.

SPBIO, 30-minute (Inverted)

Price action rejected the lower levels (higher on SPBIO) and pulled away throughout the session. That ‘pulling away’ continued on, all the way into the close.

That’s a clue there may be follow-through at the next session.

If the early session opens ‘gap-higher’ (SPBIO, lower), into the resistance area (four magenta arrows, hourly chart), it would be the fourth time pressuring at this area; markets rarely hold a fourth attempt.

Summary

Of course, other markets are being watched like real estate (IYR), Tesla (TSLA), and even Basic Materials (DJUSBM), a potential sleeper for significant downside.

Updates are planned if/when low risk shows up.

Positions: Current Stance (courtesy only, not advice).

The following is the positioning of my firm’s main (largest) account.

LABD-22-08:

LABD Entry @ 25.1278, 24.735, 26.025, 22.99, 22.29***, Stop is @ LABD 21.23***

***, Indicates change

Note: Positions may be increased, decreased, entered, or exited at any time.

Stay Tuned

Charts by StockCharts

Note:  Posts on this site are for education purposes only.  They provide one firm’s insight on the markets.  Not investment advice.  See additional disclaimer here.

The Danger Point®, trade mark: No. 6,505,279

The Usual Suspects

Special Biotech Edition

Bogart

An immense flood of data; research reports, lawsuits, expose articles and anecdotal evidence; every day, multiple times a day, something new.

Has the biotech technical (finally) lined up with the fundamental?

Those fundamentals are farther down but first, we’ll discuss the technical.

As a reminder, sometimes charts are inverted during analysis. This ‘trick’ was discovered years ago and is based on techniques used by Dr. Alexander Elder.

Biotech SPBIO, Weekly Close (Inverted)

We’ve taken the weekly closing chart of SPBIO ($SPSIBI, on StockCharts) and inverted it to mimic the action of inverse fund LABD.

The index has no volume; so LABD is used instead.

The magenta arrow shows the pivot point for the index, corresponds will all-time record volume on leveraged inverse LABD.

Next, we’ll get closer-in and look at the ‘pivot’ on the hourly chart (inverted).

SPBIO, Hourly (Inverted).

The magenta arrows show successive positions (Livermore ‘probes’) entered (via LABD) before the main entry @ LABD 22.99, which was 90% of position size up to that point.

The next day (Friday) had a gap-lower open that was quickly reversed. Position size was increased by another 5%, at LABD 22.29 (not advice, not a recommendation).

Effective position equates to LABD 23.17

Price action pulled away steadily from the early morning levels, suggesting a sustainable reversal.

The Fundamentals

Some of this stuff, you just can’t make up.

Listed in somewhat chronological order, here they are (not an exhaustive list).

No. 1

Pfizer hires 600 to help document adverse events. Wasn’t it supposed to be ‘safe and effective’?

No. 2

Pilot Shortage

Fired/quit because they refuse to get ‘protection’.

A possible corollary to what’s happened, via injection, we have this.

No. 3

Pfizer, nobody wants their product … after the rollout.

No. 4

Who could it be?

Previously unknown (or rare) problems and illness now starting to accelerate.

No. 5

We’re here to help.

No. 6

You mean, it was all a lie?

No. 7

The real reason for getting ‘tested’?

No. 8

What did the media know and when did they know it?

No. 9

It’s still a ‘suggestion‘ but the payouts to family members are real.

No. 10

It’s over … and then it’s not.

No. 11

We’ll keep it quiet, so no feelings get hurt.

No. 12

How bad is your batch? Let’s see.

No. 13

You mean, it was never tested? I’m shocked.

No. 14

After all that, maybe we can give it another shot.

No. 15

A potential infinite number of complications … nothing to see here.

No. 16

Getting away with it? Not so fast.

No. 17

Just had a heart attack? We can help.

No. 18

Limited Hangout? You decide.

No. 19

Lastly, this is what it’s really all about.

Recorded years ago. Did her ‘prophecy’ come true?

Stay Tuned

Charts by StockCharts

Note:  Posts on this site are for education purposes only.  They provide one firm’s insight on the markets.  Not investment advice.  See additional disclaimer here.

The Danger Point®, trade mark: No. 6,505,279

Wheels Come Off … Biotech

Unraveling, Quickly

This just out on ZeroHedge:

An Epoch Times article, using excerpts from a Lancet Report, linked here.

It’s best to let the reader sort out what it all means, arriving at one’s own conclusions.

Of course, the obvious problem, the ‘elephant’ is not addressed directly.

However, VAERS is quoted in The Epoch Times article, thus giving it legitimacy.

Leading The Downside

For some time, this site’s highlighted, biotech (SPBIO), as unique to all other indices save GDX, and GDXJ.

That is, it’s down the most since the bear market started.

As of today’s close, it’s down over – 54%, from all-time highs while the S&P is down only – 23.7%.

As documented over several years, the sector’s unique; it’s at risk (more than other indices) to implosion.

With today’s close, it looks like we’re at a critical juncture.

Biotech SPBIO, Weekly

The unmarked weekly chart

Compressed, with added trendlines.

It’s an obvious trading channel of immense size … but so is nearly everything else concerning these markets. We’re operating at unprecedented scale in unprecedented times.

But wait, there’s more.

The trading channel has Fibonacci time correlation(s).

We’ll expand the weekly chart for more clarity.

From channel entry, week ending 9/3/21, to the right-most contact point (week ending 9/16/22), is Fibonacci 55-Weeks.

Channel width measured from week ending 1/28/22, to the same contact-point, week ending 9/16/22, is a Fibonacci 34-Weeks.

We’re at The Danger Point®

Positions & Current Stance (courtesy only, not advice).

The following is the positioning of my firm’s main (largest) account.

DRV-22-04:

Entry @ 66.463, Stop @ 63.98

Discretionary exit (today) @ 75.96***

Trade Closed

LABD-22-08:

Entry @ 25.1278, 24.735, 26.025***, 22.99***, Stop is Open (to be set at next session)

***, Indicates change

Note: Positions may be increased, decreased, entered, or exited at any time.

Stay Tuned

Charts by StockCharts

Note:  Posts on this site are for education purposes only.  They provide one firm’s insight on the markets.  Not investment advice.  See additional disclaimer here.

The Danger Point®, trade mark: No. 6,505,279

ProLogis … Real Estate Proxy

The Work Has Already Been Done

This is how it pays off.

Work was done months ago, on ProLogis (logistics/warehouse, real estate) which at the time, was the largest cap in the IYR.

It’s now No.2, just behind AMT, but the effort is still valid.

From that post last May, the behavior of ProLogis during a bear market was summed up with the following:

“It’s straightforward.

Using 2008 – 2009, timeframe as the proxy, PLD was vaporized; straight down for two-months.”

Well, that was back in ’08 – ’09.

Let’s see how our ‘vaporization’ is going now.

ProLogis PLD, Monthly

Price action is at support.

Downward pressure is immense.

We should all be able to agree, this time is worse than last time (’08 – ’09).

There’s no money left for a ‘save’, and our chief cook and bottle washer, the Fed, seems to be on a different agenda.

So, let’s remind ourselves of the potential for this down-move should it come to fruition.

The weekly chart of PLD, and distance traveled below the 200-wk Moving Average, gives us a sense of the enormity.

ProLogis PLD, Weekly

To position for a potential event, there may be plenty of time, or no time.

Either way, when things really get started to the downside, confusion, panic, locked-up brokerages, internet outages, will likely be the norm.

Positions & Current Stance (courtesy only, not advice).

The following is the positioning of my firm’s main (largest) account.

DRV-22-04:

Entry @ 66.463, Stop @ 63.98

ZSL-22-01:

Entry @ 28.08, Stop @ 28.53***

***, Indicates change

Note: Positions may be increased, decreased, entered, or exited at any time.

Stay Tuned

Charts by StockCharts

Note:  Posts on this site are for education purposes only.  They provide one firm’s insight on the markets.  Not investment advice.  See additional disclaimer here.

The Danger Point®, trade mark: No. 6,505,279

Real Estate ‘Crash Channel’

Not Saying That Lightly

For real estate, the crash may be happening as we speak.

Even if it’s not, the sector (IYR) has developed an aggressive trading channel as we’ll see below.

First, we’ll look at ‘big picture’ potential on the weekly chart.

Real Estate IYR Weekly

The distance traveled from the 200 Week Moving Average during the crash of ’08 – ’09, is shown.

That same distance is projected on the current situation.

Everybody’s ‘looking for the bottom’ … well, there it is. 🙂

Of course, that’s only a potential bottom.

Where it gets really scary is the channel that’s been confirmed on the daily chart, shown below.

The zoom version shows the weak blip higher … potential short covering that looks complete.

One caveat is that as (or if) IYR price action approaches the lows, technically speaking, it’s a support level.

That’s the time to watch the right-side channel line to see if it’s penetrated, thus negating the aggressive downtrend.

Positioning

Everyone has their own style and this is NOT financial advice.

However, a short was initiated early this session in Leveraged Inverse Fund DRV, labeled DRV-22-04.

Opened @ 66.4633, with a stop at session low, 63.98

Stay Tuned

Charts by StockCharts

Note:  Posts on this site are for education purposes only.  They provide one firm’s insight on the markets.  Not investment advice.  See additional disclaimer here.

The Danger Point®, trade mark: No. 6,505,279