Note: Posts on this site are for education purposes only. They provide one firm’s insight on the markets. Not investment advice. See additional disclaimer here.
Of all the major indices for today’s (Wednesday) session, biotech’s SPBIO, Leveraged Inverse Fund LABD, had one of, if not the largest gain @ +10.48%.
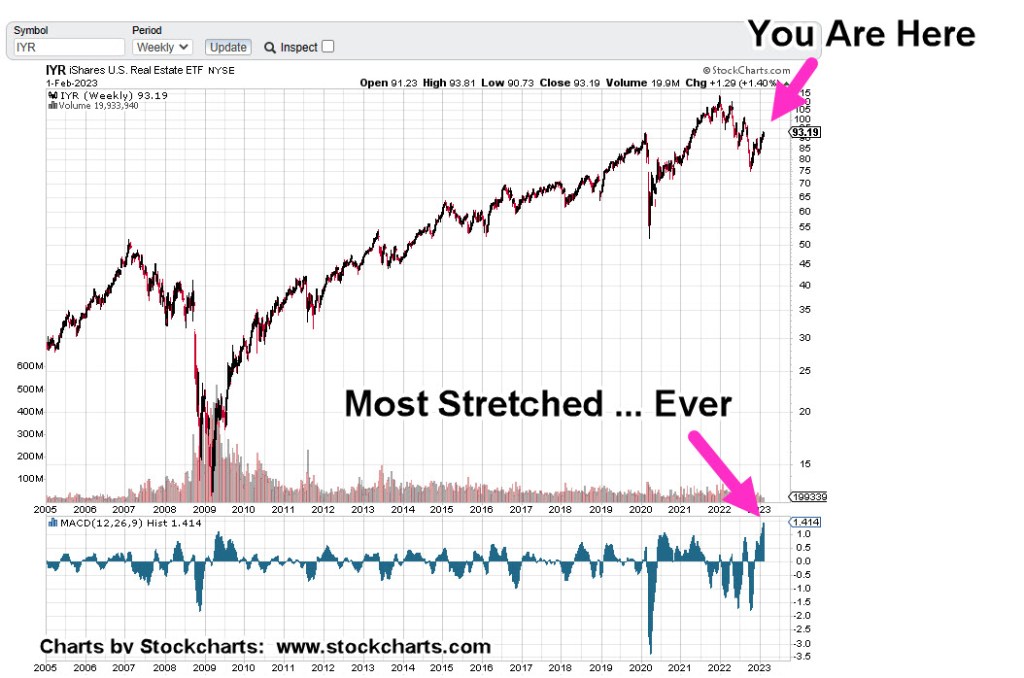
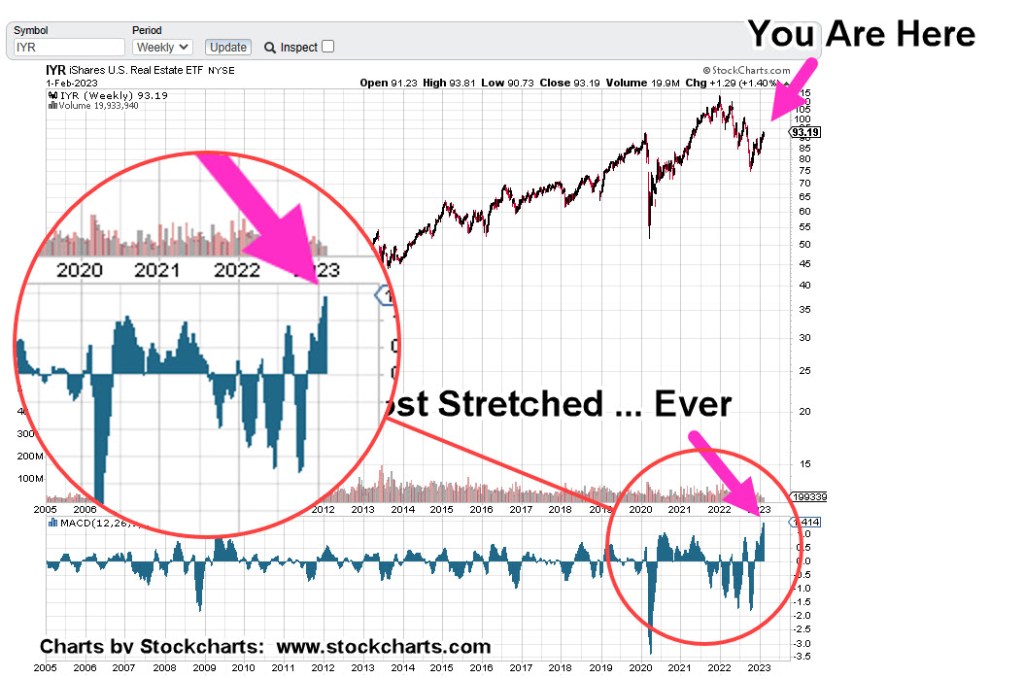
The last update identified two sectors to watch for short positioning: Real Estate IYR, and Biotech SPBIO; Short positioning via leveraged inverse funds DRV, and LABD, respectively (not advice, not a recommendation).
Since that post, DRV is up + 1.74%, and LABD is up + 8.58%, both measured on a close basis.
The ‘Big Reveal’
Remember: When price action turns south, that’s when the bad news comes out.
If this is the big reversal and biotech is the downside leader, unfortunately, that could mean a planned ‘reveal’ by the mainstream media.
Anyone going to alternative sites such as BitChute, ZeroHedge, Rumble, know full well what’s happening.
Maybe we’ll have another distraction like the 100-th (at last estimate) food processing plant fire or even something totally retro, like a balloon flying across … oh, wait. 🙂
Biotech SPBIO, Leveraged Inverse LABD
We’ll get straight to the point as prior updates have built a substantial case for a long term, significant reversal.
Recall, LABD is the leveraged inverse of SPBIO. The daily chart shows the current set-up.
This site does not provide investment advice.
With that said, one could infer from this prior post (at the bottom), a position in LABD had already been established and included a hard-stop.
That was indeed the case.
Next Steps
There’s no guarantee on how far or how long a directional move will go.
However, for SPBIO, one can observe since the February 2021, reversal from all-time highs, a sustained, directional move typically lasts 4 – 6 weeks.
The next update will show the best chart timeframe (multiple days) that resulted in capturing the majority of the directional moves since the February 2021-high.
Note: Posts on this site are for education purposes only. They provide one firm’s insight on the markets. Not investment advice. See additional disclaimer here.
The last update about our chief cook and bottle washer of gene ‘modification’ had this to say about price action.
“We’re about forty minutes into the session; Moderna (MRNA) has just confirmed the up-thrust reversal discussed in the last update“.
From that point Moderna (MRNA) declined for seven weeks for a total of around – 31.5%.
However, that’s not the most important part.
In that update, a trading channel was shown which at the time, was declining at – 93.7%, on an annualized basis.
Well, the channel is back.
Only this time, probabilities and price action have come together to set up for a potential sustained decline.
Moderna MRNA, Weekly
Above, we have a Wyckoff ‘Up-Thrust’ and a test that has since turned lower.
Next, we have a series of repeating trend or channel lines.
Additional data has modified the downward slope to be declining at approximately – 90%, annualized.
From a fundamental standpoint, the data set is enormous on the events of the past three years.
At some point that data could provide a huge tailwind for downside action.
For now however, let’s stick with what price action is telling us and go to the Summary & Strategy
Summary & Strategy
The past week has identified two areas of position or trade execution and two areas for possible short-term options execution (not advice, not a recommendation):
Position or Trade: Real Estate IYR, and Biotech SPBIO
Options: Carmax KMX, and Moderna MRNA
As a reminder, most if not all trade analysis is for the short side (not advice, not a recommendation).
Final Thoughts
Since we have possibly the largest bull trap in market history with huge numbers of VIX Call options, the following week may be subdued by going modestly up, sideways or down, slowly.
With that said, options positioning (if any) could be slated for the week of 2/17/23.
Note: Posts on this site are for education purposes only. They provide one firm’s insight on the markets. Not investment advice. See additional disclaimer here.
The large number of VIX (volatility) Calls, tells us, not to expect an immediate sharp move lower.
Those Calls will likely need to be bled-off in value, before we get a significant downward spike … if there is one.
Market Summary, Watch List
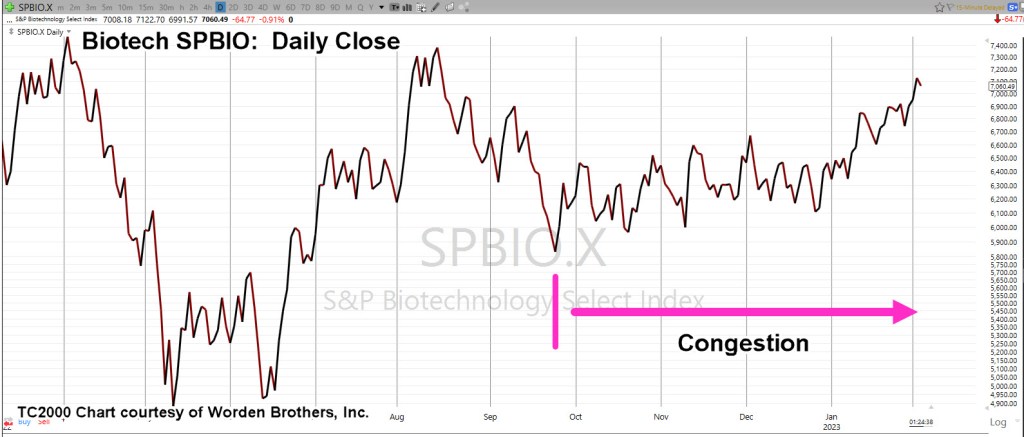
Over the past week, there are two markets that are being monitored for short position entry: Real Estate and Biotech; IYR, and SPBIO, respectively.
After nearly five months of price action whipsaw and congestion, biotech appears to be in a nascent downside reversal. Real estate looks to have reversed today (not advice, not a recommendation).
Biotech has been the weakest (technically) of all the major indices (except miners, GDX and GDXJ).
We’re going to look at the daily chart of SPBIO, to see the opportunity and the risk.
Biotech SPBIO, Daily Close
Since late September last year, there has been sideways-to-up, price action congestion.
Price action today, appears to have resolved into a nascent reversal.
We’re going to invert the chart to mimic the leveraged inverse fund LABD, showing the opportunity and the risk.
SPBIO, Daily Close (Inverted)
The prior two days of Fed induced bullish short-covering hysteria, have resulted in a decisive penetration of the support level, as shown.
By definition, this puts us in Wyckoff ‘Spring Position’; be on guard for a potential reversal.
Positioning
There have been many false starts to this sector’s reversal as evidenced by previous posts.
However, today’s action is consistent with resolution of the five-months of congestion (not advice, not a recommendation).
Every trading/speculator has their own style and this site does not give financial advice.
With that said, a (highly leveraged) short entry via LABD, would have a hard stop at today’s low.
At present (2:15 p.m., EST) and entry at LABD 12.91 would have a stop at 12.45, yielding a ‘risk’ of 0.46-pts.
Note: Posts on this site are for education purposes only. They provide one firm’s insight on the markets. Not investment advice. See additional disclaimer here.
Note: Posts on this site are for education purposes only. They provide one firm’s insight on the markets. Not investment advice. See additional disclaimer here.
Provided many times on this site, the assessment we’ve gone straight past recession and directly to: ‘The Greater Depression’, or ‘The Great Depression 2.0’
By now, we’re all aware of this data, just out from ZeroHedge.
That data is at the ‘peak’ or the depths of 1932, and we in our current market, haven’t even got started!
The Fed’s interest rate announcement is due out at 2:00 p.m., Eastern, today; does it really matter?
We can see with unbiased observation; the wheels have already, irrevocably, been set in motion.
The economy along with the ‘elephant’ that no one talks about, are juggernauts on a downward course.
The 1929 Crash, Then Bull Rally
Remember, the big market speculators of the early 1900s typically made their fortunes on the way down (not advice, not a recommendation).
Let’s also not forget, one of, if not the largest market rallies up to that time (in percentage terms), happened right in the middle of The Great Depression.
Of course, to trade that mid-1930s rally, you had to have the capital to do so.
Which brings us to the next topic: Real Estate.
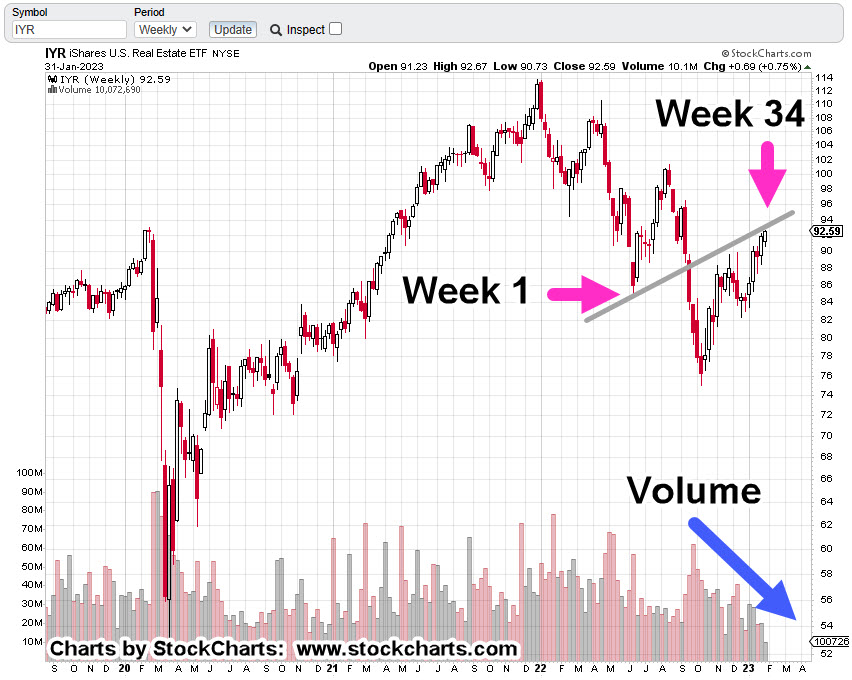
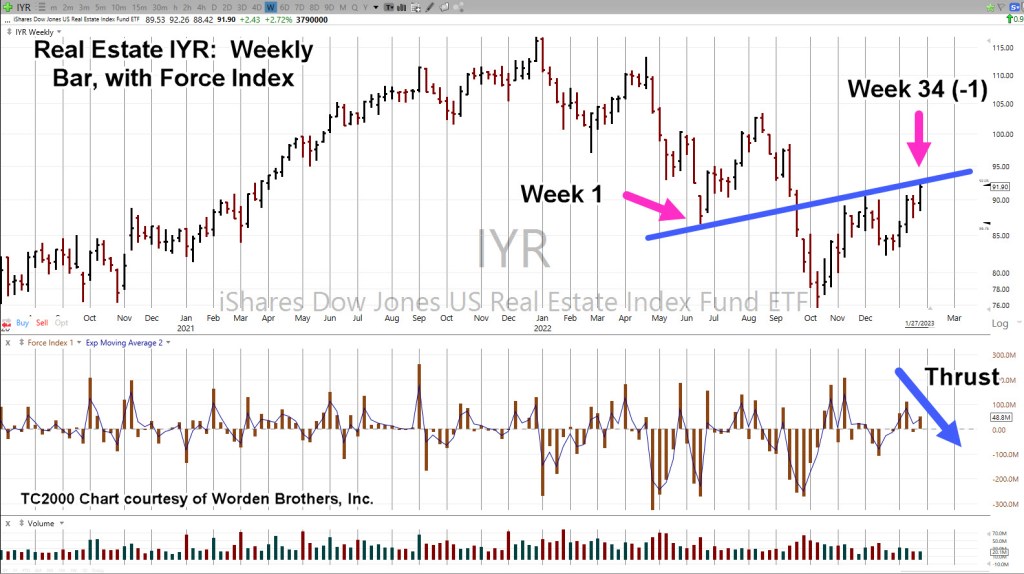
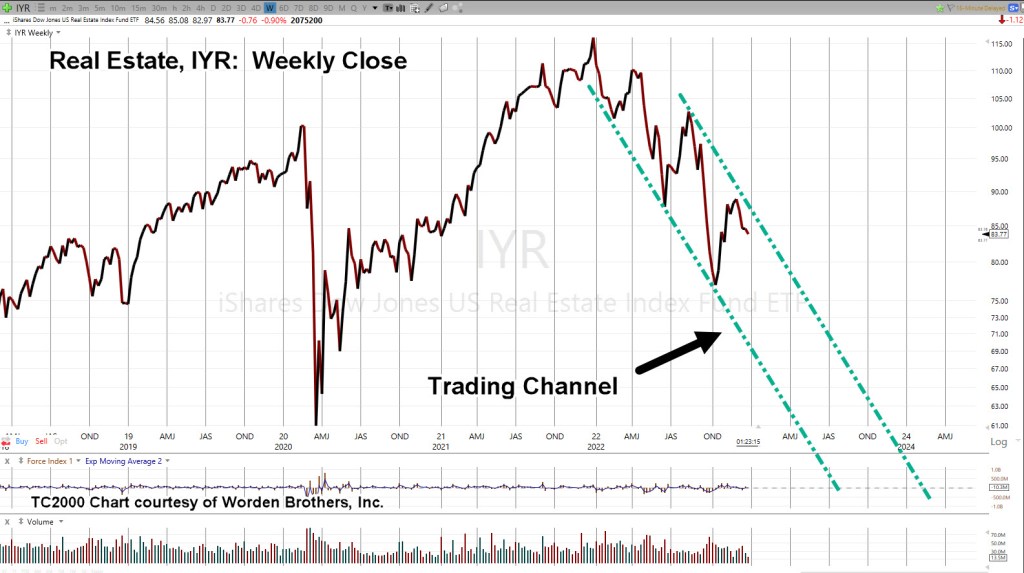
Real Estate IYR, Weekly
With yesterday’s new print high, we’re at Fibonacci Week 34. That puts us at a potential trading channel or inflection point as discussed in this post.
There’s no guarantee of a trading channel or even a reversal.
However, we do have a confluence of events; upside volume (pressure) declining, marginal new highs and the potential Fed pivot point, due out today.
It’s about 20-minutes before the open. Let’s see what happens next.
Note: Posts on this site are for education purposes only. They provide one firm’s insight on the markets. Not investment advice. See additional disclaimer here.
There are nine other supplemental data points for the economic mayhem, collapse, collapse-in-progress scenario; they are listed at the end of this post.
For now, we’re talking about real estate and specifically the proxy for the sector, IYR.
Real Estate IYR, Weekly
As stated in the last post, we’re going to follow-up with a potential IYR, downside reversal by covering three more technical points; Fibonacci time correlation, thrust energy and trading channel.
First up: Last week completed a Fibonacci 34 (-1 week) time frame that may result in a reversal into a trading channel (shown on second chart).
Upward force (Thrust Index) declined significantly over the prior upward push during the week of 1/13/23.
The weekly chart has been compressed and trading channel lines added.
Internal trendlines are printed as grey dashed lines.
As shown, we’re at ‘Week 34 (-1)’.
If this market’s in reversal and adhering to a Fibonacci time sequence, we could see an immediate reversal or another minor high next week to make it an even 34 or go one additional week to make it 34 (+1) weeks.
Either way, we’re at The Danger Point®
The 1929 – 1932 Trading Channel(s)
Here’s a bit of insight you’ll not find anywhere else.
Research and data gathered by my firm, has shown markets tend toreverse just before, during, or just after a Holiday Week.
In our case below, The 1929, all time high was 379.61, posted on September 4th; the Tuesday following the Labor Day Weekend.
The final low and subsequent reversal was 41.81, posted on July7th 1932; the Thursday following the July 4th Holiday:
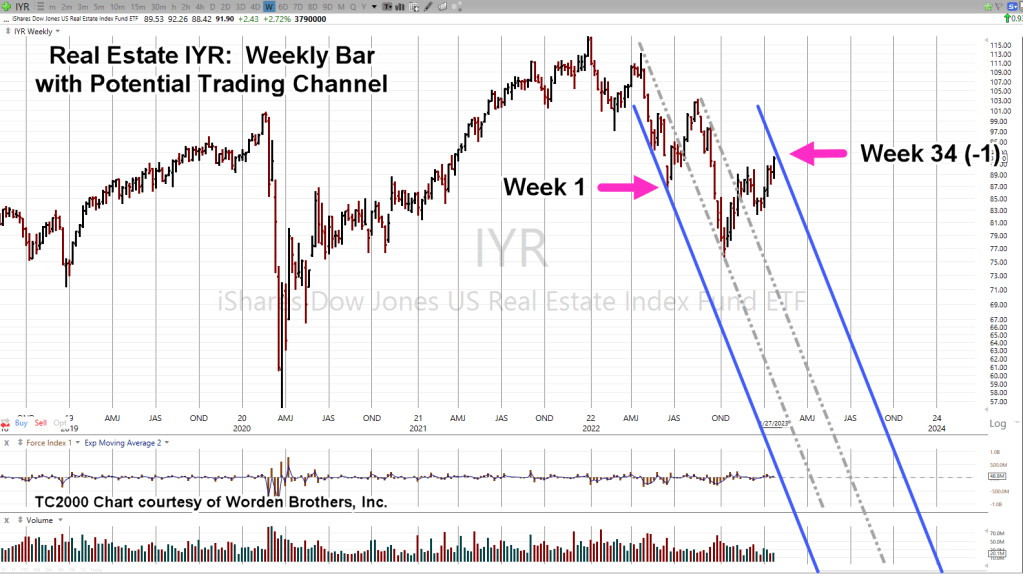
There are at least three main trading channels in effect for the entire (nearly) three year down move.
Trading channels are an old and repeating characteristic of the markets.
Real Estate Re-Cap
The all-time high in real estate IYR, was 116.89, posted on December 31, 2021, the Friday before the New Year’s Weekend.
Since then, there have been several trading channels in effect; at this juncture, we may have yet another.
With the data links provided at the beginning and the links at the end of this post, sustained price action to the downside is more probable (not advice, not a recommendation).
This coming week is likely to be quite interesting as the Fed continues on its path of price and demand destruction.
Note: Posts on this site are for education purposes only. They provide one firm’s insight on the markets. Not investment advice. See additional disclaimer here.
The Danger Point®, trade mark: No. 6,505,279
Addendum
Congratulations on reading this far. You must be serious about your work. Supporting data for the bearish case is below.
According to this link, it’s not only higher taxes, but retirement accounts being hi-jacked through rule changes.
‘The bulk of the wealth of the American people.’
Not to be outdone, the IRS will increase penalties for under and overpayment of taxes as reported by Fox Business via Jerimiah Babe (time stamp 22:16).
At least it’s nice to know, implementation of the ‘$600’ rule will be saved until next year. 🙂
So, we have the context for the year 2023; i.e., wealth destruction, asset confiscation, fines and fees.
It’s a straightforward plan on ‘their’ part.
What’s also straightforward as reported by Babe, a large number of Americans don’t even know what’s going on let alone be willing to take action.
Then, The Elephant
Let’s not forget the ‘elephant’ that’s likely to be the biggest driver for 2023.
We see that elephant every day now and sometimes multiple times a day. It’s starting to reach the fringes of the mainstream with articles like this one.
Scroll down to The List … It’s No. 2
That elephant and its subsequent lack of demand (less population, fewer buyers) as a result, will likely affect real estate in a big way … for decades to come (not advice, not a recommendation).
The last update showed the weekly trading channels in IYR. The next chart goes further out to the monthly and identifies a Fibonacci sequence.
Real Estate IYR, Monthly
So far, we’ve had IYR on the daily (link here), the weekly (link here), and now the monthly, below.
Major inflection points on the monthly have occurred at Fibonacci timeframes.
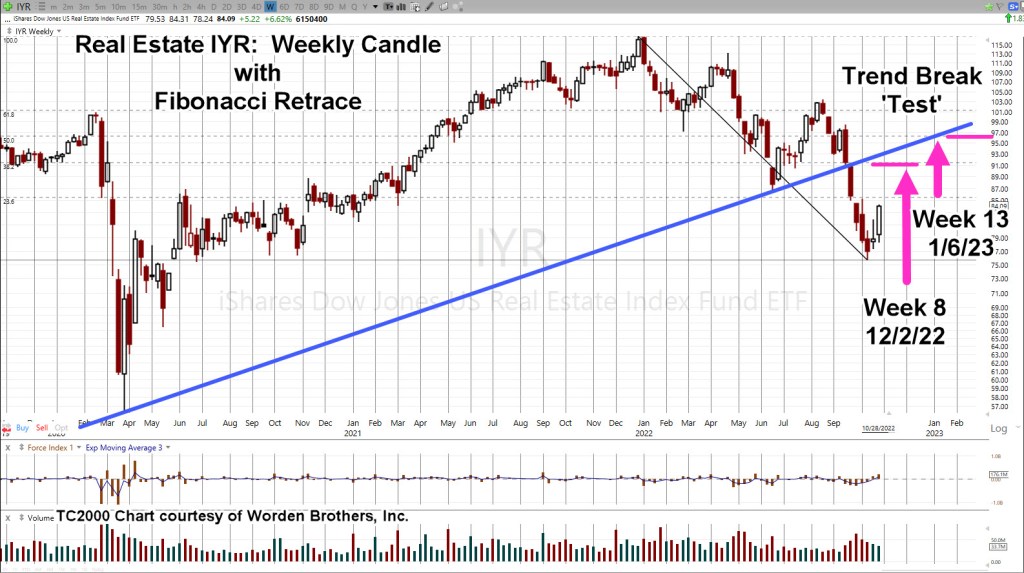
Original Forecast, October
The analysis of the current set-up started way back in late October. Using a weekly chart, a potential Fibonacci sequence was identified that ultimately proved correct.
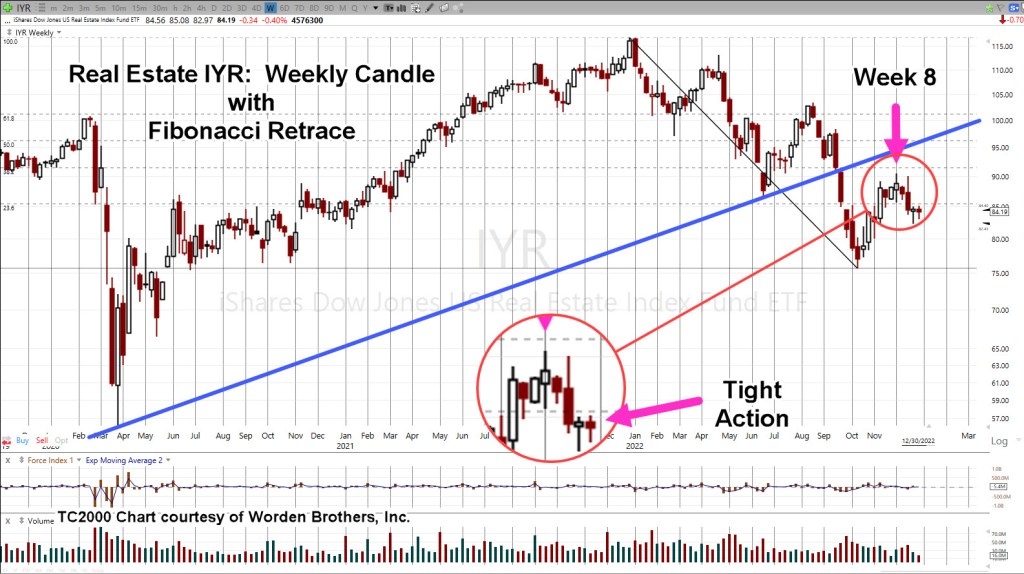
Real estate IYR, had its print high during Fibonacci Week 8, as shown below in the original forecast.
The next chart shows where we are now, again on the weekly timeframe.
Real Estate IYR, Weekly
Original Analysis & Forecast
The updated chart shows the subsequent price action.
Real estate IYR, has pivoted lower and posted tight price action over the past two weeks. Tight action typically precedes a breakout or directional move.
Summary
Anything can happen in the markets.
Even though a good analysis has been presented to indicate further downside for IYR, this Tuesday’s action will let us know for sure.
Typical vehicles to go short the sector are leveraged inverse funds DRV (-3X) and SRS (-2X) or to short the IYR directly (not advice, not a recommendation).
Note: Posts on this site are for education purposes only. They provide one firm’s insight on the markets. Not investment advice. See additional disclaimer here.
Pick up almost any trading book like Reminiscences of a Stock Operator, and you’ll find, the big money was made on the downside.
In Livermore’s case from ‘Reminiscences’, he saw a big crash coming, went short in a big way, and was then squeezed out of his positions during market rallies in 1906.
The short trades were too early; he blew up his account.
Undaunted, he took drastic measures to raise capital (hawked his car), got back in, shorted, and cleared over $1-milllion in profits near the bottom on October 24th, 1907.
The Ukraine War & The Boer War
As spectacular as his profits were, for us that might not be the most important part.
Take a look at the list below, paraphrased from Livermore’s account of The Boer War and overall economic conditions; see if it doesn’t match up to today.
The British were just coming off the Boer war, having spent hundreds of billions (in today’s Pound-Sterling), and money was tight.
There was significant wealth destruction world-wide.
The San Fransico earthquake of 1906, was causing economic disruption and the need for even more cash.
Note: As reported here, seismic activity is picking up. We’ve just had a major quake (again) in California.
There were plenty of warnings of an impending collapse but as Livermore puts it, the masses paid no heed as they were more concerned with baseball.
Fabrication & Fact
There’s some scuttlebutt, The Panic of 1907, was a fabricated event, used to usher in fractional reserve banking.
Is this all starting to sound familiar?
Now, we have the potential of Neo Feudalism, going right along with Universal Basic Income and Digital Currency.
That should be enough intro to get us to the chart at hand, Real Estate IYR, but first, this just out, on MarketWatch:
Worst Year, Since 2008.
It’s already the worst since 2008, and as Jerimiah Babe puts it, ‘we haven’t even got started’.
Reference time stamp 12:07, in the link and see if it does not match exactly with Livermore’s observations.
All of which brings us to real estate.
Real Estate IYR Weekly, Close
The chart shows the most conservative (modestly declining) trading channel
The next chart, is where it gets scary.
The second (potential) channel is declining at approximately -62%, on an annualized basis.
Weekly timeframes are presented here on purpose.
Doing so, gets us away from the everyday, every blip, analysis and looks at things strategically. It’s obvious, barring some kind of intervention, real estate’s in trouble.
The January of No Effect
It’s well known, stocks tend to rise in the first weeks of January. Tax loss selling is over and there’s typically some type of ‘relief’.
Don’t count on it this time (not advice, not a recommendation).
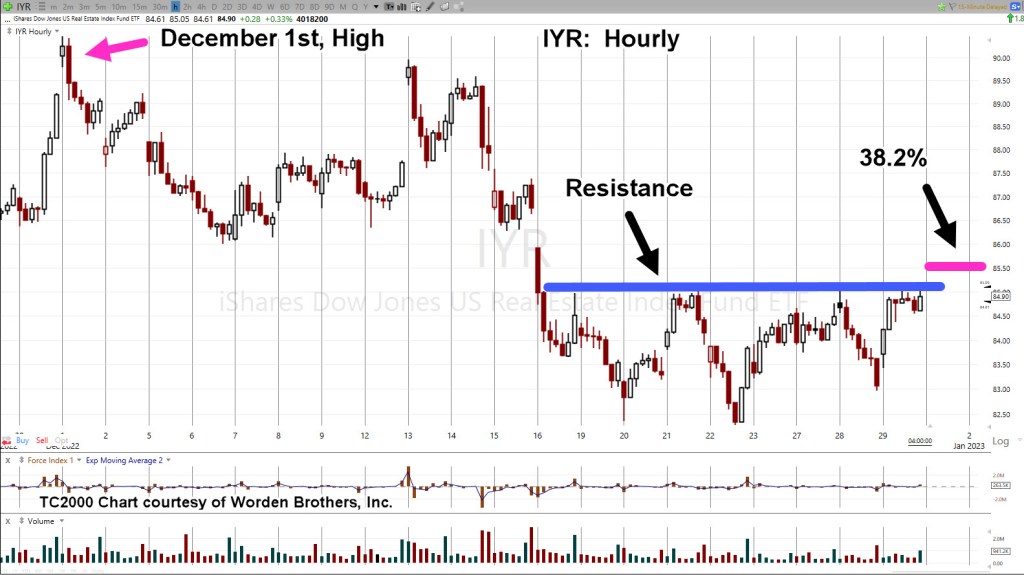
Even as this post is being created, IYR, is pivoting lower and possibly confirming the more aggressive right-side trendline (second chart, above).
Summary
We’ll end with more paraphrase from Livermore’s account of the panic.
He describes being in Ed Harding’s office (his broker), telling him that ‘now is the time’, ‘today is the day’. All the while, stocks were drifting, everything was quiet.
Livermore said to Harding:
‘The longer that stocks delayed, the bigger the break will be when it comes.’
Let’s see if that applies to us, exactly 100-years later (Reminiscences, published in 1923).
Note: Posts on this site are for education purposes only. They provide one firm’s insight on the markets. Not investment advice. See additional disclaimer here.
Note: Posts on this site are for education purposes only. They provide one firm’s insight on the markets. Not investment advice. See additional disclaimer here.